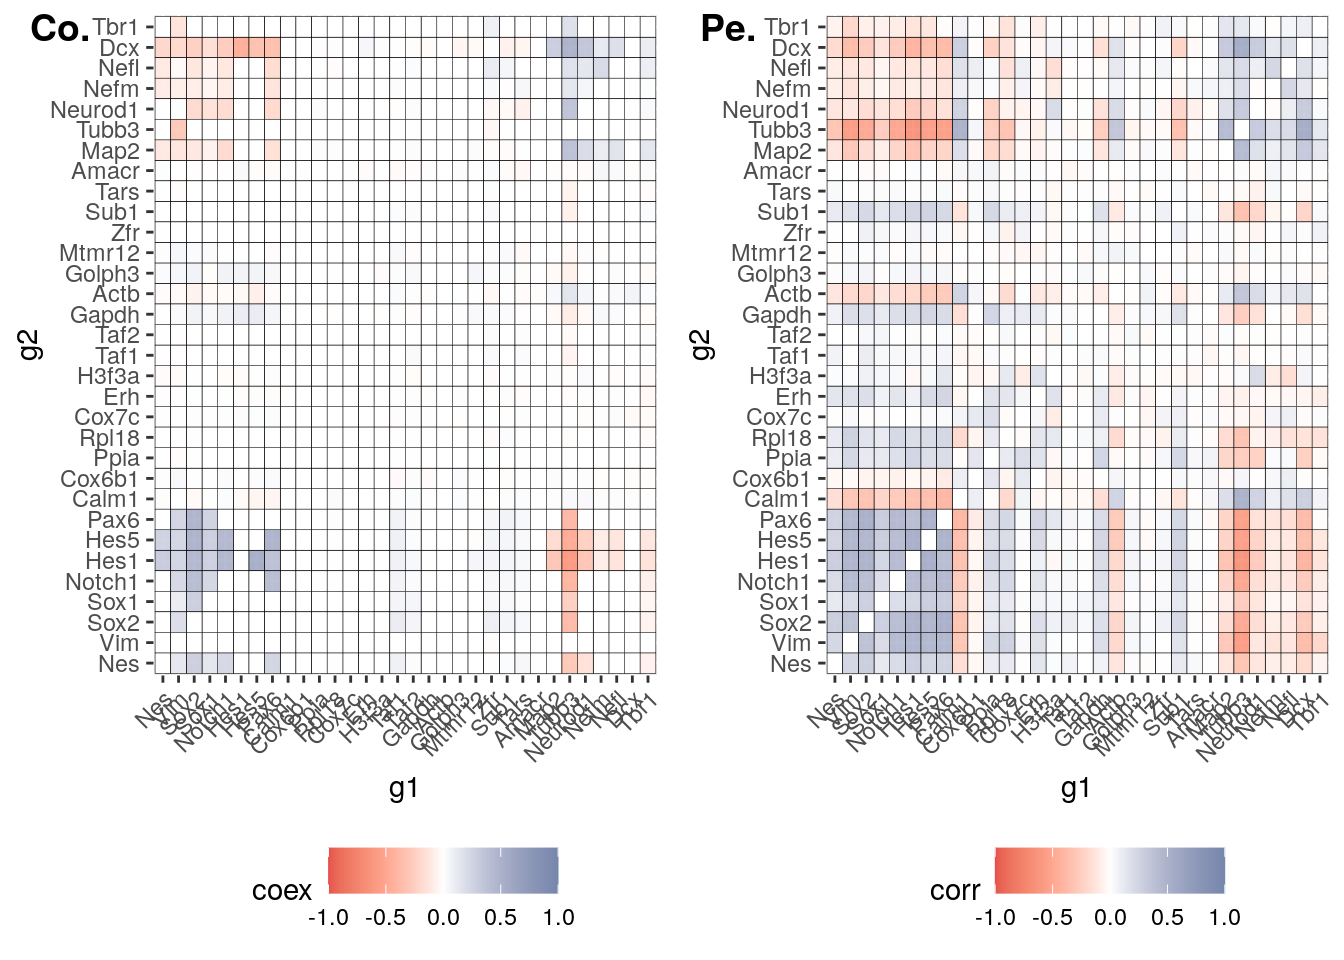
Seurat correlation vs cotan heatmap
input_dir = "Data/mouse_dentate_gyrus/"

E16.5_cotan = readRDS("Data/E16.5_cleaned.cotan.RDS")

t = "E16.5"

pbmc.data = read.csv("Data/mouse_dentate_gyrus/separation_age/E16.5.csv",
    header = T, row.names = 1)


pbmc.data = pbmc.data[, colnames(E16.5_cotan@raw)]

rownames(pbmc.data)[grep("_", rownames(pbmc.data))] = gsub("_",
    "-", rownames(pbmc.data)[grep("_", rownames(pbmc.data))])

pbmc.data = as(as.matrix(pbmc.data), "sparseMatrix")
lib.size = colSums(pbmc.data)
hist(lib.size, prob = TRUE, breaks = 145)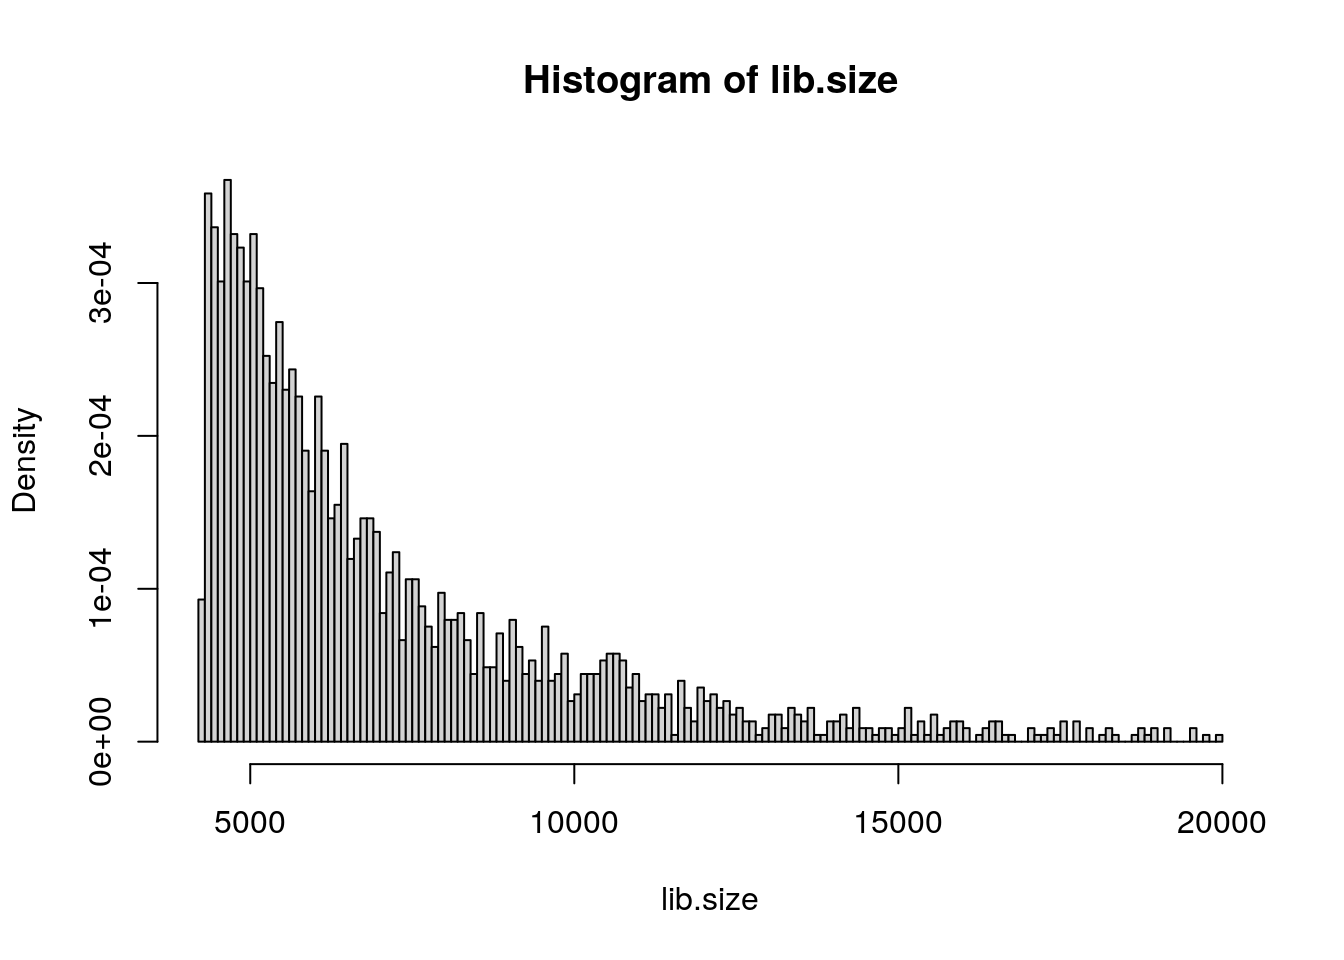
fit <- fitdist(lib.size, "nbinom")
prob.treshold = qnbinom((1 - 0.001), size = fit$estimate[1],
    mu = fit$estimate[2])
pbmc.data = pbmc.data[, names(lib.size[lib.size <
    prob.treshold])]
lib.size = colSums(pbmc.data)
hist(lib.size, prob = TRUE, breaks = 145)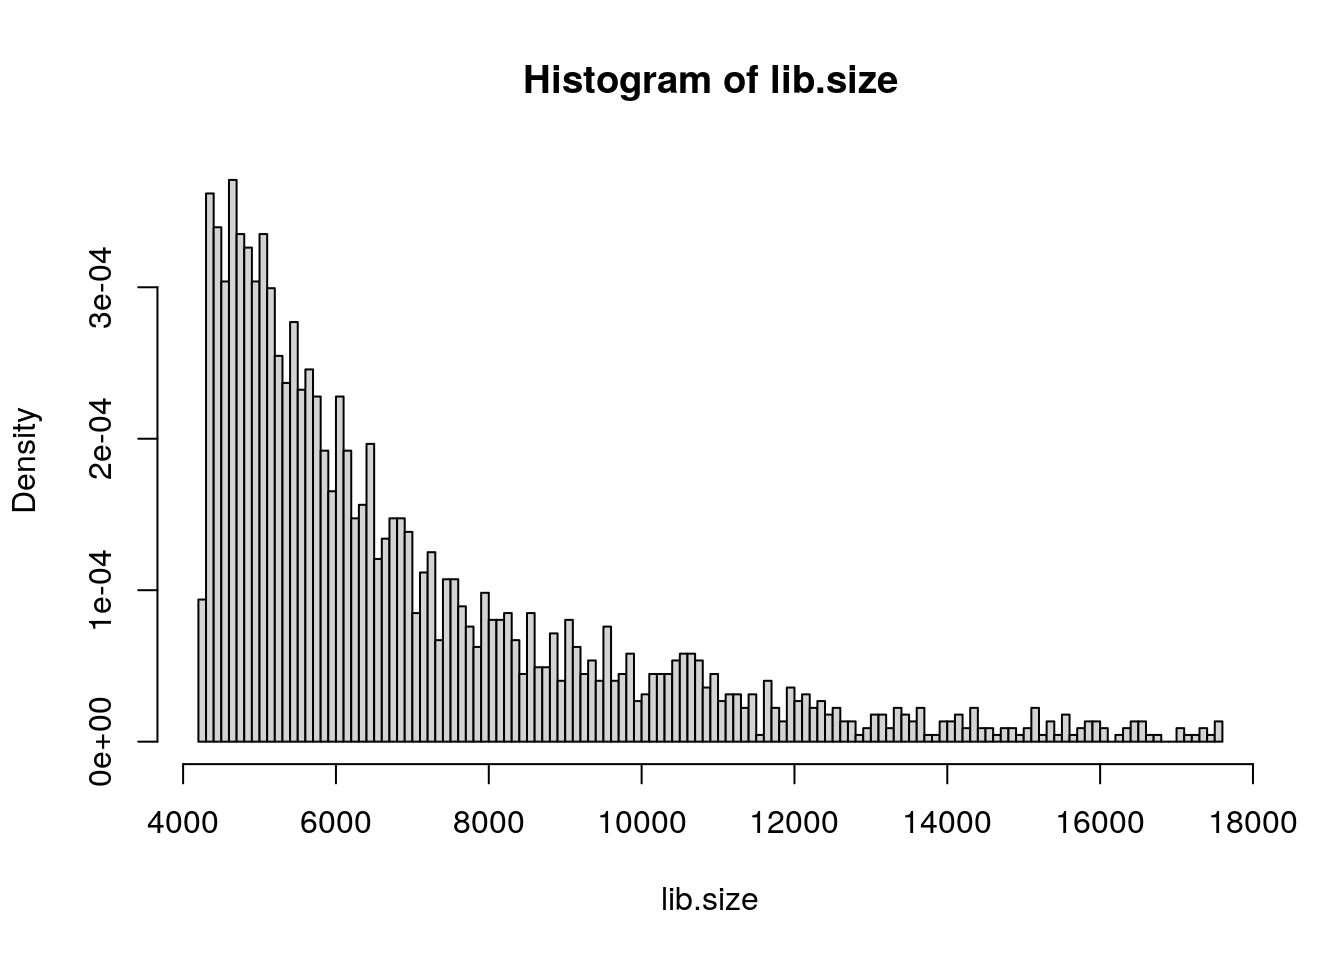
pbmc <- CreateSeuratObject(counts = pbmc.data,
    project = "hipp_1_E16.5", min.cells = 3,
    min.features = 200)
pbmc
#> An object of class Seurat
#> 15604 features across 2238 samples within 1 assay
#> Active assay: RNA (15604 features, 0 variable features)pbmc[["percent.mt"]] <- PercentageFeatureSet(pbmc,
pattern = "^mt-")
VlnPlot(pbmc, features = c("nFeature_RNA",
"nCount_RNA", "percent.mt"), ncol = 3)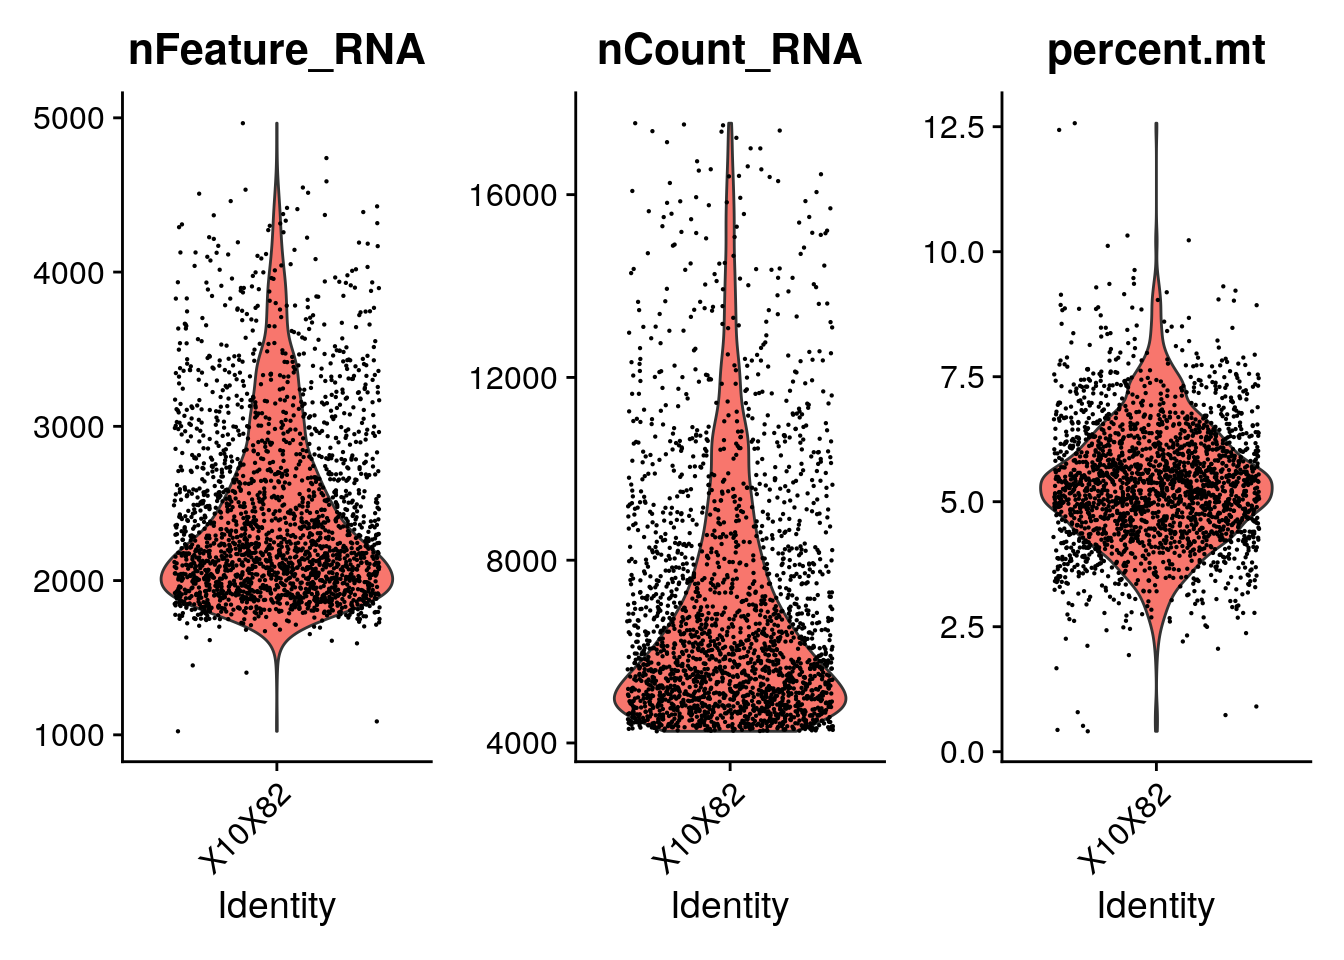
plot1 <- FeatureScatter(pbmc, feature1 = "nCount_RNA",
    feature2 = "percent.mt")
plot2 <- FeatureScatter(pbmc, feature1 = "nCount_RNA",
    feature2 = "nFeature_RNA")
CombinePlots(plots = list(plot1, plot2))
subset(pbmc, subset = nFeature_RNA > 200 &
    nFeature_RNA < 4000 & percent.mt < 7.5)
#> An object of class Seurat
#> 15604 features across 2083 samples within 1 assay
#> Active assay: RNA (15604 features, 0 variable features)
length(pbmc$nFeature_RNA)
#> [1] 2238
plot1 <- FeatureScatter(pbmc, feature1 = "nCount_RNA",
feature2 = "percent.mt")
plot2 <- FeatureScatter(pbmc, feature1 = "nCount_RNA",
feature2 = "nFeature_RNA")
CombinePlots(plots = list(plot1, plot2))
pbmc[["RNA"]]@data[1:10, 1:10]
#> 10 x 10 sparse Matrix of class "dgCMatrix"
#>    [[ suppressing 10 column names 'X10X82_1_CAGAACAAGTTCTG.', 'X10X82_1_TCACTTCTCGCATC.', 'X10X82_1_TCACTCATATGCTG.' ... ]]
#>
#> 0610007P14Rik 1.7126992 1.143042 1.077085 0.9062106 2.082862 0.8906782
#> 0610009B22Rik 0.7589239 1.143042 .        0.9062106 1.206710 0.8906782
#> 0610009L18Rik .         .        .        0.9062106 .        .
#> 0610009O20Rik 1.1853870 .        .        .         .        .
#> 0610010F05Rik .         1.143042 .        .         .        0.8906782
#> 0610010K14Rik 1.7126992 .        .        0.9062106 .        .
#> 0610011F06Rik .         .        1.077085 0.9062106 1.206710 .
#> 0610012G03Rik 1.7126992 1.143042 1.918146 1.3736782 1.206710 1.3541748
#> 0610025J13Rik .         .        .        .         .        .
#> 0610030E20Rik .         .        .        .         .        0.8906782
#>
#> 0610007P14Rik 1.3936138 .        1.680767 1.8883605
#> 0610009B22Rik .         1.700242 .        .
#> 0610009L18Rik .         .        .        .
#> 0610009O20Rik .         .        .        .
#> 0610010F05Rik 0.9221505 .        .        .
#> 0610010K14Rik .         .        .        0.8763564
#> 0610011F06Rik 0.9221505 .        .        0.8763564
#> 0610012G03Rik 0.9221505 2.042896 1.158401 1.3361221
#> 0610025J13Rik 0.9221505 .        .        .
#> 0610030E20Rik .         .        .        .
Code to produce the heatmap of Seurat correlation matrix vs cotan heatmap on selected genes.
seurat.data = pbmc[["RNA"]]@data
seurat.data.cor.pearson = cor(t(as.matrix(seurat.data)),
    method = "pearson")
# write.csv(seurat.data.cor, file =
# '../results/2019.12.16/E16.5_hipp_Seurat_correlations.csv'
# )

partial.coex.pearson = seurat.data.cor.pearson[rownames(seurat.data.cor.pearson) %in%
    c(tf1, tf2, hk), colnames(seurat.data.cor.pearson) %in%
    c(tf1, tf2, hk)]
diag(partial.coex.pearson) = 0

seurat.data.cor.spearman = cor(t(as.matrix(seurat.data)),
    method = "spearman")
# write.csv(seurat.data.cor, file =
# '../results/2019.12.16/E16.5_hipp_Seurat_correlations.csv'
# )

partial.coex.spearman = seurat.data.cor.spearman[rownames(seurat.data.cor.spearman) %in%
    c(tf1, tf2, hk), colnames(seurat.data.cor.spearman) %in%
    c(tf1, tf2, hk)]
diag(partial.coex.spearman) = 0
1 Pearson correlation
partial.coex.pearson = reshape2::melt(partial.coex.pearson)
colnames(partial.coex.pearson) = c("g1","g2","corr")

partial.coex.pearson$g1 <- factor(partial.coex.pearson$g1, c(tf1,hk,tf2))
partial.coex.pearson$g2 <- factor(partial.coex.pearson$g2, c(tf1,hk,tf2))

  P = ggplot(partial.coex.pearson) +
  geom_tile(aes(x=g1,y=g2, fill = corr),colour = "black", show.legend = TRUE) +
#  facet_grid( g1 ~ g2  ,scales = "free", space = "free") +
    scale_fill_gradient2(mid = "white",limits=c(-1, 1),low = "#DC0000B2", high = "#3C5488B2")+
  #scale_fill_gradient2(low = "darkred", mid = "white",  high = "darkblue", midpoint = 0,na.value = "grey80", space = "Lab", guide = "colourbar", aesthetics = "fill", limits = lim_coex, oob=scales::squish)+ theme(legend.position="bottom")+
  theme(#legend.title = element_blank(),
    #strip.text.x = element_text(color = "red"),
    #axis.text.y = element_text(color = ),
    axis.text.x = element_text(angle=45,hjust=1,vjust=1.0),
    legend.position="bottom"
  ) #+geom_text(aes(label=ifelse(t_hk == "hk", "H","")), color="grey", size=3)
  P
2 Spearman correlation
partial.coex.spearman = reshape2::melt(partial.coex.spearman)
colnames(partial.coex.spearman) = c("g1","g2","corr")

partial.coex.spearman$g1 <- factor(partial.coex.spearman$g1, c(tf1,hk,tf2))
partial.coex.spearman$g2 <- factor(partial.coex.spearman$g2, c(tf1,hk,tf2))

  S = ggplot(partial.coex.spearman) +
  geom_tile(aes(x=g1,y=g2, fill = corr),colour = "black", show.legend = TRUE) +
#  facet_grid( g1 ~ g2  ,scales = "free", space = "free") +
    scale_fill_gradient2(mid = "white",limits=c(-1, 1),low = "#DC0000B2", high = "#3C5488B2")+
  #scale_fill_gradient2(low = "darkred", mid = "white",  high = "darkblue", midpoint = 0,na.value = "grey80", space = "Lab", guide = "colourbar", aesthetics = "fill", limits = lim_coex, oob=scales::squish)+ theme(legend.position="bottom")+
  theme(#legend.title = element_blank(),
    #strip.text.x = element_text(color = "red"),
    #axis.text.y = element_text(color = ),
    axis.text.x = element_text(angle=45,hjust=1,vjust=1.0),
    legend.position="bottom"
  ) #+geom_text(aes(label=ifelse(t_hk == "hk", "H","")), color="grey", size=3)
  S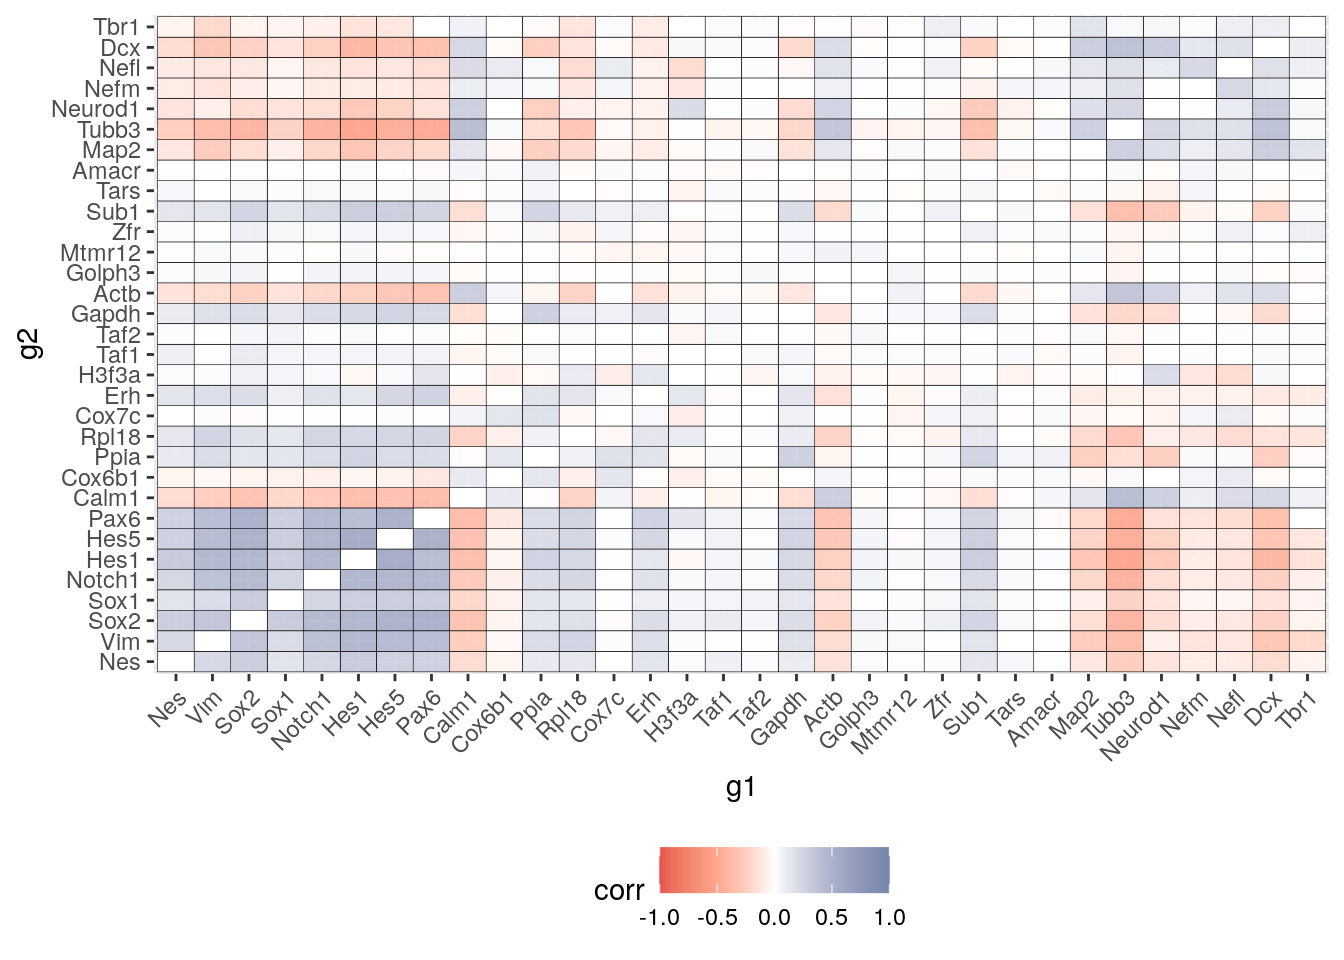
3 COTAN coex
#load_data3.0(input_dir, cond = t, genes = c(tf1,tf2,hk), prefix = "p_value_")

# COTAN: after loading in memeory the coex matrix
p_value_E16.5 = get.pval(object = E16.5_cotan, gene.set.col = c(tf1,tf2,hk),
                         gene.set.row = c(tf1,tf2,hk))
#>  [1] "Nes"     "Vim"     "Sox2"    "Sox1"    "Notch1"  "Hes1"    "Hes5"
#>  [8] "Pax6"    "Map2"    "Tubb3"   "Neurod1" "Nefm"    "Nefl"    "Dcx"
#> [15] "Tbr1"    "Calm1"   "Cox6b1"  "Ppia"    "Rpl18"   "Cox7c"   "Erh"
#> [22] "H3f3a"   "Taf1"    "Taf2"    "Gapdh"   "Actb"    "Golph3"  "Mtmr12"
#> [29] "Zfr"     "Sub1"    "Tars"    "Amacr"
#> [1] "Get p-values on a set of genes on columns on a set of genes on rows"
#> [1] "Using function S"
#> [1] "function to generate S "

partial.coex.cotan = E16.5_cotan@coex[rownames(E16.5_cotan@coex) %in% c(tf1,tf2,hk),colnames(E16.5_cotan@coex) %in% c(tf1,tf2,hk)]

#partial.pval.cotan = p_value_E16.5[rownames(p_value_E16.5) %in% c(tf1,tf2,hk),colnames(p_value_E16.5) %in% c(tf1,tf2,hk)]
partial.pval.cotan =p_value_E16.5
#partial.pval.cotan = partial.pval.cotan <= 0.05
#partial.coex.cotan[!partial.pval.cotan] <- 0

  partial.coex.cotan = reshape2::melt(as.matrix(partial.coex.cotan))
  colnames(partial.coex.cotan) = c("g1","g2","coex")
  for (n in c(1:nrow(partial.coex.cotan))) {
    if (partial.coex.cotan[n,"g1"] == partial.coex.cotan[n,"g2"]) {
      partial.coex.cotan[n,"coex"]=0
    }

  }

  partial.coex.cotan$g1 <- factor(partial.coex.cotan$g1, c(tf1,hk,tf2))
  partial.coex.cotan$g2 <- factor(partial.coex.cotan$g2, c(tf1,hk,tf2))

C = ggplot(partial.coex.cotan) +
    geom_tile(aes(x=g1,y=g2, fill = coex),colour = "black", show.legend = TRUE) +
    #  facet_grid( g1 ~ g2  ,scales = "free", space = "free") +
    scale_fill_gradient2(mid = "white",limits=c(round(min(partial.coex.cotan$coex),digits = 0), round(max(partial.coex.cotan$coex),digits = 0)),low = "#DC0000B2", high = "#3C5488B2")+
    #scale_fill_gradient2(low = "darkred", mid = "white",  high = "darkblue", midpoint = 0,na.value = "grey80", space = "Lab", guide = "colourbar", aesthetics = "fill", limits = lim_coex, oob=scales::squish)+ theme(legend.position="bottom")+
    theme(#legend.title = element_blank(),
      #strip.text.x = element_text(color = "red"),
      #axis.text.y = element_text(color = ),
      axis.text.x = element_text(angle=45,hjust=1,vjust=1.0),
      legend.position="bottom"
    )#+geom_text(aes(label=ifelse(t_hk == "hk", "H","")), color="grey", size=3)


#figure <- ggarrange(C, S,
 #                   labels = c("Co.", "Sp."),
 #                   ncol = 2, nrow = 1)
#figure
C
sessionInfo()
#> R version 4.0.4 (2021-02-15)
#> Platform: x86_64-pc-linux-gnu (64-bit)
#> Running under: Ubuntu 18.04.5 LTS
#>
#> Matrix products: default
#> BLAS:   /usr/lib/x86_64-linux-gnu/openblas/libblas.so.3
#> LAPACK: /usr/lib/x86_64-linux-gnu/libopenblasp-r0.2.20.so
#>
#> locale:
#>  [1] LC_CTYPE=en_US.UTF-8       LC_NUMERIC=C
#>  [3] LC_TIME=en_US.UTF-8        LC_COLLATE=en_US.UTF-8
#>  [5] LC_MONETARY=en_US.UTF-8    LC_MESSAGES=en_US.UTF-8
#>  [7] LC_PAPER=en_US.UTF-8       LC_NAME=C
#>  [9] LC_ADDRESS=C               LC_TELEPHONE=C
#> [11] LC_MEASUREMENT=en_US.UTF-8 LC_IDENTIFICATION=C
#>
#> attached base packages:
#> [1] stats     graphics  grDevices utils     datasets  methods   base
#>
#> other attached packages:
#>  [1] COTAN_0.1.0        ggpubr_0.4.0       gridExtra_2.3      ggrepel_0.9.1
#>  [5] ggplot2_3.3.3      ggsci_2.9          fitdistrplus_1.1-3 survival_3.2-10
#>  [9] MASS_7.3-53.1      Matrix_1.3-2       SeuratObject_4.0.0 Seurat_4.0.1
#> [13] dplyr_1.0.4
#>
#> loaded via a namespace (and not attached):
#>   [1] circlize_0.4.12       readxl_1.3.1          backports_1.2.1
#>   [4] plyr_1.8.6            igraph_1.2.6          lazyeval_0.2.2
#>   [7] splines_4.0.4         listenv_0.8.0         scattermore_0.7
#>  [10] digest_0.6.27         htmltools_0.5.1.1     fansi_0.4.2
#>  [13] magrittr_2.0.1        tensor_1.5            cluster_2.1.1
#>  [16] ROCR_1.0-11           openxlsx_4.2.3        ComplexHeatmap_2.6.2
#>  [19] globals_0.14.0        matrixStats_0.58.0    spatstat.sparse_2.0-0
#>  [22] colorspace_2.0-0      rappdirs_0.3.3        haven_2.3.1
#>  [25] xfun_0.22             crayon_1.4.0          jsonlite_1.7.2
#>  [28] spatstat.data_2.1-0   zoo_1.8-8             glue_1.4.2
#>  [31] polyclip_1.10-0       gtable_0.3.0          leiden_0.3.7
#>  [34] GetoptLong_1.0.5      car_3.0-10            shape_1.4.5
#>  [37] future.apply_1.7.0    BiocGenerics_0.36.0   abind_1.4-5
#>  [40] scales_1.1.1          DBI_1.1.1             rstatix_0.7.0
#>  [43] miniUI_0.1.1.1        Rcpp_1.0.6            viridisLite_0.3.0
#>  [46] xtable_1.8-4          clue_0.3-58           reticulate_1.18
#>  [49] spatstat.core_1.65-5  foreign_0.8-81        stats4_4.0.4
#>  [52] htmlwidgets_1.5.3     httr_1.4.2            RColorBrewer_1.1-2
#>  [55] ellipsis_0.3.1        ica_1.0-2             farver_2.1.0
#>  [58] pkgconfig_2.0.3       sass_0.3.1            uwot_0.1.10
#>  [61] deldir_0.2-10         utf8_1.2.1            labeling_0.4.2
#>  [64] tidyselect_1.1.0      rlang_0.4.10          reshape2_1.4.4
#>  [67] later_1.1.0.1         munsell_0.5.0         cellranger_1.1.0
#>  [70] tools_4.0.4           generics_0.1.0        broom_0.7.5
#>  [73] ggridges_0.5.3        evaluate_0.14         stringr_1.4.0
#>  [76] fastmap_1.1.0         yaml_2.2.1            goftest_1.2-2
#>  [79] knitr_1.31            zip_2.1.1             purrr_0.3.4
#>  [82] RANN_2.6.1            pbapply_1.4-3         future_1.21.0
#>  [85] nlme_3.1-152          mime_0.10             formatR_1.8
#>  [88] compiler_4.0.4        filelock_1.0.2        plotly_4.9.3
#>  [91] curl_4.3              png_0.1-7             ggsignif_0.6.1
#>  [94] spatstat.utils_2.1-0  tibble_3.1.0          bslib_0.2.4
#>  [97] stringi_1.5.3         highr_0.8             basilisk.utils_1.2.2
#> [100] forcats_0.5.1         lattice_0.20-41       vctrs_0.3.6
#> [103] pillar_1.5.1          lifecycle_1.0.0       spatstat.geom_1.65-5
#> [106] lmtest_0.9-38         jquerylib_0.1.3       GlobalOptions_0.1.2
#> [109] RcppAnnoy_0.0.18      data.table_1.14.0     cowplot_1.1.1
#> [112] irlba_2.3.3           httpuv_1.5.5          patchwork_1.1.1
#> [115] R6_2.5.0              promises_1.2.0.1      KernSmooth_2.23-18
#> [118] rio_0.5.16            IRanges_2.24.1        parallelly_1.24.0
#> [121] codetools_0.2-18      assertthat_0.2.1      rjson_0.2.20
#> [124] withr_2.4.1           sctransform_0.3.2     S4Vectors_0.28.1
#> [127] mgcv_1.8-33           parallel_4.0.4        hms_1.0.0
#> [130] grid_4.0.4            rpart_4.1-15          basilisk_1.2.1
#> [133] tidyr_1.1.2           rmarkdown_2.7         carData_3.0-4
#> [136] Cairo_1.5-12.2        Rtsne_0.15            shiny_1.6.0