Negative dataset analysis
library(ggplot2)
library(ggrepel)
library(COTAN)
library(Hmisc)
#> Loading required package: lattice
#> Loading required package: survival
#> Loading required package: Formula
#>
#> Attaching package: 'Hmisc'
#> The following objects are masked from 'package:base':
#>
#> format.pval, units
library(Seurat)
#> Attaching SeuratObject
#>
#> Attaching package: 'Seurat'
#> The following object is masked from 'package:Hmisc':
#>
#> Key
library(patchwork)
library(scales)
p_value_plot <- function(p_values, obj) {
p_values[lower.tri(p_values, diag = TRUE)] <- NA
p_values2 = as.data.frame(as.table(as.matrix(p_values)))
if (nrow(p_values2) > 10000) {
p_values2 = p_values2[sample(nrow(p_values2),
(nrow(p_values2)/20)), ]
}
p_values2 = p_values2[complete.cases(p_values2),
]
p_values2 = p_values2[order(p_values2$Freq,
decreasing = F), ]
p_values2$n = c(1:nrow(p_values2))/nrow(p_values2)
p_values = get.pval(obj, type_stat = "G")
p_values[lower.tri(p_values, diag = TRUE)] <- NA
p_values3 = as.data.frame(as.table(as.matrix(p_values)))
if (nrow(p_values3) > 10000) {
p_values3 = p_values3[sample(nrow(p_values3),
(nrow(p_values3)/20)), ]
}
p_values3 = p_values3[complete.cases(p_values3),
]
p_values3 = p_values3[order(p_values3$Freq,
decreasing = F), ]
p_values3$n = c(1:nrow(p_values3))/nrow(p_values3)
print(dim(p_values2))
print(dim(p_values3))
p_values2$Type = "Chi-squared test"
p_values3$Type = "G-test"
p_values = rbind(p_values2, p_values3)
#---------for p-values form pearson correlation usign Seurat normalization
seur.obj <- CreateSeuratObject(counts = as.matrix(obj@raw),
project = "neg", min.cells = 0, min.features = 2)
seur.obj <- NormalizeData(seur.obj)
# seur.obj[['RNA']]@data[1:10,1:10]
seurat.data = as.matrix(seur.obj[["RNA"]]@data)
p_val.pearson = rcorr(t(seurat.data),
type = "pearson")
p_values4 = as.data.frame(as.table(as.matrix(p_val.pearson$P)))
if (nrow(p_values4) > 10000) {
p_values4 = p_values4[sample(nrow(p_values4),
(nrow(p_values4)/20)), ]
}
p_values4 = p_values4[complete.cases(p_values4),
]
p_values4 = p_values4[order(p_values4$Freq,
decreasing = F), ]
p_values4$n = c(1:nrow(p_values4))/nrow(p_values4)
p_values4$Type = "Pearson on Seurat normalized data"
p_values = rbind(p_values, p_values4)
#-----------------------------
plot_p = ggplot(p_values, aes(x = Freq,
y = n, colour = Type)) + theme(axis.text.x = element_text(size = 12,
angle = 0, hjust = 0.5, vjust = 0.5,
face = "plain"), axis.text.y = element_text(size = 12,
angle = 0, hjust = 0, vjust = 0.5,
face = "plain"), axis.title.x = element_text(size = 12,
angle = 0, hjust = 0.5, vjust = 0,
face = "plain"), axis.title.y = element_text(size = 12,
angle = 90, hjust = 0.5, vjust = 0.5,
face = "plain")) + geom_abline(linetype = "dashed") +
labs(x = "p-value", y = "percentile") +
geom_line(size = 1.5)
# scale_x_log10(breaks =
# trans_breaks('log10', function(x)
# 10^x), labels = trans_format('log10',
# math_format(10^.x))) +
# scale_y_log10(breaks =
# trans_breaks('log10', function(x)
# 10^x), labels = trans_format('log10',
# math_format(10^.x))) +
# annotation_logticks()
return(plot_p)
}
plot.GDI.density <- function(GDI.df) {
si = 11
mycolours <- c(Constitutive = "#00A087FF",
dif = "#E64B35FF", normal = "#8491B4B2")
themex = theme(axis.text.x = element_text(size = si,
angle = 90, hjust = 0.5, vjust = 0.5,
face = "plain", colour = "#3C5488FF"),
axis.text.y = element_blank(), axis.title.x = element_blank(),
axis.title.y = element_text(size = si,
angle = 90, hjust = 0.5, vjust = 0.5,
face = "plain", colour = "#3C5488FF"),
legend.position = "none")
themey = theme(axis.text.y = element_text(size = si,
angle = 0, hjust = 0.5, vjust = 0.5,
face = "plain", colour = "#3C5488FF"),
axis.title.x = element_text(size = si,
angle = 0, hjust = 0.5, vjust = 0.5,
face = "plain", colour = "#3C5488FF"),
axis.text.x.bottom = element_blank(),
axis.title.y = element_blank(), legend.position = "none")
f1 = ggplot(GDI.df, aes(x = sum.raw.norm,
y = GDI)) + geom_point(alpha = 0.4,
color = "#8491B4B2", size = 2.5)
GDI.df_lin = f1 + geom_hline(yintercept = 1.5,
linetype = "dotted", color = "red",
size = 1) + scale_color_manual("Status",
values = mycolours) + scale_fill_manual("Status",
values = mycolours) + xlab("log normalized counts") +
ylab("GDI") + theme(axis.text.x = element_text(size = si,
angle = 0, hjust = 0.5, vjust = 0.5,
face = "plain", colour = "#3C5488FF"),
axis.text.y = element_text(size = si,
angle = 0, hjust = 0, vjust = 0.5,
face = "plain", colour = "#3C5488FF"),
axis.title.x = element_text(size = si,
angle = 0, hjust = 0.5, vjust = 0,
face = "plain", colour = "#3C5488FF"),
axis.title.y = element_text(size = si,
angle = 90, hjust = 0.5, vjust = 0.5,
face = "plain", colour = "#3C5488FF"),
legend.title = element_blank(), legend.text = element_text(color = "#3C5488FF",
face = "italic"), legend.position = "none")
xdensityGDI.df <- ggplot(GDI.df, aes(sum.raw.norm)) +
geom_density(alpha = 0.5, fill = "#8491B4B2",
colour = "#8491B4B2") + themex
ydensityGDI.df <- ggplot(GDI.df, aes(GDI)) +
geom_density(alpha = 0.5, fill = "#00A087FF",
colour = "#00A087FF") + themey +
coord_flip()
GDI.df_lin = xdensityGDI.df + plot_spacer() +
GDI.df_lin + ydensityGDI.df + plot_layout(ncol = 2,
nrow = 2, widths = c(4, 1), heights = c(1,
4))
return(GDI.df_lin)
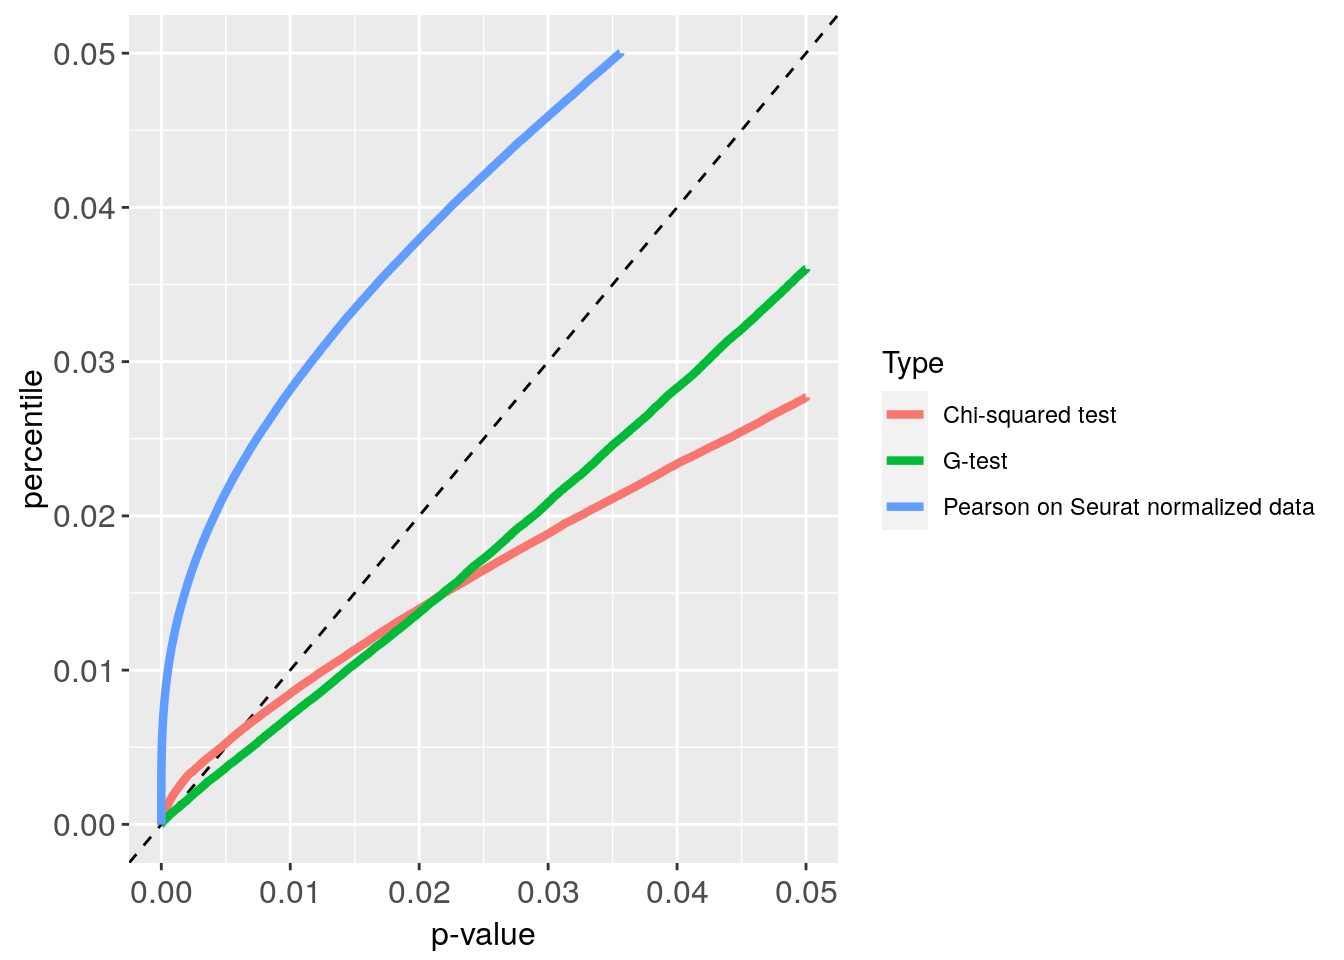
}1 Technical negative dataset: ERCC 10x
p_values_ERCC = get.pval(ERCC)
#> NULL
#> [1] "Get p-values genome wide on columns genome wide on rows"
#> [1] "Using function S"
#> [1] "function to generate S "
Plot_ERCC = p_value_plot(p_values_ERCC, ERCC)
#> NULL
#> [1] "Get p-values genome wide on columns genome wide on rows"
#> [1] "Using function G"
#> [1] "function to generate G "
#> [1] "Generating contingency tables for observed data"
#> [1] "mu estimator creation"
#> [1] "expected contingency tables creation"
#> [1] "The distance between estimated n of zeros and observed number of zero is 0.00446406311693362 over 66"
#> [1] "Done"
#> [1] "G estimation"
#> [1] 2145 4
#> [1] 2145 4
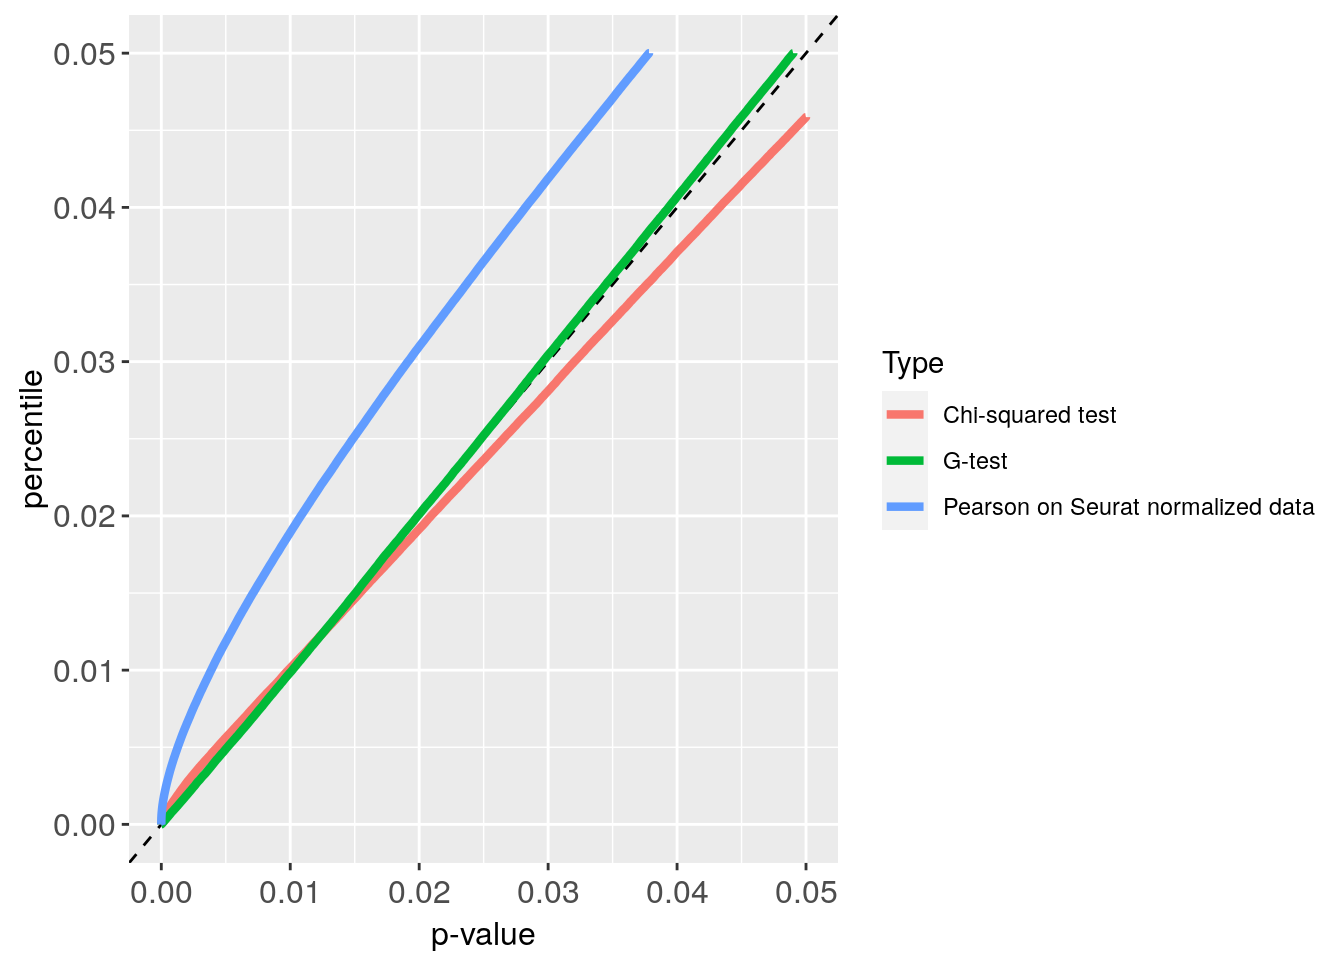
Plot_ERCC

pdf("ERCC_p_value_S_G_plot.pdf")
Plot_ERCC
Plot_ERCC + xlim(0, 0.05) + ylim(0, 0.05)
dev.off()
#> png
#>   2
GDI plot with density
GDI_ercc = get.GDI(ERCC)
#> [1] "function to generate GDI dataframe"
#> [1] "Using S"
#> [1] "function to generate S "

plot.GDI.density(GDI_ercc)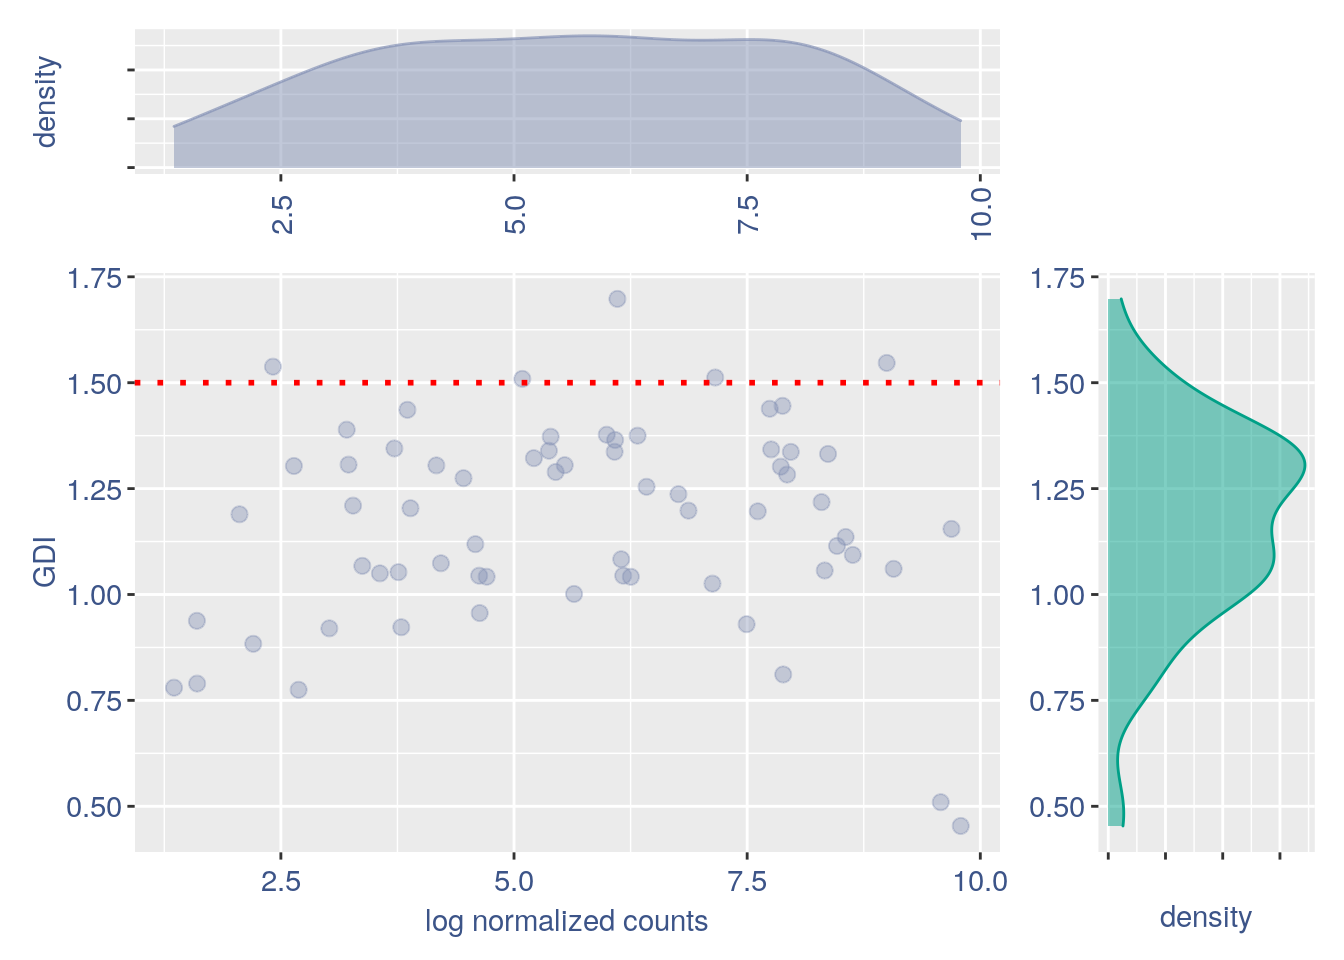
2 Biological negative dataset: CD14+
p_values_CD14 = get.pval(CD14)
#> NULL
#> [1] "Get p-values genome wide on columns genome wide on rows"
#> [1] "Using function S"
#> [1] "function to generate S "

Plot_CD14 = p_value_plot(p_values_CD14, obj = CD14)
#> NULL
#> [1] "Get p-values genome wide on columns genome wide on rows"
#> [1] "Using function G"
#> [1] "function to generate G "
#> [1] "Generating contingency tables for observed data"
#> [1] "mu estimator creation"
#> [1] "expected contingency tables creation"
#> [1] "The distance between estimated n of zeros and observed number of zero is 0.0486027452293039 over 7850"
#> [1] "Done"
#> [1] "G estimation"
#> [1] 1538420       4
#> [1] 1541007       4

Plot_CD14
pdf("CD14_p_value_S_G_plot.pdf")
Plot_CD14
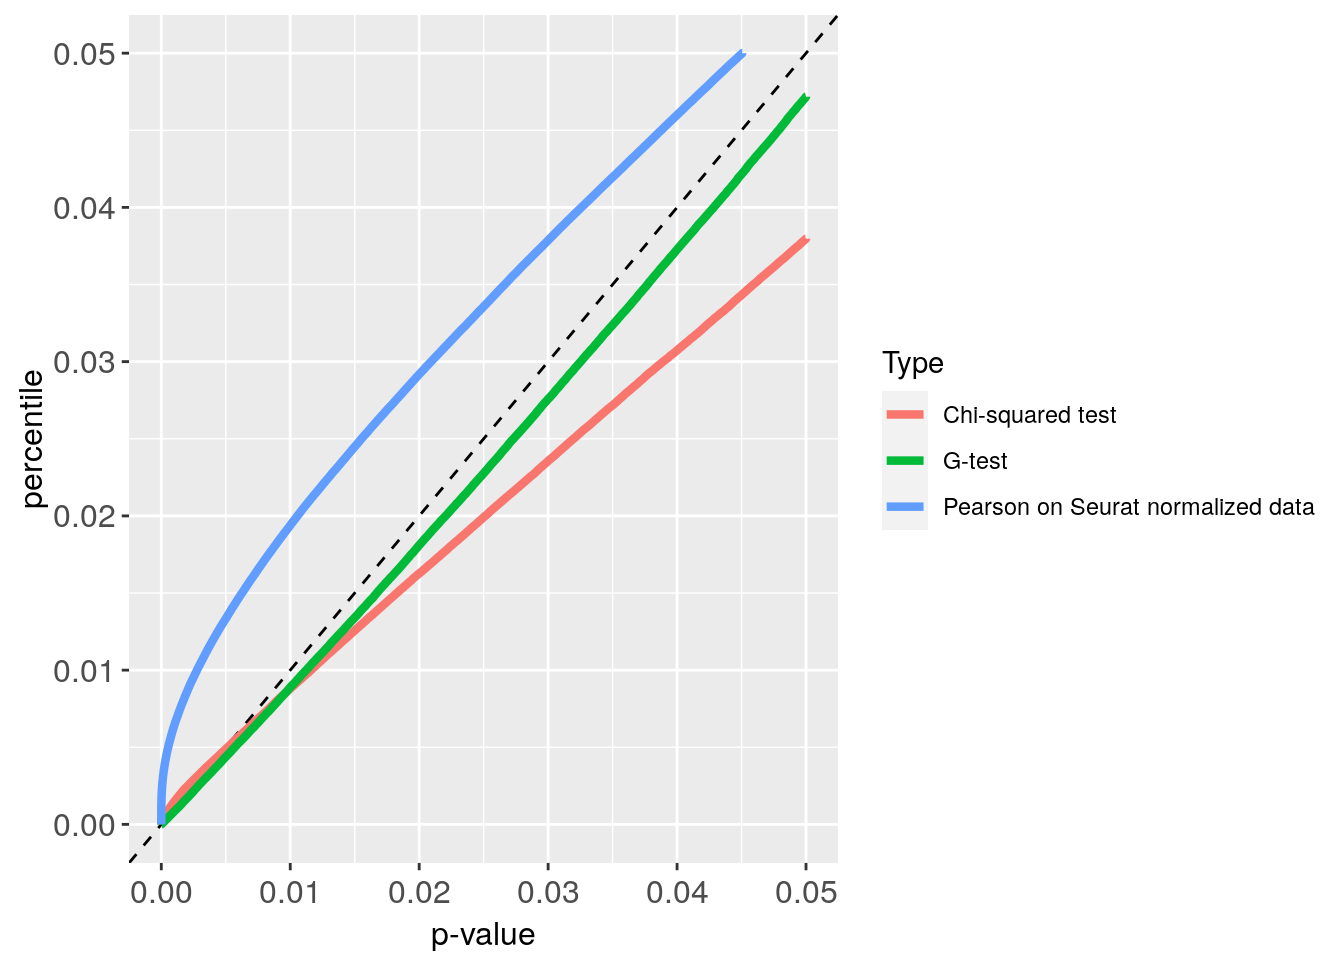
Plot_CD14 + xlim(0, 0.05) + ylim(0, 0.05)
dev.off()
#> png
#> 2GDI plot with density
GDI_CD14 = get.GDI(CD14)
#> [1] "function to generate GDI dataframe"
#> [1] "Using S"
#> [1] "function to generate S "

plot.GDI.density(GDI_CD14)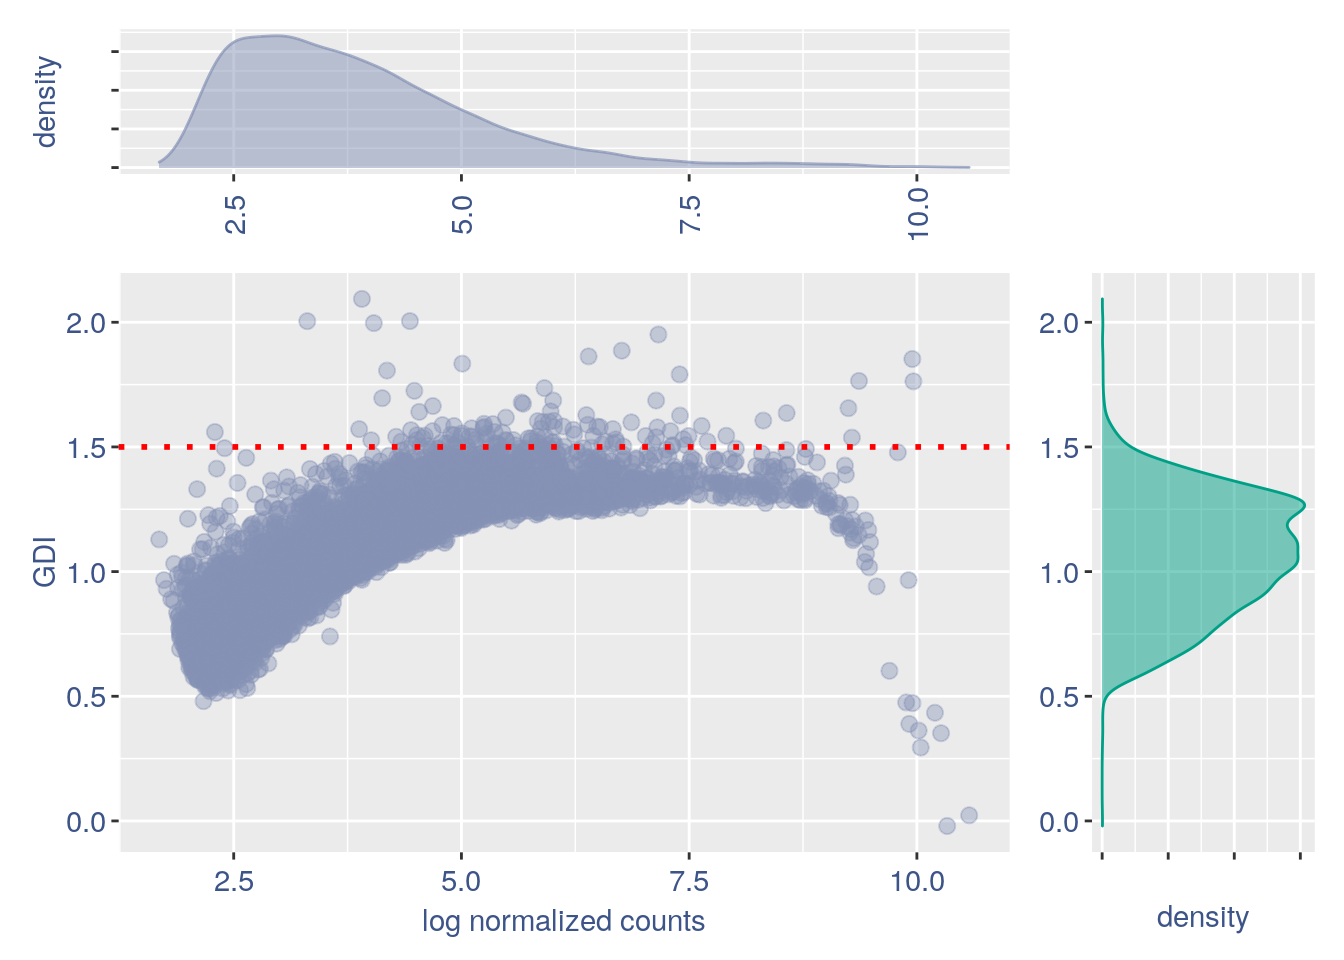
genes = list(genes = rownames(GDI_CD14[GDI_CD14$GDI >
    1.5 & GDI_CD14$sum.raw.norm > 5 & GDI_CD14$exp.cells >
    2.5, ]))
plot_heatmap(df_genes = genes, sets = 1,
    conditions = "CD14", dir = "Data/negative_datasets/")
#> [1] "plot heatmap"
#> [1] "Loading condition CD14"
#>  [1] "ABI3"      "AES"       "ANXA5"     "ARF1"      "ARHGDIB"   "ARPC2"
#>  [7] "ATP5A1"    "ATP5C1"    "ATP6V1G1"  "BCAP31"    "BTF3"      "C1QBP"
#> [13] "CALM2"     "CAMK1"     "CAP1"      "CASP4"     "CD52"      "CD53"
#> [19] "CORO1A"    "CPVL"      "CYCS"      "DDX5"      "EIF3F"     "EIF3H"
#> [25] "EIF3I"     "FKBP1A"    "FXYD5"     "GTF3A"     "H2AFY"     "H2AFZ"
#> [31] "HLA-DMA"   "HLA-DMB"   "HLA-DPA1"  "HLA-DPB1"  "HLA-DQA1"  "HLA-DQA2"
#> [37] "HLA-DQB1"  "HLA-DRA"   "HLA-DRB1"  "HNRNPA0"   "HNRNPA1"   "HNRNPA2B1"
#> [43] "HNRNPC"    "HNRNPDL"   "HSP90AA1"  "HSPA8"     "IMP3"      "ITM2B"
#> [49] "KDELR2"    "LDHA"      "LDHB"      "LSP1"      "LTB"       "LY6E"
#> [55] "MYL12A"    "MYL12B"    "NACA"      "NDUFA12"   "NPM1"      "PARK7"
#> [61] "PCBP1"     "PCBP2"     "PEBP1"     "PGK1"      "PHB2"      "PLAC8"
#> [67] "PPDPF"     "PRR13"     "PSME1"     "PSME2"     "RAC2"      "RANBP1"
#> [73] "RBM3"      "RGS19"     "RHOA"      "RPL4"      "RPL5"      "S100A6"
#> [79] "S100A8"    "S100A9"    "SLC25A3"   "SLC25A5"   "SNX3"      "SPCS1"
#> [85] "SRGN"      "SRI"       "ST13"      "TMEM59"    "TMEM66"    "TPI1"
#> [91] "TUBA1B"    "TYROBP"    "YBX1"
#> [1] "Get p-values on a set of genes on columns on a set of genes on rows"
#> [1] "Using function S"
#> [1] "function to generate S "
#> [1] "genes"
#> [1] "min coex: -0.149628424653907 max coex 0.76273116371318"
3 Syntetic negative dataset: 4000 cells
p_values_CE4000 = get.pval(CE4000)
#> NULL
#> [1] "Get p-values genome wide on columns genome wide on rows"
#> [1] "Using function S"
#> [1] "function to generate S "

Plot_CE4000 = p_value_plot(p_values_CE4000,
    obj = CE4000)
#> NULL
#> [1] "Get p-values genome wide on columns genome wide on rows"
#> [1] "Using function G"
#> [1] "function to generate G "
#> [1] "Generating contingency tables for observed data"
#> [1] "mu estimator creation"
#> [1] "expected contingency tables creation"
#> [1] "The distance between estimated n of zeros and observed number of zero is 0.0574510036838693 over 11670"
#> [1] "Done"
#> [1] "G estimation"
#> [1] 3403098       4
#> [1] 3404947       4

Plot_CE4000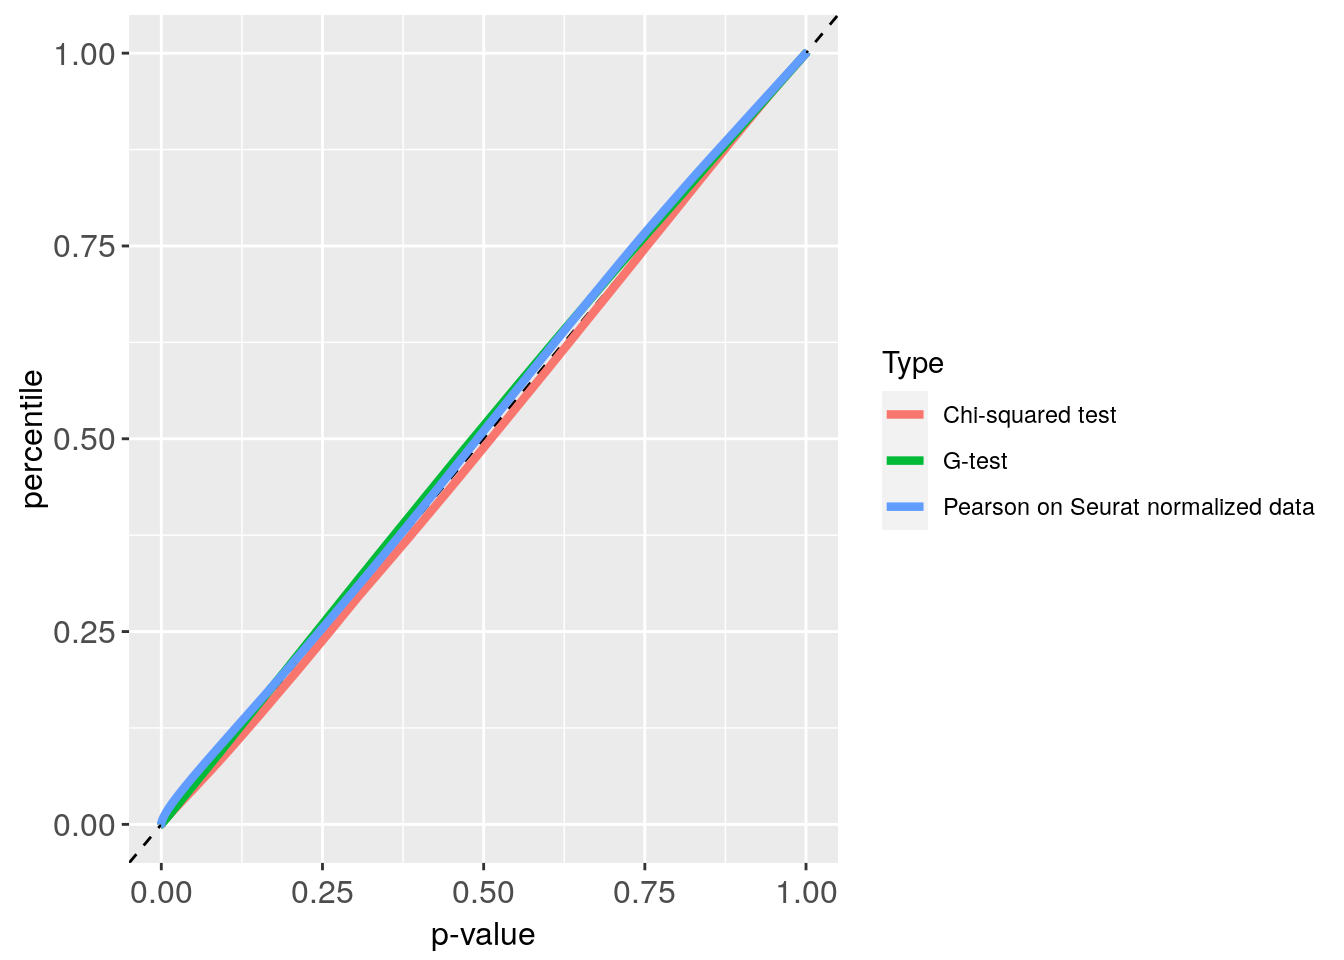
pdf("CE4000_p_value_S_G_plot.pdf")
Plot_CE4000
Plot_CE4000 + xlim(0, 0.05) + ylim(0, 0.05)
dev.off()
#> png
#>   2
GDI_CE4000 = get.GDI(CE4000)
#> [1] "function to generate GDI dataframe"
#> [1] "Using S"
#> [1] "function to generate S "
plot.GDI.density(GDI_CE4000)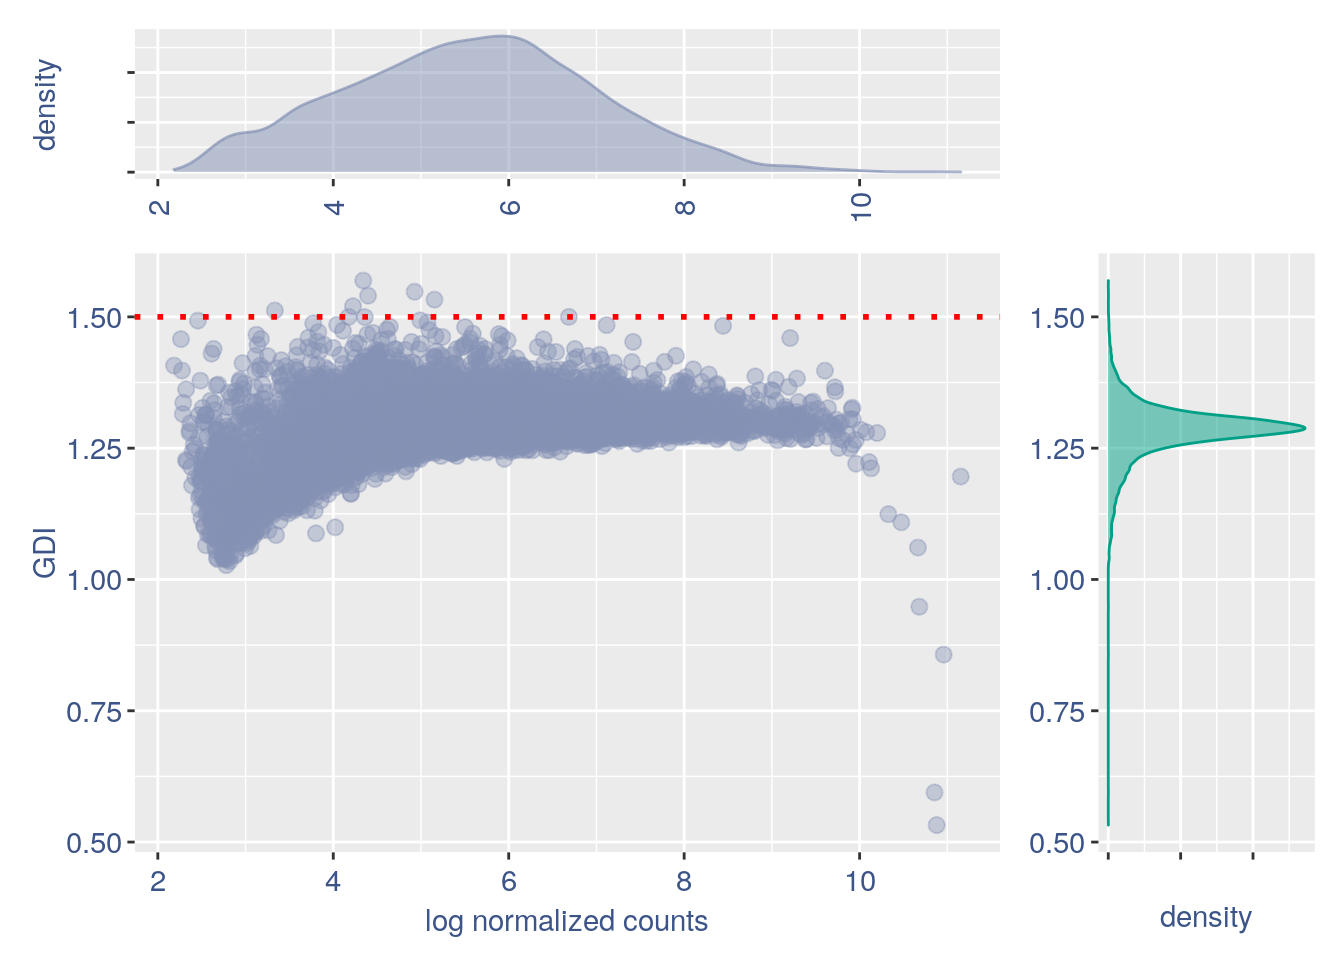
4 Syntetic negative dataset: 800 cells
p_values_CE800 = get.pval(CE800)
#> NULL
#> [1] "Get p-values genome wide on columns genome wide on rows"
#> [1] "Using function S"
#> [1] "function to generate S "

Plot_CE800 = p_value_plot(p_values_CE800,
    obj = CE800)
#> NULL
#> [1] "Get p-values genome wide on columns genome wide on rows"
#> [1] "Using function G"
#> [1] "function to generate G "
#> [1] "Generating contingency tables for observed data"
#> [1] "mu estimator creation"
#> [1] "expected contingency tables creation"
#> [1] "The distance between estimated n of zeros and observed number of zero is 0.0551150644366422 over 11498"
#> [1] "Done"
#> [1] "G estimation"
#> [1] 3304428       4
#> [1] 3305117       4

Plot_CE800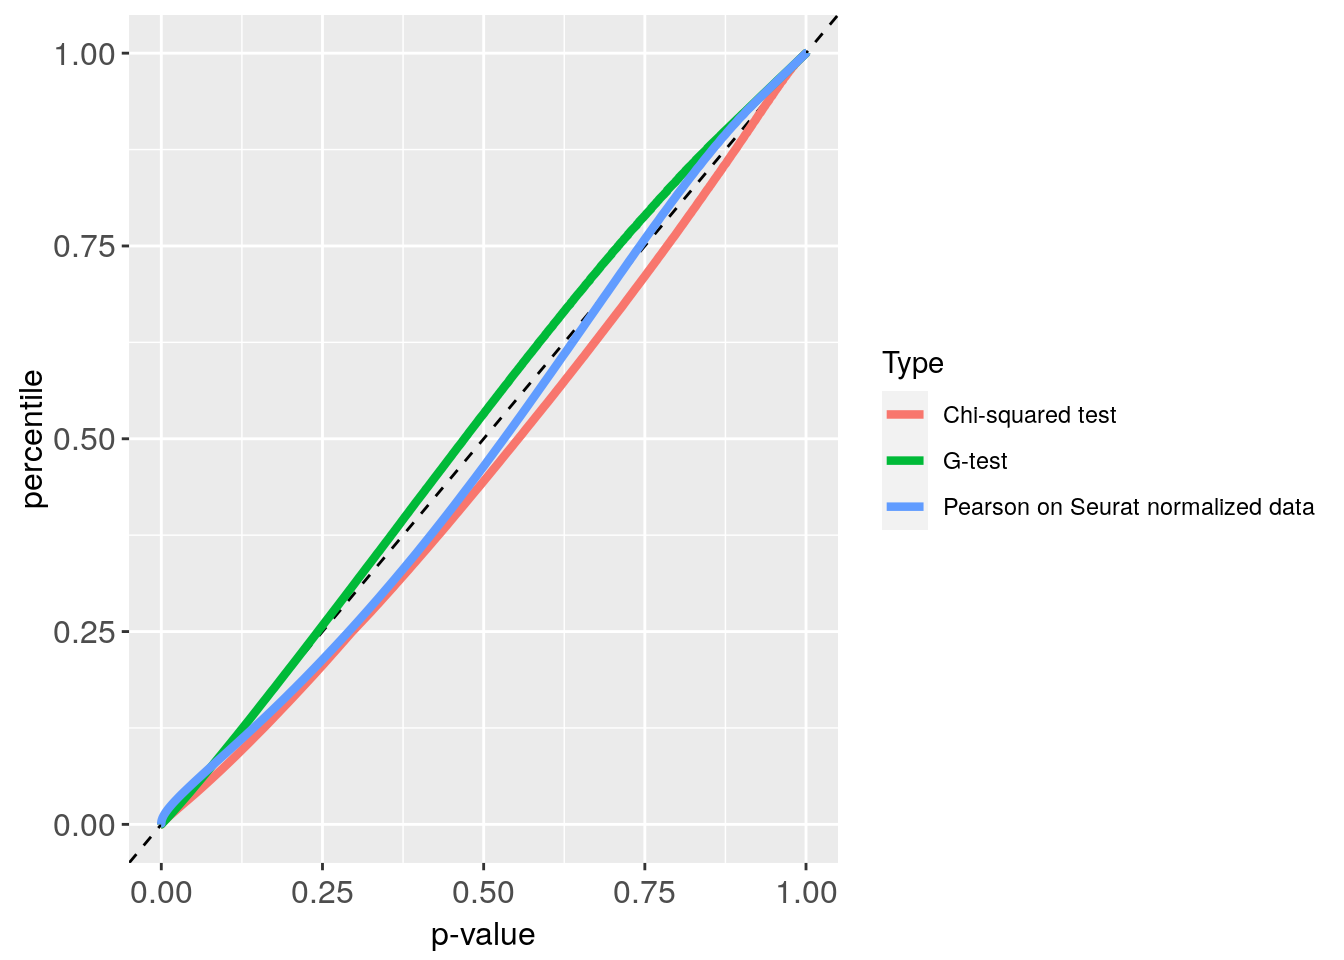
pdf("CE800_p_value_S_G_plot.pdf")
Plot_CE800
Plot_CE800 + xlim(0, 0.05) + ylim(0, 0.05)
dev.off()
#> png
#> 2sessionInfo()
#> R version 4.1.0 (2021-05-18)
#> Platform: x86_64-pc-linux-gnu (64-bit)
#> Running under: Ubuntu 18.04.5 LTS
#>
#> Matrix products: default
#> BLAS: /usr/lib/x86_64-linux-gnu/openblas/libblas.so.3
#> LAPACK: /usr/lib/x86_64-linux-gnu/libopenblasp-r0.2.20.so
#>
#> locale:
#> [1] LC_CTYPE=en_US.UTF-8 LC_NUMERIC=C
#> [3] LC_TIME=en_US.UTF-8 LC_COLLATE=en_US.UTF-8
#> [5] LC_MONETARY=en_US.UTF-8 LC_MESSAGES=en_US.UTF-8
#> [7] LC_PAPER=en_US.UTF-8 LC_NAME=C
#> [9] LC_ADDRESS=C LC_TELEPHONE=C
#> [11] LC_MEASUREMENT=en_US.UTF-8 LC_IDENTIFICATION=C
#>
#> attached base packages:
#> [1] stats graphics grDevices utils datasets methods base
#>
#> other attached packages:
#> [1] scales_1.1.1 patchwork_1.1.1 SeuratObject_4.0.0 Seurat_4.0.1
#> [5] Hmisc_4.5-0 Formula_1.2-4 survival_3.2-11 lattice_0.20-44
#> [9] COTAN_0.1.1 ggrepel_0.9.1 ggplot2_3.3.3
#>
#> loaded via a namespace (and not attached):
#> [1] backports_1.2.1 circlize_0.4.12 plyr_1.8.6
#> [4] igraph_1.2.6 lazyeval_0.2.2 splines_4.1.0
#> [7] listenv_0.8.0 scattermore_0.7 digest_0.6.27
#> [10] htmltools_0.5.1.1 fansi_0.4.2 magrittr_2.0.1
#> [13] checkmate_2.0.0 tensor_1.5 cluster_2.1.2
#> [16] ROCR_1.0-11 ComplexHeatmap_2.6.2 globals_0.14.0
#> [19] matrixStats_0.58.0 spatstat.sparse_2.0-0 jpeg_0.1-8.1
#> [22] colorspace_2.0-0 rappdirs_0.3.3 xfun_0.22
#> [25] dplyr_1.0.4 crayon_1.4.0 jsonlite_1.7.2
#> [28] spatstat.data_2.1-0 zoo_1.8-8 glue_1.4.2
#> [31] polyclip_1.10-0 gtable_0.3.0 leiden_0.3.7
#> [34] GetoptLong_1.0.5 future.apply_1.7.0 shape_1.4.5
#> [37] BiocGenerics_0.36.0 abind_1.4-5 DBI_1.1.1
#> [40] miniUI_0.1.1.1 Rcpp_1.0.6 viridisLite_0.4.0
#> [43] xtable_1.8-4 htmlTable_2.1.0 clue_0.3-58
#> [46] reticulate_1.19 spatstat.core_2.1-2 foreign_0.8-81
#> [49] stats4_4.1.0 htmlwidgets_1.5.3 httr_1.4.2
#> [52] RColorBrewer_1.1-2 ellipsis_0.3.1 ica_1.0-2
#> [55] farver_2.1.0 pkgconfig_2.0.3 uwot_0.1.10
#> [58] nnet_7.3-16 sass_0.3.1 deldir_0.2-10
#> [61] utf8_1.2.1 labeling_0.4.2 tidyselect_1.1.0
#> [64] rlang_0.4.10 reshape2_1.4.4 later_1.2.0
#> [67] munsell_0.5.0 tools_4.1.0 generics_0.1.0
#> [70] ggridges_0.5.3 evaluate_0.14 stringr_1.4.0
#> [73] fastmap_1.1.0 yaml_2.2.1 goftest_1.2-2
#> [76] knitr_1.33 fitdistrplus_1.1-3 purrr_0.3.4
#> [79] RANN_2.6.1 pbapply_1.4-3 future_1.21.0
#> [82] nlme_3.1-152 mime_0.10 formatR_1.9
#> [85] compiler_4.1.0 rstudioapi_0.13 plotly_4.9.3
#> [88] filelock_1.0.2 png_0.1-7 spatstat.utils_2.1-0
#> [91] tibble_3.1.0 bslib_0.2.4 stringi_1.5.3
#> [94] highr_0.9 basilisk.utils_1.2.2 Matrix_1.3-3
#> [97] vctrs_0.3.6 pillar_1.6.0 lifecycle_1.0.0
#> [100] spatstat.geom_2.1-0 lmtest_0.9-38 jquerylib_0.1.3
#> [103] GlobalOptions_0.1.2 RcppAnnoy_0.0.18 data.table_1.14.0
#> [106] cowplot_1.1.1 irlba_2.3.3 httpuv_1.6.0
#> [109] R6_2.5.0 latticeExtra_0.6-29 promises_1.2.0.1
#> [112] KernSmooth_2.23-20 gridExtra_2.3 IRanges_2.24.1
#> [115] parallelly_1.25.0 codetools_0.2-18 MASS_7.3-54
#> [118] assertthat_0.2.1 rjson_0.2.20 withr_2.4.1
#> [121] sctransform_0.3.2 S4Vectors_0.28.1 mgcv_1.8-35
#> [124] parallel_4.1.0 grid_4.1.0 rpart_4.1-15
#> [127] tidyr_1.1.2 basilisk_1.2.1 rmarkdown_2.7
#> [130] Cairo_1.5-12.2 Rtsne_0.15 shiny_1.6.0
#> [133] base64enc_0.1-3