library(COTAN)
library(pROC)
options(parallelly.fork.enable = TRUE)
library(Seurat)
library(monocle3)
library(reticulate)
library(cowplot)
library(stringr)
library(dplyr)
library(tidyr)
library(ggplot2)
library(ggpubr)

methods.color <- c("COTAN"="#F73604","Seurat"="#ABD9E9","Seurat_scTr"="#74ADD1","Seurat_Bimod"="#4575B4", "Monocle"="#DAABE9", "Scanpy"="#7F9B5C" )

dirOut <- "Results/FDR/"
if (!dir.exists(dirOut)) {
  dir.create(dirOut)
}

dataSetDir <- "Data/MouseCortexFromLoom/FDR/MergedClusters_For_FDR/"FDR analysis - Results - thresholds true 3% 10%
Preamble
Dataset composition
datasets_csv <- read.csv(file.path(dataSetDir,"Cells_Usage_DataFrame.csv"),
                         row.names = 1
                        )

datasets_csv[1:3,]
Group Collection E13.5.432 E13.5.187 E13.5.434
1 2_Clusters_even_near E13.5-434_+_E15.0-428 0 0 318
2 2_Clusters_even_near E15.0-432_+_E13.5-432 536 0 0
3 2_Clusters_even_near E15.0-508_+_E15.0-509 0 0 0
E13.5.184 E13.5.437 E13.5.510 E15.0.432 E15.0.509 E15.0.510 E15.0.508
1 0 0 0 0 0 0 0
2 0 0 0 536 0 0 0
3 0 0 0 0 397 0 397
E15.0.428 E15.0.434 E15.0.437 E17.5.516 E17.5.505
1 318 0 0 0 0
2 0 0 0 0 0
3 0 0 0 0 0Define which genes are expressed
For each data set we need to define, independently from the DEA methods, which genes are specific for each cluster. So we need to define first which genes are expressed and which are not expressed. To do so we can take advantage from the fact that we have the original clusters from which the cells were sampled to create the artificial datasets. So looking to the original cluster we define as expressed all genes present in at least the 10% of cells and we define as not expressed the genes completely absent or expressed in less than 3% of cells.
Since these two thresholds can have a big influence on the tools performances we will test also others in other pages.
file.presence <- readRDS("Data/MouseCortexFromLoom/FDR/Results/GenePresence_PerCluster.RDS")

for (file in list.files("Data/MouseCortexFromLoom/SingleClusterRawData/")) {
#  print(file)
  Code <- str_split(file,pattern = "_",simplify = T)[1]
  Time <- str_split(Code,pattern = "e",simplify = T)[2]
  Cluster <- str_split(Code,pattern = "e",simplify = T)[1]
  Cluster <- str_remove(Cluster,pattern = "Cl")
  Cluster <- paste0("E",Time,"-",Cluster)
  file.presence[,Cluster] <- "Absent"
  dataset.cl <- readRDS(file.path("Data/MouseCortexFromLoom/SingleClusterRawData/",
                                         file))
  number.cell.expressing <- rowSums(dataset.cl > 0)
  AbsentThreshold <- round(0.03*dim(dataset.cl)[2],digits = 0)
  PresenceThreshold <- round(0.1*dim(dataset.cl)[2],digits = 0)
  file.presence[names(number.cell.expressing[number.cell.expressing > AbsentThreshold]),Cluster] <- "Uncertain"

  file.presence[names(number.cell.expressing[number.cell.expressing >= PresenceThreshold]),Cluster] <- "Present"
  print(Cluster)
  print(table(file.presence[,Cluster]))

  }
[1] "E13.5-184"
Absent Present Uncertain
5519 6027 3149
[1] "E13.5-187"
Absent Present Uncertain
4926 7151 2618
[1] "E15.0-428"
Absent Present Uncertain
6386 5253 3056
[1] "E13.5-432"
Absent Present Uncertain
5765 5975 2955
[1] "E15.0-432"
Absent Present Uncertain
5912 5843 2940
[1] "E13.5-434"
Absent Present Uncertain
6124 5487 3084
[1] "E15.0-434"
Absent Present Uncertain
6301 5396 2998
[1] "E13.5-437"
Absent Present Uncertain
5943 5783 2969
[1] "E15.0-437"
Absent Present Uncertain
6017 5713 2965
[1] "E17.5-505"
Absent Present Uncertain
6048 5662 2985
[1] "E15.0-508"
Absent Present Uncertain
5625 6240 2830
[1] "E15.0-509"
Absent Present Uncertain
5452 6454 2789
[1] "E13.5-510"
Absent Present Uncertain
4924 6958 2813
[1] "E15.0-510"
Absent Present Uncertain
5070 6952 2673
[1] "E17.5-516"
Absent Present Uncertain
5821 5847 3027 2 Clusters even
2_Clusters_even_near
True vector
subset.datasets_csv <-datasets_csv[datasets_csv$Group == "2_Clusters_even_near",]

ground_truth_tot <- NA

for (ind in 1:dim(subset.datasets_csv)[1]) {
  clusters <- str_split(subset.datasets_csv$Collection[ind],pattern = "_[+]_",simplify = T)

  file.presence.subset <- file.presence[,clusters]


  #file.presence.subset <- as.matrix(file.presence.subset)


  ground_truth <- as.data.frame(matrix(nrow = nrow(file.presence.subset),
                                       ncol = ncol(file.presence.subset)))
  rownames(ground_truth) <- rownames(file.presence.subset)
  colnames(ground_truth) <- colnames(file.presence.subset)

  ground_truth[file.presence.subset == "Absent"] <- 0
  ground_truth[file.presence.subset == "Present"] <- 1
  ground_truth[file.presence.subset == "Uncertain"] <- 0.6

  file.presence.subset <- ground_truth

  for (col in 1:ncol(ground_truth)) {
    ground_truth[,col] <- FALSE
    ground_truth[file.presence.subset[,col] == 1 & rowMeans(file.presence.subset[,-col,drop = FALSE]) < 0.35  ,col] <- TRUE
    }

  ground_truth$genes <- rownames(ground_truth)
  ground_truth <- pivot_longer(ground_truth,
                               cols = 1:(ncol(ground_truth)-1),
                               names_to = "clusters")
  ground_truth$data_set <- subset.datasets_csv[ind,1]
  ground_truth$set_number <- ind
  ground_truth_tot <- rbind(ground_truth_tot, ground_truth)

}
ground_truth_tot <- ground_truth_tot[2:nrow(ground_truth_tot),]

head(ground_truth_tot,20)
# A tibble: 20 × 5
genes clusters value data_set set_number
<chr> <chr> <lgl> <chr> <int>
1 Neil2 E13.5-434 FALSE 2_Clusters_even_near 1
2 Neil2 E15.0-428 FALSE 2_Clusters_even_near 1
3 Lamc1 E13.5-434 FALSE 2_Clusters_even_near 1
4 Lamc1 E15.0-428 FALSE 2_Clusters_even_near 1
5 Lama1 E13.5-434 FALSE 2_Clusters_even_near 1
6 Lama1 E15.0-428 FALSE 2_Clusters_even_near 1
7 Hs3st1 E13.5-434 FALSE 2_Clusters_even_near 1
8 Hs3st1 E15.0-428 FALSE 2_Clusters_even_near 1
9 Fabp3 E13.5-434 FALSE 2_Clusters_even_near 1
10 Fabp3 E15.0-428 FALSE 2_Clusters_even_near 1
11 Nrg2 E13.5-434 FALSE 2_Clusters_even_near 1
12 Nrg2 E15.0-428 FALSE 2_Clusters_even_near 1
13 Kdelr3 E13.5-434 FALSE 2_Clusters_even_near 1
14 Kdelr3 E15.0-428 FALSE 2_Clusters_even_near 1
15 Bend4 E13.5-434 FALSE 2_Clusters_even_near 1
16 Bend4 E15.0-428 FALSE 2_Clusters_even_near 1
17 Gjb4 E13.5-434 FALSE 2_Clusters_even_near 1
18 Gjb4 E15.0-428 FALSE 2_Clusters_even_near 1
19 Mogs E13.5-434 FALSE 2_Clusters_even_near 1
20 Mogs E15.0-428 FALSE 2_Clusters_even_near 1length(unique(ground_truth_tot$genes))[1] 14695sum(ground_truth_tot$value)[1] 24ROC for COTAN
onlyPositive.pVal.Cotan_tot <- NA

for (ind in 1:dim(subset.datasets_csv)[1]) {
  #print(ind)
  file.code <- paste0(subset.datasets_csv$Group[ind],"_",
                      subset.datasets_csv$Collection[ind])
  dataset <- readRDS(file = file.path(dataSetDir,paste0(file.code,".RDS")))
  deaCOTAN <- getClusterizationData(dataset,clName = "mergedClusters")[[2]]
  pvalCOTAN <- pValueFromDEA(deaCOTAN,
              numCells = getNumCells(dataset),adjustmentMethod ="none")

  clusterization <- getClusterizationData(dataset, clName = "mergedClusters")[[1]]
  cl.names <- NA

  for (cl.val in  unique(clusterization)) {
    #print(cl.val)
    cl.names <- c(cl.names,
                  str_split(names(clusterization[clusterization == cl.val])[1],
                            pattern = "_",simplify = T)[1])
    cl.names <- cl.names[!is.na(cl.names)]
  }
  colnames(deaCOTAN) <- cl.names
  colnames(pvalCOTAN) <- cl.names

  clusters <- str_split(datasets_csv$Collection[ind],pattern = "_[+]_",simplify = T)

  onlyPositive.pVal.Cotan <- pvalCOTAN

    for (cl in cl.names) {
    print(cl)
    #temp.DEA.CotanSign <- deaCOTAN[rownames(pvalCOTAN[pvalCOTAN[,cl] < 0.05,]) ,]
    onlyPositive.pVal.Cotan[rownames(deaCOTAN[deaCOTAN[,cl] < 0,]),cl] <-  1 #onlyPositive.pVal.Cotan[rownames(deaCOTAN[deaCOTAN[,cl] < 0,]),cl]+1
    }

    onlyPositive.pVal.Cotan$genes <- rownames(onlyPositive.pVal.Cotan)
    onlyPositive.pVal.Cotan <- pivot_longer(onlyPositive.pVal.Cotan,
                                            values_to = "p_values",
                               cols = 1:(ncol(onlyPositive.pVal.Cotan)-1),
                               names_to = "clusters")
  onlyPositive.pVal.Cotan$data_set <- subset.datasets_csv[ind,1]
  onlyPositive.pVal.Cotan$set_number <- ind
  onlyPositive.pVal.Cotan_tot <- rbind(onlyPositive.pVal.Cotan_tot, onlyPositive.pVal.Cotan)

  }
[1] "E13.5-434"
[1] "E15.0-428"
[1] "E15.0-432"
[1] "E13.5-432"
[1] "E15.0-509"
[1] "E15.0-508"onlyPositive.pVal.Cotan_tot <- onlyPositive.pVal.Cotan_tot[2:nrow(onlyPositive.pVal.Cotan_tot),]
onlyPositive.pVal.Cotan_tot <- merge.data.frame(onlyPositive.pVal.Cotan_tot,
ground_truth_tot,by = c("genes","clusters","data_set","set_number"),all.x = T,all.y = F)
#onlyPositive.pVal.Cotan_tot <- onlyPositive.pVal.Cotan_tot[order(onlyPositive.pVal.Cotan_tot$p_values,
# decreasing = F),]
# df <- as.data.frame(matrix(nrow = nrow(onlyPositive.pVal.Cotan_tot),ncol = 3))
# colnames(df) <- c("TPR","FPR","Method")
# df$Method <- "COTAN"
#
# Positive <- sum(onlyPositive.pVal.Cotan_tot$value)
# Negative <- sum(!onlyPositive.pVal.Cotan_tot$value)
#
# for (i in 1:nrow(onlyPositive.pVal.Cotan_tot)) {
# df[i,"TPR"] <- sum(onlyPositive.pVal.Cotan_tot[1:i,"value"])/Positive
# df[i,"FPR"] <- (i-sum(onlyPositive.pVal.Cotan_tot[1:i,"value"]))/Negative
# Convert TRUE/FALSE to 1/0
onlyPositive.pVal.Cotan_tot$value <- as.numeric(onlyPositive.pVal.Cotan_tot$value)
# Compute the ROC curve - note that we invert the p-values with 1 - p_values
roc_resultCOTAN <- roc(onlyPositive.pVal.Cotan_tot$value, 1 - onlyPositive.pVal.Cotan_tot$p_values)
# Plot the ROC curve
#plot(roc_resultCOTAN)ROC for Seurat
deaSeurat_tot <- NA

for (ind in 1:dim(subset.datasets_csv)[1]) {
  #print(ind)
  file.code <- paste0(subset.datasets_csv$Group[ind],"_",subset.datasets_csv$Collection[ind])

  dataset <- readRDS(file = file.path(dataSetDir,paste0(file.code,".RDS")))

  clusterization <- getClusterizationData(dataset, clName = "mergedClusters")[[1]]

  deaSeurat <- read.csv(file.path(dirOut,paste0(file.code,"Seurat_DEA_genes.csv")), row.names = 1)

  cl.names <- NA

  for (cl.val in  unique(clusterization)) {
    #print(cl.val)
    cl.name <- str_split(names(clusterization[clusterization == cl.val])[1],
                            pattern = "_",simplify = T)[1]
    cl.names <- c(cl.names,cl.name)
    cl.names <- cl.names[!is.na(cl.names)]

    deaSeurat[deaSeurat$cluster == cl.val,]$cluster <- cl.name

  }

  clusters <- str_split(datasets_csv$Collection[ind],pattern = "_[+]_",simplify = T)

  colnames(deaSeurat) <- str_replace(colnames(deaSeurat),
                                     pattern = "cluster",
                                     replacement = "clusters")
  colnames(deaSeurat) <- str_replace(colnames(deaSeurat),
                                     pattern = "gene",
                                     replacement = "genes")

  deaSeurat$data_set <- subset.datasets_csv[ind,1]
  deaSeurat$set_number <- ind
  deaSeurat_tot <- rbind(deaSeurat_tot, deaSeurat)


  }
 deaSeurat_tot <-  deaSeurat_tot[2:nrow(deaSeurat_tot),]

 deaSeurat_tot <- merge.data.frame(deaSeurat_tot,
                                   ground_truth_tot,
                                   by = c("genes","clusters","data_set","set_number"),
                                   all.x = T,all.y = F)

# Convert TRUE/FALSE to 1/0
deaSeurat_tot$value <- as.numeric(deaSeurat_tot$value)

# Compute the ROC curve - note that we invert the p-values with 1 - p_values
roc_resultSeurat <- roc(deaSeurat_tot$value, 1 - deaSeurat_tot$p_val)

# Plot the ROC curve
#plot(roc_resultSeurat)
ROC for Seurat scTransform
deaSeurat_tot <- NA

for (ind in 1:dim(subset.datasets_csv)[1]) {
  #print(ind)
  file.code <- paste0(subset.datasets_csv$Group[ind],"_",subset.datasets_csv$Collection[ind])

  dataset <- readRDS(file = file.path(dataSetDir,paste0(file.code,".RDS")))

  clusterization <- getClusterizationData(dataset, clName = "mergedClusters")[[1]]

  deaSeurat <- read.csv(file.path(dirOut,paste0(file.code,"Seurat_DEA_ScTransform_genes.csv")), row.names = 1)

  cl.names <- NA

  for (cl.val in  unique(clusterization)) {
    #print(cl.val)
    cl.name <- str_split(names(clusterization[clusterization == cl.val])[1],
                            pattern = "_",simplify = T)[1]
    cl.names <- c(cl.names,cl.name)
    cl.names <- cl.names[!is.na(cl.names)]

    deaSeurat[deaSeurat$cluster == cl.val,]$cluster <- cl.name

  }

  clusters <- str_split(datasets_csv$Collection[ind],pattern = "_[+]_",simplify = T)

  colnames(deaSeurat) <- str_replace(colnames(deaSeurat),
                                     pattern = "cluster",
                                     replacement = "clusters")
  colnames(deaSeurat) <- str_replace(colnames(deaSeurat),
                                     pattern = "gene",
                                     replacement = "genes")

  deaSeurat$data_set <- subset.datasets_csv[ind,1]
  deaSeurat$set_number <- ind
  deaSeurat_tot <- rbind(deaSeurat_tot, deaSeurat)


  }
 deaSeurat_tot <-  deaSeurat_tot[2:nrow(deaSeurat_tot),]

 deaSeurat_tot <- merge.data.frame(deaSeurat_tot,
                                   ground_truth_tot,
                                   by = c("genes","clusters","data_set","set_number"),
                                   all.x = T,all.y = F)

# Convert TRUE/FALSE to 1/0
deaSeurat_tot$value <- as.numeric(deaSeurat_tot$value)

# Compute the ROC curve - note that we invert the p-values with 1 - p_values
roc_resultSeurat_scTr <- roc(deaSeurat_tot$value, 1 - deaSeurat_tot$p_val)
ROC for Seurat Bimod
deaSeurat_tot <- NA

for (ind in 1:dim(subset.datasets_csv)[1]) {
  #print(ind)
  file.code <- paste0(subset.datasets_csv$Group[ind],"_",subset.datasets_csv$Collection[ind])

  dataset <- readRDS(file = file.path(dataSetDir,paste0(file.code,".RDS")))

  clusterization <- getClusterizationData(dataset, clName = "mergedClusters")[[1]]

  deaSeurat <- read.csv(file.path(dirOut,paste0(file.code,"Seurat_DEA_Bimod_genes.csv")), row.names = 1)

  cl.names <- NA

  for (cl.val in  unique(clusterization)) {
    #print(cl.val)
    cl.name <- str_split(names(clusterization[clusterization == cl.val])[1],
                            pattern = "_",simplify = T)[1]
    cl.names <- c(cl.names,cl.name)
    cl.names <- cl.names[!is.na(cl.names)]

    deaSeurat[deaSeurat$cluster == cl.val,]$cluster <- cl.name

  }

  clusters <- str_split(datasets_csv$Collection[ind],pattern = "_[+]_",simplify = T)

  colnames(deaSeurat) <- str_replace(colnames(deaSeurat),
                                     pattern = "cluster",
                                     replacement = "clusters")
  colnames(deaSeurat) <- str_replace(colnames(deaSeurat),
                                     pattern = "gene",
                                     replacement = "genes")

  deaSeurat$data_set <- subset.datasets_csv[ind,1]
  deaSeurat$set_number <- ind
  deaSeurat_tot <- rbind(deaSeurat_tot, deaSeurat)


  }
 deaSeurat_tot <-  deaSeurat_tot[2:nrow(deaSeurat_tot),]

 deaSeurat_tot <- merge.data.frame(deaSeurat_tot,
                                   ground_truth_tot,
                                   by = c("genes","clusters","data_set","set_number"),
                                   all.x = T,all.y = F)

# Convert TRUE/FALSE to 1/0
deaSeurat_tot$value <- as.numeric(deaSeurat_tot$value)

# Compute the ROC curve - note that we invert the p-values with 1 - p_values
roc_resultSeurat_Bimod <- roc(deaSeurat_tot$value, 1 - deaSeurat_tot$p_val)
ROC for Monocle
deaMonocle_tot <- NA
for (ind in 1:dim(subset.datasets_csv)[1]) {
  file.code <- paste0(subset.datasets_csv$Group[ind],"_",subset.datasets_csv$Collection[ind])
  dataset <- readRDS(file = file.path(dataSetDir,paste0(file.code,".RDS")))

  clusterization <- getClusterizationData(dataset, clName = "mergedClusters")[[1]]
  #print(file.code)

  deaMonocle <- read.csv(file.path(dirOut,paste0(file.code,"Monocle_DEA_genes.csv")),row.names = 1)

  cl.names <- NA

  for (cl.val in  unique(clusterization)) {
    #print(cl.val)
    cl.name <- str_split(names(clusterization[clusterization == cl.val])[1],
                            pattern = "_",simplify = T)[1]
    cl.names <- c(cl.names,cl.name)
    cl.names <- cl.names[!is.na(cl.names)]

    deaMonocle[deaMonocle$cell_group == cl.val,"cell_group"] <- cl.name

  }

  clusters <- str_split(datasets_csv$Collection[ind],pattern = "_[+]_",simplify = T)

  colnames(deaMonocle) <- str_replace(colnames(deaMonocle),
                                     pattern = "cell_group",
                                     replacement = "clusters")
  colnames(deaMonocle) <- str_replace(colnames(deaMonocle),
                                     pattern = "gene_id",
                                     replacement = "genes")

  deaMonocle$data_set <- subset.datasets_csv[ind,1]
  deaMonocle$set_number <- ind
  deaMonocle <- as.data.frame(deaMonocle)
  deaMonocle_tot <- rbind(deaMonocle_tot, deaMonocle)


  }
 deaMonocle_tot <-  deaMonocle_tot[2:nrow(deaMonocle_tot),]

 deaMonocle_tot <- merge.data.frame(deaMonocle_tot,
                                   ground_truth_tot,
                                   by = c("genes","clusters","data_set","set_number"),
                                   all.x = T,all.y = F)

# Convert TRUE/FALSE to 1/0
deaMonocle_tot$value <- as.numeric(deaMonocle_tot$value)

# Compute the ROC curve - note that we invert the p-values with 1 - p_values
roc_resultMonocle <- roc(deaMonocle_tot$value, 1 - deaMonocle_tot$marker_test_p_value)

# Plot the ROC curve
#plot(roc_resultMonocle)
ROC from Scanpy
deaScanpy_tot <- NA
for (ind in 1:dim(subset.datasets_csv)[1]) {
  file.code <- paste0(subset.datasets_csv$Group[ind],"_",subset.datasets_csv$Collection[ind])
  dataset <- readRDS(file = file.path(dataSetDir,paste0(file.code,".RDS")))

  clusterization <- getClusterizationData(dataset, clName = "mergedClusters")[[1]]
  #print(file.code)

  deaScanpy <- read.csv(file.path(dirOut,paste0(file.code,"Scanpy_DEA_genes.csv")),
                        row.names = 1)

  cl.names <- NA

  for (cl.val in  unique(clusterization)) {
    #print(cl.val)
    cl.name <- str_split(names(clusterization[clusterization == cl.val])[1],
                            pattern = "_",simplify = T)[1]
    cl.names <- c(cl.names,cl.name)
    cl.names <- cl.names[!is.na(cl.names)]

    deaScanpy[deaScanpy$clusters == paste0("cl",cl.val),"clusters"] <- cl.name

  }

  clusters <- str_split(datasets_csv$Collection[ind],pattern = "_[+]_",simplify = T)


  deaScanpy$data_set <- subset.datasets_csv[ind,1]
  deaScanpy$set_number <- ind
  deaScanpy_tot <- rbind(deaScanpy_tot, deaScanpy)


  }
 deaScanpy_tot <-  deaScanpy_tot[2:nrow(deaScanpy_tot),]

 deaScanpy_tot <- merge.data.frame(deaScanpy_tot,
                                   ground_truth_tot,
                                   by = c("genes","clusters","data_set","set_number"),
                                   all.x = T,all.y = F)

# Convert TRUE/FALSE to 1/0
deaScanpy_tot$value <- as.numeric(deaScanpy_tot$value)

# Compute the ROC curve - note that we invert the p-values with 1 - p_values
roc_resultScanpy <- roc(deaScanpy_tot$value, 1 - deaScanpy_tot$pval)

# Plot the ROC curve
#plot(roc_resultScanpy)
Summary ROC for all methods
TwoClusters_even_near <- ggroc(list(COTAN=roc_resultCOTAN,
                                    Seurat=roc_resultSeurat,
                 Seurat_scTr = roc_resultSeurat_scTr,
                 Seurat_Bimod = roc_resultSeurat_Bimod,
                 Monocle=roc_resultMonocle,
                 Scanpy=roc_resultScanpy),
                 aes = c("colour"),
            legacy.axes = T,
            linewidth = 1)+theme_light()+
  scale_colour_manual("",
                      values = methods.color)

TwoClusters_even_nearPL <- TwoClusters_even_near +
  xlab("FPR") +
  ylab("TPR")
TwoClusters_even_nearPL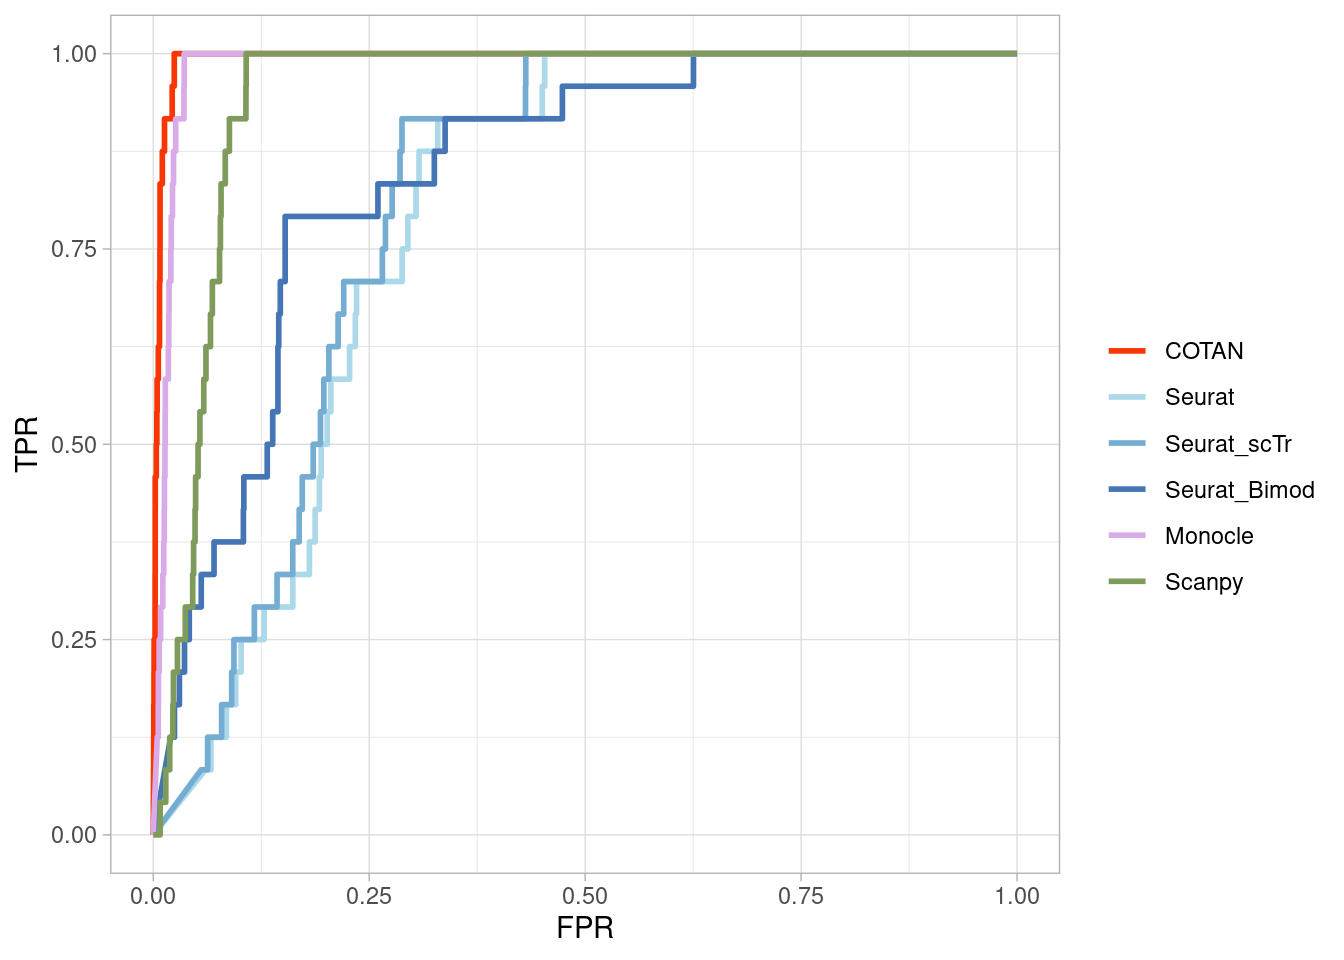
2_Clusters_even_medium
True vector
subset.datasets_csv <-datasets_csv[datasets_csv$Group == "2_Clusters_even_medium",]

ground_truth_tot <- NA

for (ind in 1:dim(subset.datasets_csv)[1]) {
  clusters <- str_split(subset.datasets_csv$Collection[ind],pattern = "_[+]_",simplify = T)

  file.presence.subset <- file.presence[,clusters]


  #file.presence.subset <- as.matrix(file.presence.subset)


  ground_truth <- as.data.frame(matrix(nrow = nrow(file.presence.subset),
                                       ncol = ncol(file.presence.subset)))
  rownames(ground_truth) <- rownames(file.presence.subset)
  colnames(ground_truth) <- colnames(file.presence.subset)

  ground_truth[file.presence.subset == "Absent"] <- 0
  ground_truth[file.presence.subset == "Present"] <- 1
  ground_truth[file.presence.subset == "Uncertain"] <- 0.6

  file.presence.subset <- ground_truth

  for (col in 1:ncol(ground_truth)) {
    ground_truth[,col] <- FALSE
    ground_truth[file.presence.subset[,col] == 1 & rowMeans(file.presence.subset[,-col,drop = FALSE]) < 0.35  ,col] <- TRUE
    }

  ground_truth$genes <- rownames(ground_truth)
  ground_truth <- pivot_longer(ground_truth,
                               cols = 1:(ncol(ground_truth)-1),
                               names_to = "clusters")
  ground_truth$data_set <- subset.datasets_csv[ind,1]
  ground_truth$set_number <- ind
  ground_truth_tot <- rbind(ground_truth_tot, ground_truth)

}
ground_truth_tot <- ground_truth_tot[2:nrow(ground_truth_tot),]

head(ground_truth_tot)
# A tibble: 6 × 5
genes clusters value data_set set_number
<chr> <chr> <lgl> <chr> <int>
1 Neil2 E13.5-187 FALSE 2_Clusters_even_medium 1
2 Neil2 E13.5-184 FALSE 2_Clusters_even_medium 1
3 Lamc1 E13.5-187 FALSE 2_Clusters_even_medium 1
4 Lamc1 E13.5-184 FALSE 2_Clusters_even_medium 1
5 Lama1 E13.5-187 FALSE 2_Clusters_even_medium 1
6 Lama1 E13.5-184 FALSE 2_Clusters_even_medium 1length(unique(ground_truth_tot$genes)) [1] 14695sum(ground_truth_tot$value)[1] 771ROC for COTAN
onlyPositive.pVal.Cotan_tot <- NA

for (ind in 1:dim(subset.datasets_csv)[1]) {
  #print(ind)
  file.code <- paste0(subset.datasets_csv$Group[ind],"_",
                      subset.datasets_csv$Collection[ind])
  dataset <- readRDS(file = file.path(dataSetDir,paste0(file.code,".RDS")))
  deaCOTAN <- getClusterizationData(dataset,clName = "mergedClusters")[[2]]
  pvalCOTAN <- pValueFromDEA(deaCOTAN,
              numCells = getNumCells(dataset),adjustmentMethod ="none")

  clusterization <- getClusterizationData(dataset, clName = "mergedClusters")[[1]]
  cl.names <- NA

  for (cl.val in  unique(clusterization)) {
    #print(cl.val)
    cl.names <- c(cl.names,
                  str_split(names(clusterization[clusterization == cl.val])[1],
                            pattern = "_",simplify = T)[1])
    cl.names <- cl.names[!is.na(cl.names)]
  }
  colnames(deaCOTAN) <- cl.names
  colnames(pvalCOTAN) <- cl.names

  clusters <- str_split(datasets_csv$Collection[ind],pattern = "_[+]_",simplify = T)

  onlyPositive.pVal.Cotan <- pvalCOTAN

    for (cl in cl.names) {
    print(cl)
    #temp.DEA.CotanSign <- deaCOTAN[rownames(pvalCOTAN[pvalCOTAN[,cl] < 0.05,]) ,]
    onlyPositive.pVal.Cotan[rownames(deaCOTAN[deaCOTAN[,cl] < 0,]),cl] <-  1 #onlyPositive.pVal.Cotan[rownames(deaCOTAN[deaCOTAN[,cl] < 0,]),cl]+1
    }

    onlyPositive.pVal.Cotan$genes <- rownames(onlyPositive.pVal.Cotan)
    onlyPositive.pVal.Cotan <- pivot_longer(onlyPositive.pVal.Cotan,
                                            values_to = "p_values",
                               cols = 1:(ncol(onlyPositive.pVal.Cotan)-1),
                               names_to = "clusters")
  onlyPositive.pVal.Cotan$data_set <- subset.datasets_csv[ind,1]
  onlyPositive.pVal.Cotan$set_number <- ind
  onlyPositive.pVal.Cotan_tot <- rbind(onlyPositive.pVal.Cotan_tot, onlyPositive.pVal.Cotan)

  }
[1] "E13.5-187"
[1] "E13.5-184"
[1] "E17.5-516"
[1] "E15.0-434"
[1] "E15.0-508"
[1] "E15.0-437"onlyPositive.pVal.Cotan_tot <- onlyPositive.pVal.Cotan_tot[2:nrow(onlyPositive.pVal.Cotan_tot),]
onlyPositive.pVal.Cotan_tot <- merge.data.frame(onlyPositive.pVal.Cotan_tot,
ground_truth_tot,by = c("genes","clusters","data_set","set_number"),all.x = T,all.y = F)
#onlyPositive.pVal.Cotan_tot <- onlyPositive.pVal.Cotan_tot[order(onlyPositive.pVal.Cotan_tot$p_values,
# decreasing = F),]
# df <- as.data.frame(matrix(nrow = nrow(onlyPositive.pVal.Cotan_tot),ncol = 3))
# colnames(df) <- c("TPR","FPR","Method")
# df$Method <- "COTAN"
#
# Positive <- sum(onlyPositive.pVal.Cotan_tot$value)
# Negative <- sum(!onlyPositive.pVal.Cotan_tot$value)
#
# for (i in 1:nrow(onlyPositive.pVal.Cotan_tot)) {
# df[i,"TPR"] <- sum(onlyPositive.pVal.Cotan_tot[1:i,"value"])/Positive
# df[i,"FPR"] <- (i-sum(onlyPositive.pVal.Cotan_tot[1:i,"value"]))/Negative
# Convert TRUE/FALSE to 1/0
onlyPositive.pVal.Cotan_tot$value <- as.numeric(onlyPositive.pVal.Cotan_tot$value)
# Compute the ROC curve - note that we invert the p-values with 1 - p_values
roc_resultCOTAN <- roc(onlyPositive.pVal.Cotan_tot$value, 1 - onlyPositive.pVal.Cotan_tot$p_values)
# Plot the ROC curve
#plot(roc_resultCOTAN)ROC for Seurat
deaSeurat_tot <- NA

for (ind in 1:dim(subset.datasets_csv)[1]) {
  #print(ind)
  file.code <- paste0(subset.datasets_csv$Group[ind],"_",subset.datasets_csv$Collection[ind])

  dataset <- readRDS(file = file.path(dataSetDir,paste0(file.code,".RDS")))

  clusterization <- getClusterizationData(dataset, clName = "mergedClusters")[[1]]

  deaSeurat <- read.csv(file.path(dirOut,paste0(file.code,"Seurat_DEA_genes.csv")), row.names = 1)

  cl.names <- NA

  for (cl.val in  unique(clusterization)) {
    #print(cl.val)
    cl.name <- str_split(names(clusterization[clusterization == cl.val])[1],
                            pattern = "_",simplify = T)[1]
    cl.names <- c(cl.names,cl.name)
    cl.names <- cl.names[!is.na(cl.names)]

    deaSeurat[deaSeurat$cluster == cl.val,]$cluster <- cl.name

  }

  clusters <- str_split(datasets_csv$Collection[ind],pattern = "_[+]_",simplify = T)

  colnames(deaSeurat) <- str_replace(colnames(deaSeurat),
                                     pattern = "cluster",
                                     replacement = "clusters")
  colnames(deaSeurat) <- str_replace(colnames(deaSeurat),
                                     pattern = "gene",
                                     replacement = "genes")

  deaSeurat$data_set <- subset.datasets_csv[ind,1]
  deaSeurat$set_number <- ind
  deaSeurat_tot <- rbind(deaSeurat_tot, deaSeurat)


  }
 deaSeurat_tot <-  deaSeurat_tot[2:nrow(deaSeurat_tot),]

 deaSeurat_tot <- merge.data.frame(deaSeurat_tot,
                                   ground_truth_tot,
                                   by = c("genes","clusters","data_set","set_number"),
                                   all.x = T,all.y = F)

# Convert TRUE/FALSE to 1/0
deaSeurat_tot$value <- as.numeric(deaSeurat_tot$value)

# Compute the ROC curve - note that we invert the p-values with 1 - p_values
roc_resultSeurat <- roc(deaSeurat_tot$value, 1 - deaSeurat_tot$p_val)

# Plot the ROC curve
#plot(roc_resultSeurat)
ROC for Seurat scTransform
deaSeurat_tot <- NA

for (ind in 1:dim(subset.datasets_csv)[1]) {
  #print(ind)
  file.code <- paste0(subset.datasets_csv$Group[ind],"_",subset.datasets_csv$Collection[ind])

  dataset <- readRDS(file = file.path(dataSetDir,paste0(file.code,".RDS")))

  clusterization <- getClusterizationData(dataset, clName = "mergedClusters")[[1]]

  deaSeurat <- read.csv(file.path(dirOut,paste0(file.code,"Seurat_DEA_ScTransform_genes.csv")), row.names = 1)

  cl.names <- NA

  for (cl.val in  unique(clusterization)) {
    #print(cl.val)
    cl.name <- str_split(names(clusterization[clusterization == cl.val])[1],
                            pattern = "_",simplify = T)[1]
    cl.names <- c(cl.names,cl.name)
    cl.names <- cl.names[!is.na(cl.names)]

    deaSeurat[deaSeurat$cluster == cl.val,]$cluster <- cl.name

  }

  clusters <- str_split(datasets_csv$Collection[ind],pattern = "_[+]_",simplify = T)

  colnames(deaSeurat) <- str_replace(colnames(deaSeurat),
                                     pattern = "cluster",
                                     replacement = "clusters")
  colnames(deaSeurat) <- str_replace(colnames(deaSeurat),
                                     pattern = "gene",
                                     replacement = "genes")

  deaSeurat$data_set <- subset.datasets_csv[ind,1]
  deaSeurat$set_number <- ind
  deaSeurat_tot <- rbind(deaSeurat_tot, deaSeurat)


  }
 deaSeurat_tot <-  deaSeurat_tot[2:nrow(deaSeurat_tot),]

 deaSeurat_tot <- merge.data.frame(deaSeurat_tot,
                                   ground_truth_tot,
                                   by = c("genes","clusters","data_set","set_number"),
                                   all.x = T,all.y = F)

# Convert TRUE/FALSE to 1/0
deaSeurat_tot$value <- as.numeric(deaSeurat_tot$value)

# Compute the ROC curve - note that we invert the p-values with 1 - p_values
roc_resultSeurat_scTr <- roc(deaSeurat_tot$value, 1 - deaSeurat_tot$p_val)
ROC for Seurat Bimod
deaSeurat_tot <- NA

for (ind in 1:dim(subset.datasets_csv)[1]) {
  #print(ind)
  file.code <- paste0(subset.datasets_csv$Group[ind],"_",subset.datasets_csv$Collection[ind])

  dataset <- readRDS(file = file.path(dataSetDir,paste0(file.code,".RDS")))

  clusterization <- getClusterizationData(dataset, clName = "mergedClusters")[[1]]

  deaSeurat <- read.csv(file.path(dirOut,paste0(file.code,"Seurat_DEA_Bimod_genes.csv")), row.names = 1)

  cl.names <- NA

  for (cl.val in  unique(clusterization)) {
    #print(cl.val)
    cl.name <- str_split(names(clusterization[clusterization == cl.val])[1],
                            pattern = "_",simplify = T)[1]
    cl.names <- c(cl.names,cl.name)
    cl.names <- cl.names[!is.na(cl.names)]

    deaSeurat[deaSeurat$cluster == cl.val,]$cluster <- cl.name

  }

  clusters <- str_split(datasets_csv$Collection[ind],pattern = "_[+]_",simplify = T)

  colnames(deaSeurat) <- str_replace(colnames(deaSeurat),
                                     pattern = "cluster",
                                     replacement = "clusters")
  colnames(deaSeurat) <- str_replace(colnames(deaSeurat),
                                     pattern = "gene",
                                     replacement = "genes")

  deaSeurat$data_set <- subset.datasets_csv[ind,1]
  deaSeurat$set_number <- ind
  deaSeurat_tot <- rbind(deaSeurat_tot, deaSeurat)


  }
 deaSeurat_tot <-  deaSeurat_tot[2:nrow(deaSeurat_tot),]

 deaSeurat_tot <- merge.data.frame(deaSeurat_tot,
                                   ground_truth_tot,
                                   by = c("genes","clusters","data_set","set_number"),
                                   all.x = T,all.y = F)

# Convert TRUE/FALSE to 1/0
deaSeurat_tot$value <- as.numeric(deaSeurat_tot$value)

# Compute the ROC curve - note that we invert the p-values with 1 - p_values
roc_resultSeurat_Bimod <- roc(deaSeurat_tot$value, 1 - deaSeurat_tot$p_val)
ROC for Monocle
deaMonocle_tot <- NA
for (ind in 1:dim(subset.datasets_csv)[1]) {
  file.code <- paste0(subset.datasets_csv$Group[ind],"_",subset.datasets_csv$Collection[ind])
  dataset <- readRDS(file = file.path(dataSetDir,paste0(file.code,".RDS")))

  clusterization <- getClusterizationData(dataset, clName = "mergedClusters")[[1]]
  #print(file.code)

  deaMonocle <- read.csv(file.path(dirOut,paste0(file.code,"Monocle_DEA_genes.csv")),row.names = 1)

  cl.names <- NA

  for (cl.val in  unique(clusterization)) {
    #print(cl.val)
    cl.name <- str_split(names(clusterization[clusterization == cl.val])[1],
                            pattern = "_",simplify = T)[1]
    cl.names <- c(cl.names,cl.name)
    cl.names <- cl.names[!is.na(cl.names)]

    deaMonocle[deaMonocle$cell_group == cl.val,"cell_group"] <- cl.name

  }

  clusters <- str_split(datasets_csv$Collection[ind],pattern = "_[+]_",simplify = T)

  colnames(deaMonocle) <- str_replace(colnames(deaMonocle),
                                     pattern = "cell_group",
                                     replacement = "clusters")
  colnames(deaMonocle) <- str_replace(colnames(deaMonocle),
                                     pattern = "gene_id",
                                     replacement = "genes")

  deaMonocle$data_set <- subset.datasets_csv[ind,1]
  deaMonocle$set_number <- ind
  deaMonocle <- as.data.frame(deaMonocle)
  deaMonocle_tot <- rbind(deaMonocle_tot, deaMonocle)


  }
 deaMonocle_tot <-  deaMonocle_tot[2:nrow(deaMonocle_tot),]

 deaMonocle_tot <- merge.data.frame(deaMonocle_tot,
                                   ground_truth_tot,
                                   by = c("genes","clusters","data_set","set_number"),
                                   all.x = T,all.y = F)

# Convert TRUE/FALSE to 1/0
deaMonocle_tot$value <- as.numeric(deaMonocle_tot$value)

# Compute the ROC curve - note that we invert the p-values with 1 - p_values
roc_resultMonocle <- roc(deaMonocle_tot$value, 1 - deaMonocle_tot$marker_test_p_value)

# Plot the ROC curve
#plot(roc_resultMonocle)
ROC from Scanpy
deaScanpy_tot <- NA
for (ind in 1:dim(subset.datasets_csv)[1]) {
  file.code <- paste0(subset.datasets_csv$Group[ind],"_",subset.datasets_csv$Collection[ind])
  dataset <- readRDS(file = file.path(dataSetDir,paste0(file.code,".RDS")))

  clusterization <- getClusterizationData(dataset, clName = "mergedClusters")[[1]]
  #print(file.code)

  deaScanpy <- read.csv(file.path(dirOut,paste0(file.code,"Scanpy_DEA_genes.csv")),
                        row.names = 1)

  cl.names <- NA

  for (cl.val in  unique(clusterization)) {
    #print(cl.val)
    cl.name <- str_split(names(clusterization[clusterization == cl.val])[1],
                            pattern = "_",simplify = T)[1]
    cl.names <- c(cl.names,cl.name)
    cl.names <- cl.names[!is.na(cl.names)]

    deaScanpy[deaScanpy$clusters == paste0("cl",cl.val),"clusters"] <- cl.name

  }

  clusters <- str_split(datasets_csv$Collection[ind],pattern = "_[+]_",simplify = T)


  deaScanpy$data_set <- subset.datasets_csv[ind,1]
  deaScanpy$set_number <- ind
  deaScanpy_tot <- rbind(deaScanpy_tot, deaScanpy)


  }
 deaScanpy_tot <-  deaScanpy_tot[2:nrow(deaScanpy_tot),]

 deaScanpy_tot <- merge.data.frame(deaScanpy_tot,
                                   ground_truth_tot,
                                   by = c("genes","clusters","data_set","set_number"),
                                   all.x = T,all.y = F)

# Convert TRUE/FALSE to 1/0
deaScanpy_tot$value <- as.numeric(deaScanpy_tot$value)

# Compute the ROC curve - note that we invert the p-values with 1 - p_values
roc_resultScanpy <- roc(deaScanpy_tot$value, 1 - deaScanpy_tot$pval)

# Plot the ROC curve
#plot(roc_resultScanpy)
Summary ROC for all methods
Two_Clusters_even_medium <- ggroc(list(COTAN=roc_resultCOTAN,
                                    Seurat=roc_resultSeurat,
                 Seurat_scTr = roc_resultSeurat_scTr,
                 Seurat_Bimod = roc_resultSeurat_Bimod,
                 Monocle=roc_resultMonocle,
                 Scanpy=roc_resultScanpy),
                 aes = c("colour"),
            legacy.axes = T,
            linewidth = 1)+theme_light()+
  scale_colour_manual("",
                      values = methods.color)

Two_Clusters_even_mediumPL <- Two_Clusters_even_medium + xlab("FPR") + ylab("TPR")
Two_Clusters_even_mediumPL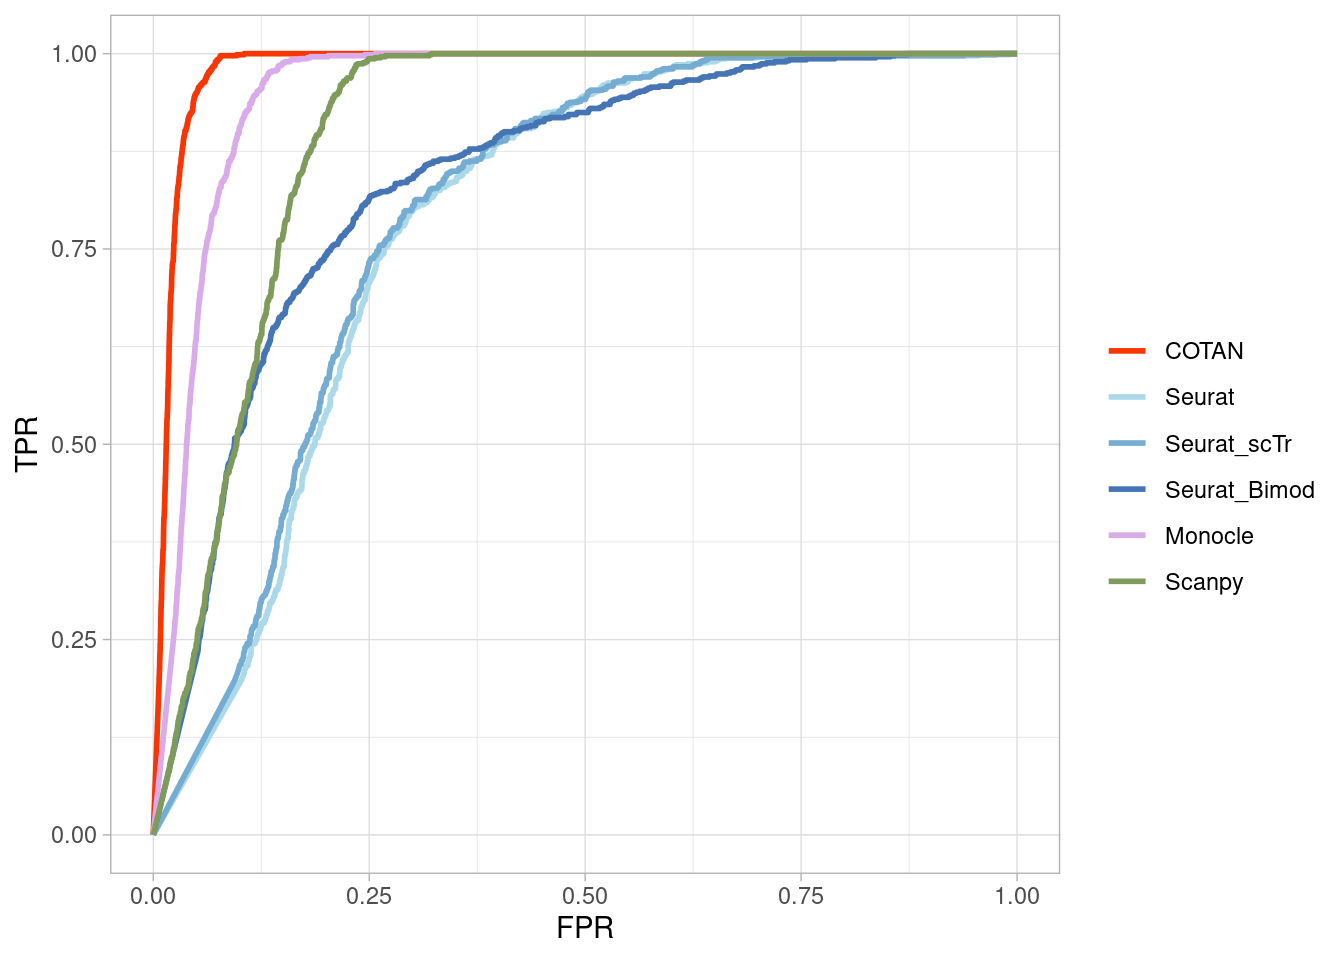
2_Clusters_even_far
True vector
subset.datasets_csv <-datasets_csv[datasets_csv$Group == "2_Clusters_even_far",]

ground_truth_tot <- NA

for (ind in 1:dim(subset.datasets_csv)[1]) {
  clusters <- str_split(subset.datasets_csv$Collection[ind],pattern = "_[+]_",simplify = T)

  file.presence.subset <- file.presence[,clusters]


  #file.presence.subset <- as.matrix(file.presence.subset)


  ground_truth <- as.data.frame(matrix(nrow = nrow(file.presence.subset),
                                       ncol = ncol(file.presence.subset)))
  rownames(ground_truth) <- rownames(file.presence.subset)
  colnames(ground_truth) <- colnames(file.presence.subset)

  ground_truth[file.presence.subset == "Absent"] <- 0
  ground_truth[file.presence.subset == "Present"] <- 1
  ground_truth[file.presence.subset == "Uncertain"] <- 0.6

  file.presence.subset <- ground_truth

  for (col in 1:ncol(ground_truth)) {
    ground_truth[,col] <- FALSE
    ground_truth[file.presence.subset[,col] == 1 & rowMeans(file.presence.subset[,-col,drop = FALSE]) < 0.35  ,col] <- TRUE
    }

  ground_truth$genes <- rownames(ground_truth)
  ground_truth <- pivot_longer(ground_truth,
                               cols = 1:(ncol(ground_truth)-1),
                               names_to = "clusters")
  ground_truth$data_set <- subset.datasets_csv[ind,1]
  ground_truth$set_number <- ind
  ground_truth_tot <- rbind(ground_truth_tot, ground_truth)

}
ground_truth_tot <- ground_truth_tot[2:nrow(ground_truth_tot),]

head(ground_truth_tot)
# A tibble: 6 × 5
genes clusters value data_set set_number
<chr> <chr> <lgl> <chr> <int>
1 Neil2 E17.5-516 FALSE 2_Clusters_even_far 1
2 Neil2 E13.5-187 FALSE 2_Clusters_even_far 1
3 Lamc1 E17.5-516 FALSE 2_Clusters_even_far 1
4 Lamc1 E13.5-187 FALSE 2_Clusters_even_far 1
5 Lama1 E17.5-516 FALSE 2_Clusters_even_far 1
6 Lama1 E13.5-187 TRUE 2_Clusters_even_far 1length(unique(ground_truth_tot$genes)) [1] 14695sum(ground_truth_tot$value)[1] 2325ROC for COTAN
onlyPositive.pVal.Cotan_tot <- NA

for (ind in 1:dim(subset.datasets_csv)[1]) {
  #print(ind)
  file.code <- paste0(subset.datasets_csv$Group[ind],"_",
                      subset.datasets_csv$Collection[ind])
  dataset <- readRDS(file = file.path(dataSetDir,paste0(file.code,".RDS")))
  deaCOTAN <- getClusterizationData(dataset,clName = "mergedClusters")[[2]]
  pvalCOTAN <- pValueFromDEA(deaCOTAN,
              numCells = getNumCells(dataset),adjustmentMethod ="none")

  clusterization <- getClusterizationData(dataset, clName = "mergedClusters")[[1]]
  cl.names <- NA

  for (cl.val in  unique(clusterization)) {
    #print(cl.val)
    cl.names <- c(cl.names,
                  str_split(names(clusterization[clusterization == cl.val])[1],
                            pattern = "_",simplify = T)[1])
    cl.names <- cl.names[!is.na(cl.names)]
  }
  colnames(deaCOTAN) <- cl.names
  colnames(pvalCOTAN) <- cl.names

  clusters <- str_split(datasets_csv$Collection[ind],pattern = "_[+]_",simplify = T)

  onlyPositive.pVal.Cotan <- pvalCOTAN

    for (cl in cl.names) {
    print(cl)
    #temp.DEA.CotanSign <- deaCOTAN[rownames(pvalCOTAN[pvalCOTAN[,cl] < 0.05,]) ,]
    onlyPositive.pVal.Cotan[rownames(deaCOTAN[deaCOTAN[,cl] < 0,]),cl] <-  1 #onlyPositive.pVal.Cotan[rownames(deaCOTAN[deaCOTAN[,cl] < 0,]),cl]+1
    }

    onlyPositive.pVal.Cotan$genes <- rownames(onlyPositive.pVal.Cotan)
    onlyPositive.pVal.Cotan <- pivot_longer(onlyPositive.pVal.Cotan,
                                            values_to = "p_values",
                               cols = 1:(ncol(onlyPositive.pVal.Cotan)-1),
                               names_to = "clusters")
  onlyPositive.pVal.Cotan$data_set <- subset.datasets_csv[ind,1]
  onlyPositive.pVal.Cotan$set_number <- ind
  onlyPositive.pVal.Cotan_tot <- rbind(onlyPositive.pVal.Cotan_tot, onlyPositive.pVal.Cotan)

  }
[1] "E13.5-187"
[1] "E17.5-516"
[1] "E15.0-510"
[1] "E13.5-437"
[1] "E15.0-509"
[1] "E13.5-184"onlyPositive.pVal.Cotan_tot <- onlyPositive.pVal.Cotan_tot[2:nrow(onlyPositive.pVal.Cotan_tot),]
onlyPositive.pVal.Cotan_tot <- merge.data.frame(onlyPositive.pVal.Cotan_tot,
ground_truth_tot,by = c("genes","clusters","data_set","set_number"),all.x = T,all.y = F)
#onlyPositive.pVal.Cotan_tot <- onlyPositive.pVal.Cotan_tot[order(onlyPositive.pVal.Cotan_tot$p_values,
# decreasing = F),]
# df <- as.data.frame(matrix(nrow = nrow(onlyPositive.pVal.Cotan_tot),ncol = 3))
# colnames(df) <- c("TPR","FPR","Method")
# df$Method <- "COTAN"
#
# Positive <- sum(onlyPositive.pVal.Cotan_tot$value)
# Negative <- sum(!onlyPositive.pVal.Cotan_tot$value)
#
# for (i in 1:nrow(onlyPositive.pVal.Cotan_tot)) {
# df[i,"TPR"] <- sum(onlyPositive.pVal.Cotan_tot[1:i,"value"])/Positive
# df[i,"FPR"] <- (i-sum(onlyPositive.pVal.Cotan_tot[1:i,"value"]))/Negative
# Convert TRUE/FALSE to 1/0
onlyPositive.pVal.Cotan_tot$value <- as.numeric(onlyPositive.pVal.Cotan_tot$value)
# Compute the ROC curve - note that we invert the p-values with 1 - p_values
roc_resultCOTAN <- roc(onlyPositive.pVal.Cotan_tot$value, 1 - onlyPositive.pVal.Cotan_tot$p_values)
# Plot the ROC curve
#plot(roc_resultCOTAN)ROC for Seurat
deaSeurat_tot <- NA

for (ind in 1:dim(subset.datasets_csv)[1]) {
  #print(ind)
  file.code <- paste0(subset.datasets_csv$Group[ind],"_",subset.datasets_csv$Collection[ind])

  dataset <- readRDS(file = file.path(dataSetDir,paste0(file.code,".RDS")))

  clusterization <- getClusterizationData(dataset, clName = "mergedClusters")[[1]]

  deaSeurat <- read.csv(file.path(dirOut,paste0(file.code,"Seurat_DEA_genes.csv")), row.names = 1)

  cl.names <- NA

  for (cl.val in  unique(clusterization)) {
    #print(cl.val)
    cl.name <- str_split(names(clusterization[clusterization == cl.val])[1],
                            pattern = "_",simplify = T)[1]
    cl.names <- c(cl.names,cl.name)
    cl.names <- cl.names[!is.na(cl.names)]

    deaSeurat[deaSeurat$cluster == cl.val,]$cluster <- cl.name

  }

  clusters <- str_split(datasets_csv$Collection[ind],pattern = "_[+]_",simplify = T)

  colnames(deaSeurat) <- str_replace(colnames(deaSeurat),
                                     pattern = "cluster",
                                     replacement = "clusters")
  colnames(deaSeurat) <- str_replace(colnames(deaSeurat),
                                     pattern = "gene",
                                     replacement = "genes")

  deaSeurat$data_set <- subset.datasets_csv[ind,1]
  deaSeurat$set_number <- ind
  deaSeurat_tot <- rbind(deaSeurat_tot, deaSeurat)


  }
 deaSeurat_tot <-  deaSeurat_tot[2:nrow(deaSeurat_tot),]

 deaSeurat_tot <- merge.data.frame(deaSeurat_tot,
                                   ground_truth_tot,
                                   by = c("genes","clusters","data_set","set_number"),
                                   all.x = T,all.y = F)

# Convert TRUE/FALSE to 1/0
deaSeurat_tot$value <- as.numeric(deaSeurat_tot$value)

# Compute the ROC curve - note that we invert the p-values with 1 - p_values
roc_resultSeurat <- roc(deaSeurat_tot$value, 1 - deaSeurat_tot$p_val)

# Plot the ROC curve
#plot(roc_resultSeurat)
ROC for Seurat scTransform
deaSeurat_tot <- NA

for (ind in 1:dim(subset.datasets_csv)[1]) {
  #print(ind)
  file.code <- paste0(subset.datasets_csv$Group[ind],"_",subset.datasets_csv$Collection[ind])

  dataset <- readRDS(file = file.path(dataSetDir,paste0(file.code,".RDS")))

  clusterization <- getClusterizationData(dataset, clName = "mergedClusters")[[1]]

  deaSeurat <- read.csv(file.path(dirOut,paste0(file.code,"Seurat_DEA_ScTransform_genes.csv")), row.names = 1)

  cl.names <- NA

  for (cl.val in  unique(clusterization)) {
    #print(cl.val)
    cl.name <- str_split(names(clusterization[clusterization == cl.val])[1],
                            pattern = "_",simplify = T)[1]
    cl.names <- c(cl.names,cl.name)
    cl.names <- cl.names[!is.na(cl.names)]

    deaSeurat[deaSeurat$cluster == cl.val,]$cluster <- cl.name

  }

  clusters <- str_split(datasets_csv$Collection[ind],pattern = "_[+]_",simplify = T)

  colnames(deaSeurat) <- str_replace(colnames(deaSeurat),
                                     pattern = "cluster",
                                     replacement = "clusters")
  colnames(deaSeurat) <- str_replace(colnames(deaSeurat),
                                     pattern = "gene",
                                     replacement = "genes")

  deaSeurat$data_set <- subset.datasets_csv[ind,1]
  deaSeurat$set_number <- ind
  deaSeurat_tot <- rbind(deaSeurat_tot, deaSeurat)


  }
 deaSeurat_tot <-  deaSeurat_tot[2:nrow(deaSeurat_tot),]

 deaSeurat_tot <- merge.data.frame(deaSeurat_tot,
                                   ground_truth_tot,
                                   by = c("genes","clusters","data_set","set_number"),
                                   all.x = T,all.y = F)

# Convert TRUE/FALSE to 1/0
deaSeurat_tot$value <- as.numeric(deaSeurat_tot$value)

# Compute the ROC curve - note that we invert the p-values with 1 - p_values
roc_resultSeurat_scTr <- roc(deaSeurat_tot$value, 1 - deaSeurat_tot$p_val)
ROC for Seurat Bimod
deaSeurat_tot <- NA

for (ind in 1:dim(subset.datasets_csv)[1]) {
  #print(ind)
  file.code <- paste0(subset.datasets_csv$Group[ind],"_",subset.datasets_csv$Collection[ind])

  dataset <- readRDS(file = file.path(dataSetDir,paste0(file.code,".RDS")))

  clusterization <- getClusterizationData(dataset, clName = "mergedClusters")[[1]]

  deaSeurat <- read.csv(file.path(dirOut,paste0(file.code,"Seurat_DEA_Bimod_genes.csv")), row.names = 1)

  cl.names <- NA

  for (cl.val in  unique(clusterization)) {
    #print(cl.val)
    cl.name <- str_split(names(clusterization[clusterization == cl.val])[1],
                            pattern = "_",simplify = T)[1]
    cl.names <- c(cl.names,cl.name)
    cl.names <- cl.names[!is.na(cl.names)]

    deaSeurat[deaSeurat$cluster == cl.val,]$cluster <- cl.name

  }

  clusters <- str_split(datasets_csv$Collection[ind],pattern = "_[+]_",simplify = T)

  colnames(deaSeurat) <- str_replace(colnames(deaSeurat),
                                     pattern = "cluster",
                                     replacement = "clusters")
  colnames(deaSeurat) <- str_replace(colnames(deaSeurat),
                                     pattern = "gene",
                                     replacement = "genes")

  deaSeurat$data_set <- subset.datasets_csv[ind,1]
  deaSeurat$set_number <- ind
  deaSeurat_tot <- rbind(deaSeurat_tot, deaSeurat)


  }
 deaSeurat_tot <-  deaSeurat_tot[2:nrow(deaSeurat_tot),]

 deaSeurat_tot <- merge.data.frame(deaSeurat_tot,
                                   ground_truth_tot,
                                   by = c("genes","clusters","data_set","set_number"),
                                   all.x = T,all.y = F)

# Convert TRUE/FALSE to 1/0
deaSeurat_tot$value <- as.numeric(deaSeurat_tot$value)

# Compute the ROC curve - note that we invert the p-values with 1 - p_values
roc_resultSeurat_Bimod <- roc(deaSeurat_tot$value, 1 - deaSeurat_tot$p_val)
ROC for Monocle
deaMonocle_tot <- NA
for (ind in 1:dim(subset.datasets_csv)[1]) {
  file.code <- paste0(subset.datasets_csv$Group[ind],"_",subset.datasets_csv$Collection[ind])
  dataset <- readRDS(file = file.path(dataSetDir,paste0(file.code,".RDS")))

  clusterization <- getClusterizationData(dataset, clName = "mergedClusters")[[1]]
  #print(file.code)

  deaMonocle <- read.csv(file.path(dirOut,paste0(file.code,"Monocle_DEA_genes.csv")),row.names = 1)

  cl.names <- NA

  for (cl.val in  unique(clusterization)) {
    #print(cl.val)
    cl.name <- str_split(names(clusterization[clusterization == cl.val])[1],
                            pattern = "_",simplify = T)[1]
    cl.names <- c(cl.names,cl.name)
    cl.names <- cl.names[!is.na(cl.names)]

    deaMonocle[deaMonocle$cell_group == cl.val,"cell_group"] <- cl.name

  }

  clusters <- str_split(datasets_csv$Collection[ind],pattern = "_[+]_",simplify = T)

  colnames(deaMonocle) <- str_replace(colnames(deaMonocle),
                                     pattern = "cell_group",
                                     replacement = "clusters")
  colnames(deaMonocle) <- str_replace(colnames(deaMonocle),
                                     pattern = "gene_id",
                                     replacement = "genes")

  deaMonocle$data_set <- subset.datasets_csv[ind,1]
  deaMonocle$set_number <- ind
  deaMonocle <- as.data.frame(deaMonocle)
  deaMonocle_tot <- rbind(deaMonocle_tot, deaMonocle)


  }
 deaMonocle_tot <-  deaMonocle_tot[2:nrow(deaMonocle_tot),]

 deaMonocle_tot <- merge.data.frame(deaMonocle_tot,
                                   ground_truth_tot,
                                   by = c("genes","clusters","data_set","set_number"),
                                   all.x = T,all.y = F)

# Convert TRUE/FALSE to 1/0
deaMonocle_tot$value <- as.numeric(deaMonocle_tot$value)

# Compute the ROC curve - note that we invert the p-values with 1 - p_values
roc_resultMonocle <- roc(deaMonocle_tot$value, 1 - deaMonocle_tot$marker_test_p_value)

# Plot the ROC curve
#plot(roc_resultMonocle)
ROC from Scanpy
deaScanpy_tot <- NA
for (ind in 1:dim(subset.datasets_csv)[1]) {
  file.code <- paste0(subset.datasets_csv$Group[ind],"_",subset.datasets_csv$Collection[ind])
  dataset <- readRDS(file = file.path(dataSetDir,paste0(file.code,".RDS")))

  clusterization <- getClusterizationData(dataset, clName = "mergedClusters")[[1]]
  #print(file.code)

  deaScanpy <- read.csv(file.path(dirOut,paste0(file.code,"Scanpy_DEA_genes.csv")),
                        row.names = 1)

  cl.names <- NA

  for (cl.val in  unique(clusterization)) {
    #print(cl.val)
    cl.name <- str_split(names(clusterization[clusterization == cl.val])[1],
                            pattern = "_",simplify = T)[1]
    cl.names <- c(cl.names,cl.name)
    cl.names <- cl.names[!is.na(cl.names)]

    deaScanpy[deaScanpy$clusters == paste0("cl",cl.val),"clusters"] <- cl.name

  }

  clusters <- str_split(datasets_csv$Collection[ind],pattern = "_[+]_",simplify = T)


  deaScanpy$data_set <- subset.datasets_csv[ind,1]
  deaScanpy$set_number <- ind
  deaScanpy_tot <- rbind(deaScanpy_tot, deaScanpy)


  }
 deaScanpy_tot <-  deaScanpy_tot[2:nrow(deaScanpy_tot),]

 deaScanpy_tot <- merge.data.frame(deaScanpy_tot,
                                   ground_truth_tot,
                                   by = c("genes","clusters","data_set","set_number"),
                                   all.x = T,all.y = F)

# Convert TRUE/FALSE to 1/0
deaScanpy_tot$value <- as.numeric(deaScanpy_tot$value)

# Compute the ROC curve - note that we invert the p-values with 1 - p_values
roc_resultScanpy <- roc(deaScanpy_tot$value, 1 - deaScanpy_tot$pval)

# Plot the ROC curve
#plot(roc_resultScanpy)
Summary ROC for all methods
Two_Clusters_even_far <- ggroc(list(COTAN=roc_resultCOTAN,
                                    Seurat=roc_resultSeurat,
                 Seurat_scTr = roc_resultSeurat_scTr,
                 Seurat_Bimod = roc_resultSeurat_Bimod,
                 Monocle=roc_resultMonocle,
                 Scanpy=roc_resultScanpy),
                 aes = c("colour"),
            legacy.axes = T,
            linewidth = 1)+theme_light()+
  scale_colour_manual("",
                      values = methods.color)

Two_Clusters_even_farPL <- Two_Clusters_even_far + xlab("FPR") + ylab("TPR")
Two_Clusters_even_farPL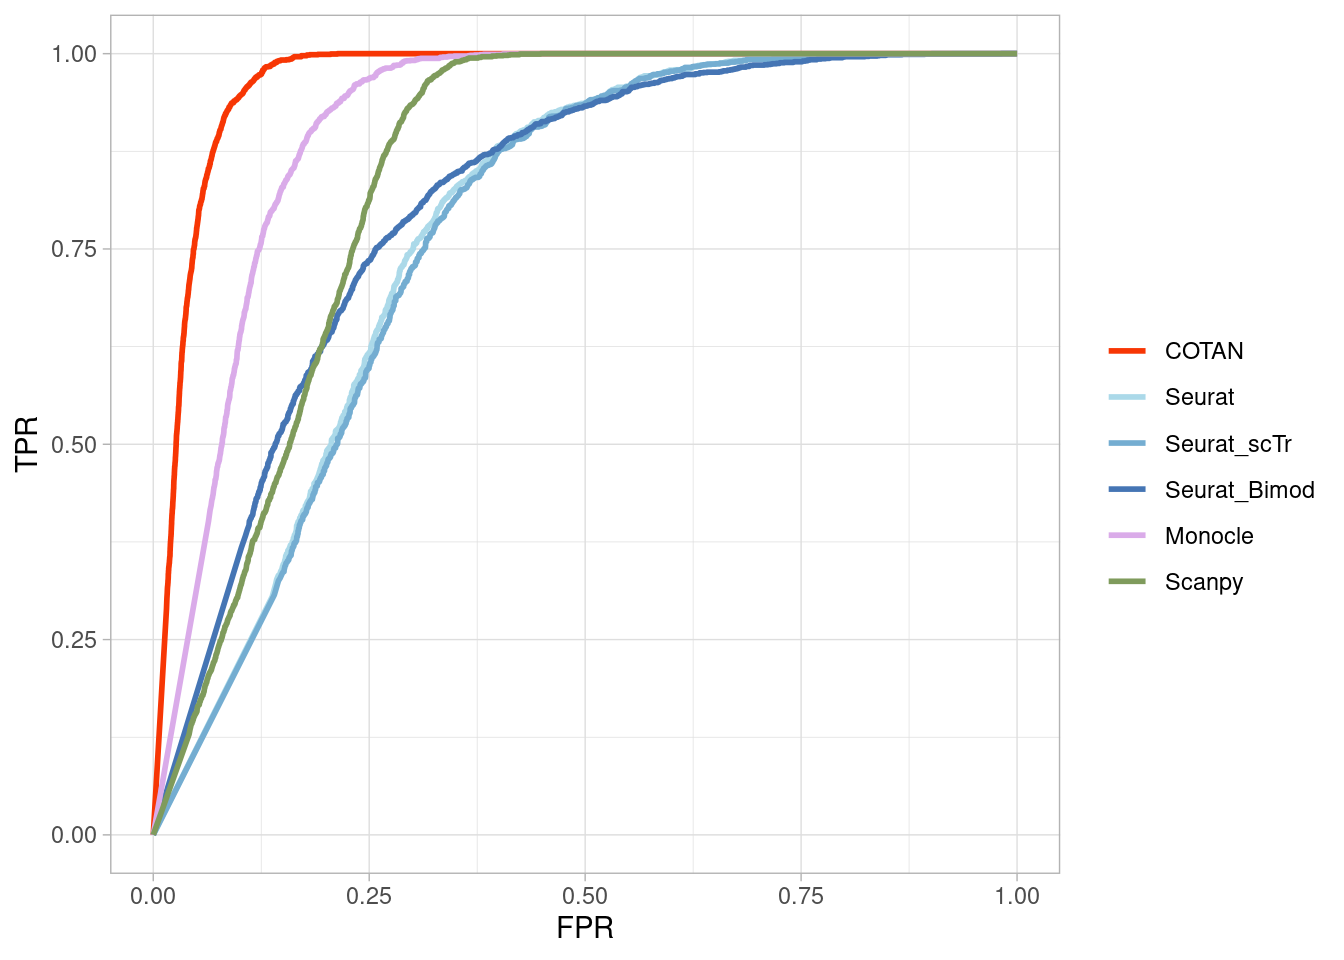
2 clusters uneven
2_Clusters_uneven_near
True vector
subset.datasets_csv <-datasets_csv[datasets_csv$Group == "2_Clusters_uneven_near",]

ground_truth_tot <- NA

for (ind in 1:dim(subset.datasets_csv)[1]) {
  clusters <- str_split(subset.datasets_csv$Collection[ind],pattern = "_[+]_",simplify = T)

  file.presence.subset <- file.presence[,clusters]


  #file.presence.subset <- as.matrix(file.presence.subset)


  ground_truth <- as.data.frame(matrix(nrow = nrow(file.presence.subset),
                                       ncol = ncol(file.presence.subset)))
  rownames(ground_truth) <- rownames(file.presence.subset)
  colnames(ground_truth) <- colnames(file.presence.subset)

  ground_truth[file.presence.subset == "Absent"] <- 0
  ground_truth[file.presence.subset == "Present"] <- 1
  ground_truth[file.presence.subset == "Uncertain"] <- 0.6

  file.presence.subset <- ground_truth

  for (col in 1:ncol(ground_truth)) {
    ground_truth[,col] <- FALSE
    ground_truth[file.presence.subset[,col] == 1 & rowMeans(file.presence.subset[,-col,drop = FALSE]) < 0.35  ,col] <- TRUE
    }

  ground_truth$genes <- rownames(ground_truth)
  ground_truth <- pivot_longer(ground_truth,
                               cols = 1:(ncol(ground_truth)-1),
                               names_to = "clusters")
  ground_truth$data_set <- subset.datasets_csv[ind,1]
  ground_truth$set_number <- ind
  ground_truth_tot <- rbind(ground_truth_tot, ground_truth)

}
ground_truth_tot <- ground_truth_tot[2:nrow(ground_truth_tot),]

head(ground_truth_tot)
# A tibble: 6 × 5
genes clusters value data_set set_number
<chr> <chr> <lgl> <chr> <int>
1 Neil2 E13.5-434 FALSE 2_Clusters_uneven_near 1
2 Neil2 E15.0-428 FALSE 2_Clusters_uneven_near 1
3 Lamc1 E13.5-434 FALSE 2_Clusters_uneven_near 1
4 Lamc1 E15.0-428 FALSE 2_Clusters_uneven_near 1
5 Lama1 E13.5-434 FALSE 2_Clusters_uneven_near 1
6 Lama1 E15.0-428 FALSE 2_Clusters_uneven_near 1length(unique(ground_truth_tot$genes)) [1] 14695sum(ground_truth_tot$value)[1] 24ROC for COTAN
onlyPositive.pVal.Cotan_tot <- NA

for (ind in 1:dim(subset.datasets_csv)[1]) {
  #print(ind)
  file.code <- paste0(subset.datasets_csv$Group[ind],"_",
                      subset.datasets_csv$Collection[ind])
  dataset <- readRDS(file = file.path(dataSetDir,paste0(file.code,".RDS")))
  deaCOTAN <- getClusterizationData(dataset,clName = "mergedClusters")[[2]]
  pvalCOTAN <- pValueFromDEA(deaCOTAN,
              numCells = getNumCells(dataset),adjustmentMethod ="none")

  clusterization <- getClusterizationData(dataset, clName = "mergedClusters")[[1]]
  cl.names <- NA

  for (cl.val in  unique(clusterization)) {
    #print(cl.val)
    cl.names <- c(cl.names,
                  str_split(names(clusterization[clusterization == cl.val])[1],
                            pattern = "_",simplify = T)[1])
    cl.names <- cl.names[!is.na(cl.names)]
  }
  colnames(deaCOTAN) <- cl.names
  colnames(pvalCOTAN) <- cl.names

  clusters <- str_split(datasets_csv$Collection[ind],pattern = "_[+]_",simplify = T)

  onlyPositive.pVal.Cotan <- pvalCOTAN

    for (cl in cl.names) {
    print(cl)
    #temp.DEA.CotanSign <- deaCOTAN[rownames(pvalCOTAN[pvalCOTAN[,cl] < 0.05,]) ,]
    onlyPositive.pVal.Cotan[rownames(deaCOTAN[deaCOTAN[,cl] < 0,]),cl] <-  1 #onlyPositive.pVal.Cotan[rownames(deaCOTAN[deaCOTAN[,cl] < 0,]),cl]+1
    }

    onlyPositive.pVal.Cotan$genes <- rownames(onlyPositive.pVal.Cotan)
    onlyPositive.pVal.Cotan <- pivot_longer(onlyPositive.pVal.Cotan,
                                            values_to = "p_values",
                               cols = 1:(ncol(onlyPositive.pVal.Cotan)-1),
                               names_to = "clusters")
  onlyPositive.pVal.Cotan$data_set <- subset.datasets_csv[ind,1]
  onlyPositive.pVal.Cotan$set_number <- ind
  onlyPositive.pVal.Cotan_tot <- rbind(onlyPositive.pVal.Cotan_tot, onlyPositive.pVal.Cotan)

  }
[1] "E13.5-434"
[1] "E15.0-428"
[1] "E15.0-432"
[1] "E13.5-432"
[1] "E15.0-509"
[1] "E15.0-508"onlyPositive.pVal.Cotan_tot <- onlyPositive.pVal.Cotan_tot[2:nrow(onlyPositive.pVal.Cotan_tot),]
onlyPositive.pVal.Cotan_tot <- merge.data.frame(onlyPositive.pVal.Cotan_tot,
ground_truth_tot,by = c("genes","clusters","data_set","set_number"),all.x = T,all.y = F)
#onlyPositive.pVal.Cotan_tot <- onlyPositive.pVal.Cotan_tot[order(onlyPositive.pVal.Cotan_tot$p_values,
# decreasing = F),]
# df <- as.data.frame(matrix(nrow = nrow(onlyPositive.pVal.Cotan_tot),ncol = 3))
# colnames(df) <- c("TPR","FPR","Method")
# df$Method <- "COTAN"
#
# Positive <- sum(onlyPositive.pVal.Cotan_tot$value)
# Negative <- sum(!onlyPositive.pVal.Cotan_tot$value)
#
# for (i in 1:nrow(onlyPositive.pVal.Cotan_tot)) {
# df[i,"TPR"] <- sum(onlyPositive.pVal.Cotan_tot[1:i,"value"])/Positive
# df[i,"FPR"] <- (i-sum(onlyPositive.pVal.Cotan_tot[1:i,"value"]))/Negative
# Convert TRUE/FALSE to 1/0
onlyPositive.pVal.Cotan_tot$value <- as.numeric(onlyPositive.pVal.Cotan_tot$value)
# Compute the ROC curve - note that we invert the p-values with 1 - p_values
roc_resultCOTAN <- roc(onlyPositive.pVal.Cotan_tot$value, 1 - onlyPositive.pVal.Cotan_tot$p_values)
# Plot the ROC curve
#plot(roc_resultCOTAN)ROC for Seurat
deaSeurat_tot <- NA

for (ind in 1:dim(subset.datasets_csv)[1]) {
  #print(ind)
  file.code <- paste0(subset.datasets_csv$Group[ind],"_",subset.datasets_csv$Collection[ind])

  dataset <- readRDS(file = file.path(dataSetDir,paste0(file.code,".RDS")))

  clusterization <- getClusterizationData(dataset, clName = "mergedClusters")[[1]]

  deaSeurat <- read.csv(file.path(dirOut,paste0(file.code,"Seurat_DEA_genes.csv")), row.names = 1)

  cl.names <- NA

  for (cl.val in  unique(clusterization)) {
    #print(cl.val)
    cl.name <- str_split(names(clusterization[clusterization == cl.val])[1],
                            pattern = "_",simplify = T)[1]
    cl.names <- c(cl.names,cl.name)
    cl.names <- cl.names[!is.na(cl.names)]

    deaSeurat[deaSeurat$cluster == cl.val,]$cluster <- cl.name

  }

  clusters <- str_split(datasets_csv$Collection[ind],pattern = "_[+]_",simplify = T)

  colnames(deaSeurat) <- str_replace(colnames(deaSeurat),
                                     pattern = "cluster",
                                     replacement = "clusters")
  colnames(deaSeurat) <- str_replace(colnames(deaSeurat),
                                     pattern = "gene",
                                     replacement = "genes")

  deaSeurat$data_set <- subset.datasets_csv[ind,1]
  deaSeurat$set_number <- ind
  deaSeurat_tot <- rbind(deaSeurat_tot, deaSeurat)


  }
 deaSeurat_tot <-  deaSeurat_tot[2:nrow(deaSeurat_tot),]

 deaSeurat_tot <- merge.data.frame(deaSeurat_tot,
                                   ground_truth_tot,
                                   by = c("genes","clusters","data_set","set_number"),
                                   all.x = T,all.y = F)

# Convert TRUE/FALSE to 1/0
deaSeurat_tot$value <- as.numeric(deaSeurat_tot$value)

# Compute the ROC curve - note that we invert the p-values with 1 - p_values
roc_resultSeurat <- roc(deaSeurat_tot$value, 1 - deaSeurat_tot$p_val)

# Plot the ROC curve
plot(roc_resultSeurat)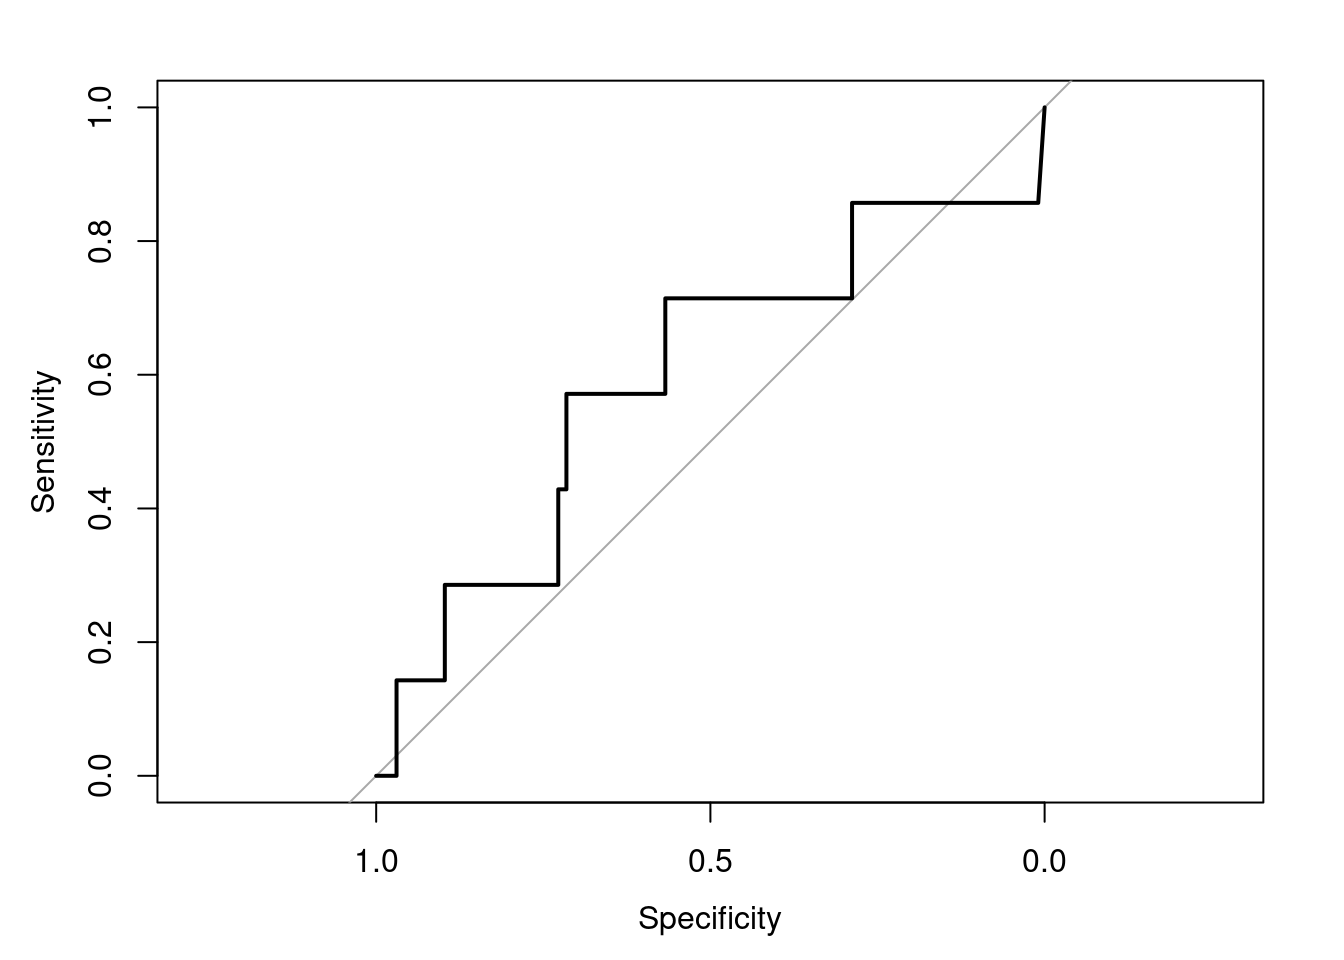
ROC for Seurat scTransform
deaSeurat_tot <- NA

for (ind in 1:dim(subset.datasets_csv)[1]) {
  #print(ind)
  file.code <- paste0(subset.datasets_csv$Group[ind],"_",subset.datasets_csv$Collection[ind])

  dataset <- readRDS(file = file.path(dataSetDir,paste0(file.code,".RDS")))

  clusterization <- getClusterizationData(dataset, clName = "mergedClusters")[[1]]

  deaSeurat <- read.csv(file.path(dirOut,paste0(file.code,"Seurat_DEA_ScTransform_genes.csv")), row.names = 1)

  cl.names <- NA

  for (cl.val in  unique(clusterization)) {
    #print(cl.val)
    cl.name <- str_split(names(clusterization[clusterization == cl.val])[1],
                            pattern = "_",simplify = T)[1]
    cl.names <- c(cl.names,cl.name)
    cl.names <- cl.names[!is.na(cl.names)]

    deaSeurat[deaSeurat$cluster == cl.val,]$cluster <- cl.name

  }

  clusters <- str_split(datasets_csv$Collection[ind],pattern = "_[+]_",simplify = T)

  colnames(deaSeurat) <- str_replace(colnames(deaSeurat),
                                     pattern = "cluster",
                                     replacement = "clusters")
  colnames(deaSeurat) <- str_replace(colnames(deaSeurat),
                                     pattern = "gene",
                                     replacement = "genes")

  deaSeurat$data_set <- subset.datasets_csv[ind,1]
  deaSeurat$set_number <- ind
  deaSeurat_tot <- rbind(deaSeurat_tot, deaSeurat)


  }
 deaSeurat_tot <-  deaSeurat_tot[2:nrow(deaSeurat_tot),]

 deaSeurat_tot <- merge.data.frame(deaSeurat_tot,
                                   ground_truth_tot,
                                   by = c("genes","clusters","data_set","set_number"),
                                   all.x = T,all.y = F)

# Convert TRUE/FALSE to 1/0
deaSeurat_tot$value <- as.numeric(deaSeurat_tot$value)

# Compute the ROC curve - note that we invert the p-values with 1 - p_values
roc_resultSeurat_scTr <- roc(deaSeurat_tot$value, 1 - deaSeurat_tot$p_val)
ROC for Seurat Bimod
deaSeurat_tot <- NA

for (ind in 1:dim(subset.datasets_csv)[1]) {
  #print(ind)
  file.code <- paste0(subset.datasets_csv$Group[ind],"_",subset.datasets_csv$Collection[ind])

  dataset <- readRDS(file = file.path(dataSetDir,paste0(file.code,".RDS")))

  clusterization <- getClusterizationData(dataset, clName = "mergedClusters")[[1]]

  deaSeurat <- read.csv(file.path(dirOut,paste0(file.code,"Seurat_DEA_Bimod_genes.csv")), row.names = 1)

  cl.names <- NA

  for (cl.val in  unique(clusterization)) {
    #print(cl.val)
    cl.name <- str_split(names(clusterization[clusterization == cl.val])[1],
                            pattern = "_",simplify = T)[1]
    cl.names <- c(cl.names,cl.name)
    cl.names <- cl.names[!is.na(cl.names)]

    deaSeurat[deaSeurat$cluster == cl.val,]$cluster <- cl.name

  }

  clusters <- str_split(datasets_csv$Collection[ind],pattern = "_[+]_",simplify = T)

  colnames(deaSeurat) <- str_replace(colnames(deaSeurat),
                                     pattern = "cluster",
                                     replacement = "clusters")
  colnames(deaSeurat) <- str_replace(colnames(deaSeurat),
                                     pattern = "gene",
                                     replacement = "genes")

  deaSeurat$data_set <- subset.datasets_csv[ind,1]
  deaSeurat$set_number <- ind
  deaSeurat_tot <- rbind(deaSeurat_tot, deaSeurat)


  }
 deaSeurat_tot <-  deaSeurat_tot[2:nrow(deaSeurat_tot),]

 deaSeurat_tot <- merge.data.frame(deaSeurat_tot,
                                   ground_truth_tot,
                                   by = c("genes","clusters","data_set","set_number"),
                                   all.x = T,all.y = F)

# Convert TRUE/FALSE to 1/0
deaSeurat_tot$value <- as.numeric(deaSeurat_tot$value)

# Compute the ROC curve - note that we invert the p-values with 1 - p_values
roc_resultSeurat_Bimod <- roc(deaSeurat_tot$value, 1 - deaSeurat_tot$p_val)
ROC for Monocle
deaMonocle_tot <- NA
for (ind in 1:dim(subset.datasets_csv)[1]) {
  file.code <- paste0(subset.datasets_csv$Group[ind],"_",subset.datasets_csv$Collection[ind])
  dataset <- readRDS(file = file.path(dataSetDir,paste0(file.code,".RDS")))

  clusterization <- getClusterizationData(dataset, clName = "mergedClusters")[[1]]
  #print(file.code)

  deaMonocle <- read.csv(file.path(dirOut,paste0(file.code,"Monocle_DEA_genes.csv")),row.names = 1)

  cl.names <- NA

  for (cl.val in  unique(clusterization)) {
    #print(cl.val)
    cl.name <- str_split(names(clusterization[clusterization == cl.val])[1],
                            pattern = "_",simplify = T)[1]
    cl.names <- c(cl.names,cl.name)
    cl.names <- cl.names[!is.na(cl.names)]

    deaMonocle[deaMonocle$cell_group == cl.val,"cell_group"] <- cl.name

  }

  clusters <- str_split(datasets_csv$Collection[ind],pattern = "_[+]_",simplify = T)

  colnames(deaMonocle) <- str_replace(colnames(deaMonocle),
                                     pattern = "cell_group",
                                     replacement = "clusters")
  colnames(deaMonocle) <- str_replace(colnames(deaMonocle),
                                     pattern = "gene_id",
                                     replacement = "genes")

  deaMonocle$data_set <- subset.datasets_csv[ind,1]
  deaMonocle$set_number <- ind
  deaMonocle <- as.data.frame(deaMonocle)
  deaMonocle_tot <- rbind(deaMonocle_tot, deaMonocle)


  }
 deaMonocle_tot <-  deaMonocle_tot[2:nrow(deaMonocle_tot),]

 deaMonocle_tot <- merge.data.frame(deaMonocle_tot,
                                   ground_truth_tot,
                                   by = c("genes","clusters","data_set","set_number"),
                                   all.x = T,all.y = F)

# Convert TRUE/FALSE to 1/0
deaMonocle_tot$value <- as.numeric(deaMonocle_tot$value)

# Compute the ROC curve - note that we invert the p-values with 1 - p_values
roc_resultMonocle <- roc(deaMonocle_tot$value, 1 - deaMonocle_tot$marker_test_p_value)

# Plot the ROC curve
#plot(roc_resultMonocle)
ROC from Scanpy
deaScanpy_tot <- NA
for (ind in 1:dim(subset.datasets_csv)[1]) {
  file.code <- paste0(subset.datasets_csv$Group[ind],"_",subset.datasets_csv$Collection[ind])
  dataset <- readRDS(file = file.path(dataSetDir,paste0(file.code,".RDS")))

  clusterization <- getClusterizationData(dataset, clName = "mergedClusters")[[1]]
  #print(file.code)

  deaScanpy <- read.csv(file.path(dirOut,paste0(file.code,"Scanpy_DEA_genes.csv")),
                        row.names = 1)

  cl.names <- NA

  for (cl.val in  unique(clusterization)) {
    #print(cl.val)
    cl.name <- str_split(names(clusterization[clusterization == cl.val])[1],
                            pattern = "_",simplify = T)[1]
    cl.names <- c(cl.names,cl.name)
    cl.names <- cl.names[!is.na(cl.names)]

    deaScanpy[deaScanpy$clusters == paste0("cl",cl.val),"clusters"] <- cl.name

  }

  clusters <- str_split(datasets_csv$Collection[ind],pattern = "_[+]_",simplify = T)


  deaScanpy$data_set <- subset.datasets_csv[ind,1]
  deaScanpy$set_number <- ind
  deaScanpy_tot <- rbind(deaScanpy_tot, deaScanpy)


  }
 deaScanpy_tot <-  deaScanpy_tot[2:nrow(deaScanpy_tot),]

 deaScanpy_tot <- merge.data.frame(deaScanpy_tot,
                                   ground_truth_tot,
                                   by = c("genes","clusters","data_set","set_number"),
                                   all.x = T,all.y = F)

# Convert TRUE/FALSE to 1/0
deaScanpy_tot$value <- as.numeric(deaScanpy_tot$value)

# Compute the ROC curve - note that we invert the p-values with 1 - p_values
roc_resultScanpy <- roc(deaScanpy_tot$value, 1 - deaScanpy_tot$pval)

# Plot the ROC curve
#plot(roc_resultScanpy)
Summary ROC for all methods
Two_Clusters_uneven_near <- ggroc(list(COTAN=roc_resultCOTAN,
                                    Seurat=roc_resultSeurat,
                 Seurat_scTr = roc_resultSeurat_scTr,
                 Seurat_Bimod = roc_resultSeurat_Bimod,
                 Monocle=roc_resultMonocle,
                 Scanpy=roc_resultScanpy),
                 aes = c("colour"),
            legacy.axes = T,
            linewidth = 1)+theme_light()+
  scale_colour_manual("",
                      values = methods.color)

Two_Clusters_uneven_nearPL <- Two_Clusters_uneven_near + xlab("FPR") + ylab("TPR")
Two_Clusters_uneven_nearPL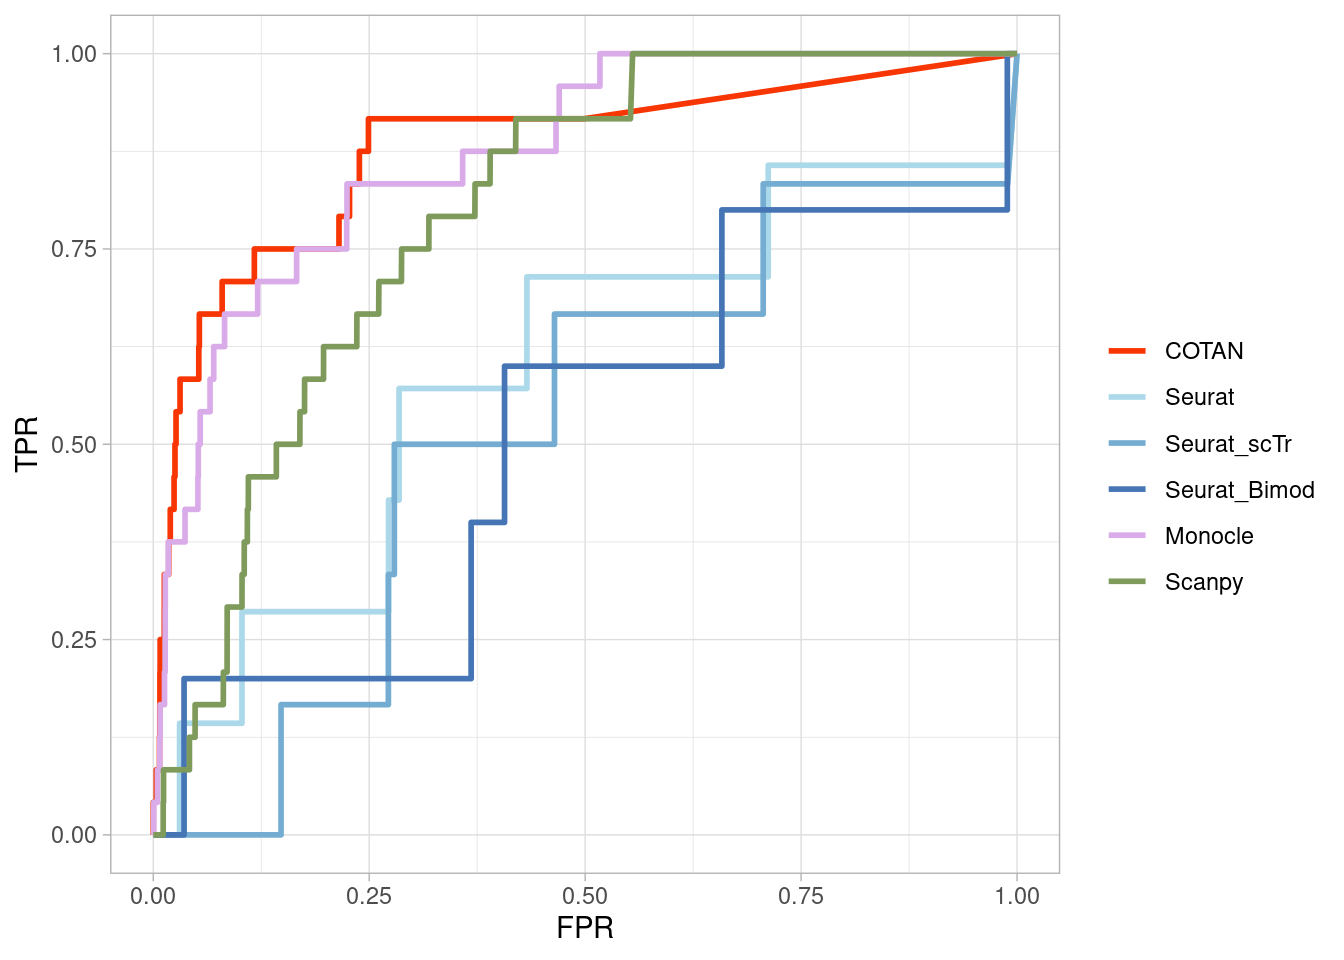
2_Clusters_uneven_medium
True vector
subset.datasets_csv <-datasets_csv[datasets_csv$Group == "2_Clusters_uneven_medium",]

ground_truth_tot <- NA

for (ind in 1:dim(subset.datasets_csv)[1]) {
  clusters <- str_split(subset.datasets_csv$Collection[ind],pattern = "_[+]_",simplify = T)

  file.presence.subset <- file.presence[,clusters]


  #file.presence.subset <- as.matrix(file.presence.subset)


  ground_truth <- as.data.frame(matrix(nrow = nrow(file.presence.subset),
                                       ncol = ncol(file.presence.subset)))
  rownames(ground_truth) <- rownames(file.presence.subset)
  colnames(ground_truth) <- colnames(file.presence.subset)

  ground_truth[file.presence.subset == "Absent"] <- 0
  ground_truth[file.presence.subset == "Present"] <- 1
  ground_truth[file.presence.subset == "Uncertain"] <- 0.6

  file.presence.subset <- ground_truth

  for (col in 1:ncol(ground_truth)) {
    ground_truth[,col] <- FALSE
    ground_truth[file.presence.subset[,col] == 1 & rowMeans(file.presence.subset[,-col,drop = FALSE]) < 0.35  ,col] <- TRUE
    }

  ground_truth$genes <- rownames(ground_truth)
  ground_truth <- pivot_longer(ground_truth,
                               cols = 1:(ncol(ground_truth)-1),
                               names_to = "clusters")
  ground_truth$data_set <- subset.datasets_csv[ind,1]
  ground_truth$set_number <- ind
  ground_truth_tot <- rbind(ground_truth_tot, ground_truth)

}
ground_truth_tot <- ground_truth_tot[2:nrow(ground_truth_tot),]

head(ground_truth_tot)
# A tibble: 6 × 5
genes clusters value data_set set_number
<chr> <chr> <lgl> <chr> <int>
1 Neil2 E13.5-187 FALSE 2_Clusters_uneven_medium 1
2 Neil2 E13.5-184 FALSE 2_Clusters_uneven_medium 1
3 Lamc1 E13.5-187 FALSE 2_Clusters_uneven_medium 1
4 Lamc1 E13.5-184 FALSE 2_Clusters_uneven_medium 1
5 Lama1 E13.5-187 FALSE 2_Clusters_uneven_medium 1
6 Lama1 E13.5-184 FALSE 2_Clusters_uneven_medium 1length(unique(ground_truth_tot$genes)) [1] 14695sum(ground_truth_tot$value)[1] 771ROC for COTAN
onlyPositive.pVal.Cotan_tot <- NA

for (ind in 1:dim(subset.datasets_csv)[1]) {
  #print(ind)
  file.code <- paste0(subset.datasets_csv$Group[ind],"_",
                      subset.datasets_csv$Collection[ind])
  dataset <- readRDS(file = file.path(dataSetDir,paste0(file.code,".RDS")))
  deaCOTAN <- getClusterizationData(dataset,clName = "mergedClusters")[[2]]
  pvalCOTAN <- pValueFromDEA(deaCOTAN,
              numCells = getNumCells(dataset),adjustmentMethod ="none")

  clusterization <- getClusterizationData(dataset, clName = "mergedClusters")[[1]]
  cl.names <- NA

  for (cl.val in  unique(clusterization)) {
    #print(cl.val)
    cl.names <- c(cl.names,
                  str_split(names(clusterization[clusterization == cl.val])[1],
                            pattern = "_",simplify = T)[1])
    cl.names <- cl.names[!is.na(cl.names)]
  }
  colnames(deaCOTAN) <- cl.names
  colnames(pvalCOTAN) <- cl.names

  clusters <- str_split(datasets_csv$Collection[ind],pattern = "_[+]_",simplify = T)

  onlyPositive.pVal.Cotan <- pvalCOTAN

    for (cl in cl.names) {
    print(cl)
    #temp.DEA.CotanSign <- deaCOTAN[rownames(pvalCOTAN[pvalCOTAN[,cl] < 0.05,]) ,]
    onlyPositive.pVal.Cotan[rownames(deaCOTAN[deaCOTAN[,cl] < 0,]),cl] <-  1 #onlyPositive.pVal.Cotan[rownames(deaCOTAN[deaCOTAN[,cl] < 0,]),cl]+1
    }

    onlyPositive.pVal.Cotan$genes <- rownames(onlyPositive.pVal.Cotan)
    onlyPositive.pVal.Cotan <- pivot_longer(onlyPositive.pVal.Cotan,
                                            values_to = "p_values",
                               cols = 1:(ncol(onlyPositive.pVal.Cotan)-1),
                               names_to = "clusters")
  onlyPositive.pVal.Cotan$data_set <- subset.datasets_csv[ind,1]
  onlyPositive.pVal.Cotan$set_number <- ind
  onlyPositive.pVal.Cotan_tot <- rbind(onlyPositive.pVal.Cotan_tot, onlyPositive.pVal.Cotan)

  }
[1] "E13.5-187"
[1] "E13.5-184"
[1] "E17.5-516"
[1] "E15.0-434"
[1] "E15.0-508"
[1] "E15.0-437"onlyPositive.pVal.Cotan_tot <- onlyPositive.pVal.Cotan_tot[2:nrow(onlyPositive.pVal.Cotan_tot),]
onlyPositive.pVal.Cotan_tot <- merge.data.frame(onlyPositive.pVal.Cotan_tot,
ground_truth_tot,by = c("genes","clusters","data_set","set_number"),all.x = T,all.y = F)
#onlyPositive.pVal.Cotan_tot <- onlyPositive.pVal.Cotan_tot[order(onlyPositive.pVal.Cotan_tot$p_values,
# decreasing = F),]
# df <- as.data.frame(matrix(nrow = nrow(onlyPositive.pVal.Cotan_tot),ncol = 3))
# colnames(df) <- c("TPR","FPR","Method")
# df$Method <- "COTAN"
#
# Positive <- sum(onlyPositive.pVal.Cotan_tot$value)
# Negative <- sum(!onlyPositive.pVal.Cotan_tot$value)
#
# for (i in 1:nrow(onlyPositive.pVal.Cotan_tot)) {
# df[i,"TPR"] <- sum(onlyPositive.pVal.Cotan_tot[1:i,"value"])/Positive
# df[i,"FPR"] <- (i-sum(onlyPositive.pVal.Cotan_tot[1:i,"value"]))/Negative
# Convert TRUE/FALSE to 1/0
onlyPositive.pVal.Cotan_tot$value <- as.numeric(onlyPositive.pVal.Cotan_tot$value)
# Compute the ROC curve - note that we invert the p-values with 1 - p_values
roc_resultCOTAN <- roc(onlyPositive.pVal.Cotan_tot$value, 1 - onlyPositive.pVal.Cotan_tot$p_values)
# Plot the ROC curve
#plot(roc_resultCOTAN)ROC for Seurat
deaSeurat_tot <- NA

for (ind in 1:dim(subset.datasets_csv)[1]) {
  #print(ind)
  file.code <- paste0(subset.datasets_csv$Group[ind],"_",subset.datasets_csv$Collection[ind])

  dataset <- readRDS(file = file.path(dataSetDir,paste0(file.code,".RDS")))

  clusterization <- getClusterizationData(dataset, clName = "mergedClusters")[[1]]

  deaSeurat <- read.csv(file.path(dirOut,paste0(file.code,"Seurat_DEA_genes.csv")), row.names = 1)

  cl.names <- NA

  for (cl.val in  unique(clusterization)) {
    #print(cl.val)
    cl.name <- str_split(names(clusterization[clusterization == cl.val])[1],
                            pattern = "_",simplify = T)[1]
    cl.names <- c(cl.names,cl.name)
    cl.names <- cl.names[!is.na(cl.names)]

    deaSeurat[deaSeurat$cluster == cl.val,]$cluster <- cl.name

  }

  clusters <- str_split(datasets_csv$Collection[ind],pattern = "_[+]_",simplify = T)

  colnames(deaSeurat) <- str_replace(colnames(deaSeurat),
                                     pattern = "cluster",
                                     replacement = "clusters")
  colnames(deaSeurat) <- str_replace(colnames(deaSeurat),
                                     pattern = "gene",
                                     replacement = "genes")

  deaSeurat$data_set <- subset.datasets_csv[ind,1]
  deaSeurat$set_number <- ind
  deaSeurat_tot <- rbind(deaSeurat_tot, deaSeurat)


  }
 deaSeurat_tot <-  deaSeurat_tot[2:nrow(deaSeurat_tot),]

 deaSeurat_tot <- merge.data.frame(deaSeurat_tot,
                                   ground_truth_tot,
                                   by = c("genes","clusters","data_set","set_number"),
                                   all.x = T,all.y = F)

# Convert TRUE/FALSE to 1/0
deaSeurat_tot$value <- as.numeric(deaSeurat_tot$value)

# Compute the ROC curve - note that we invert the p-values with 1 - p_values
roc_resultSeurat <- roc(deaSeurat_tot$value, 1 - deaSeurat_tot$p_val)

# Plot the ROC curve
#plot(roc_resultSeurat)
ROC for Seurat scTransform
deaSeurat_tot <- NA

for (ind in 1:dim(subset.datasets_csv)[1]) {
  #print(ind)
  file.code <- paste0(subset.datasets_csv$Group[ind],"_",subset.datasets_csv$Collection[ind])

  dataset <- readRDS(file = file.path(dataSetDir,paste0(file.code,".RDS")))

  clusterization <- getClusterizationData(dataset, clName = "mergedClusters")[[1]]

  deaSeurat <- read.csv(file.path(dirOut,paste0(file.code,"Seurat_DEA_ScTransform_genes.csv")), row.names = 1)

  cl.names <- NA

  for (cl.val in  unique(clusterization)) {
    #print(cl.val)
    cl.name <- str_split(names(clusterization[clusterization == cl.val])[1],
                            pattern = "_",simplify = T)[1]
    cl.names <- c(cl.names,cl.name)
    cl.names <- cl.names[!is.na(cl.names)]

    deaSeurat[deaSeurat$cluster == cl.val,]$cluster <- cl.name

  }

  clusters <- str_split(datasets_csv$Collection[ind],pattern = "_[+]_",simplify = T)

  colnames(deaSeurat) <- str_replace(colnames(deaSeurat),
                                     pattern = "cluster",
                                     replacement = "clusters")
  colnames(deaSeurat) <- str_replace(colnames(deaSeurat),
                                     pattern = "gene",
                                     replacement = "genes")

  deaSeurat$data_set <- subset.datasets_csv[ind,1]
  deaSeurat$set_number <- ind
  deaSeurat_tot <- rbind(deaSeurat_tot, deaSeurat)


  }
 deaSeurat_tot <-  deaSeurat_tot[2:nrow(deaSeurat_tot),]

 deaSeurat_tot <- merge.data.frame(deaSeurat_tot,
                                   ground_truth_tot,
                                   by = c("genes","clusters","data_set","set_number"),
                                   all.x = T,all.y = F)

# Convert TRUE/FALSE to 1/0
deaSeurat_tot$value <- as.numeric(deaSeurat_tot$value)

# Compute the ROC curve - note that we invert the p-values with 1 - p_values
roc_resultSeurat_scTr <- roc(deaSeurat_tot$value, 1 - deaSeurat_tot$p_val)
ROC for Seurat Bimod
deaSeurat_tot <- NA

for (ind in 1:dim(subset.datasets_csv)[1]) {
  #print(ind)
  file.code <- paste0(subset.datasets_csv$Group[ind],"_",subset.datasets_csv$Collection[ind])

  dataset <- readRDS(file = file.path(dataSetDir,paste0(file.code,".RDS")))

  clusterization <- getClusterizationData(dataset, clName = "mergedClusters")[[1]]

  deaSeurat <- read.csv(file.path(dirOut,paste0(file.code,"Seurat_DEA_Bimod_genes.csv")), row.names = 1)

  cl.names <- NA

  for (cl.val in  unique(clusterization)) {
    #print(cl.val)
    cl.name <- str_split(names(clusterization[clusterization == cl.val])[1],
                            pattern = "_",simplify = T)[1]
    cl.names <- c(cl.names,cl.name)
    cl.names <- cl.names[!is.na(cl.names)]

    deaSeurat[deaSeurat$cluster == cl.val,]$cluster <- cl.name

  }

  clusters <- str_split(datasets_csv$Collection[ind],pattern = "_[+]_",simplify = T)

  colnames(deaSeurat) <- str_replace(colnames(deaSeurat),
                                     pattern = "cluster",
                                     replacement = "clusters")
  colnames(deaSeurat) <- str_replace(colnames(deaSeurat),
                                     pattern = "gene",
                                     replacement = "genes")

  deaSeurat$data_set <- subset.datasets_csv[ind,1]
  deaSeurat$set_number <- ind
  deaSeurat_tot <- rbind(deaSeurat_tot, deaSeurat)


  }
 deaSeurat_tot <-  deaSeurat_tot[2:nrow(deaSeurat_tot),]

 deaSeurat_tot <- merge.data.frame(deaSeurat_tot,
                                   ground_truth_tot,
                                   by = c("genes","clusters","data_set","set_number"),
                                   all.x = T,all.y = F)

# Convert TRUE/FALSE to 1/0
deaSeurat_tot$value <- as.numeric(deaSeurat_tot$value)

# Compute the ROC curve - note that we invert the p-values with 1 - p_values
roc_resultSeurat_Bimod <- roc(deaSeurat_tot$value, 1 - deaSeurat_tot$p_val)
ROC for Monocle
deaMonocle_tot <- NA
for (ind in 1:dim(subset.datasets_csv)[1]) {
  file.code <- paste0(subset.datasets_csv$Group[ind],"_",subset.datasets_csv$Collection[ind])
  dataset <- readRDS(file = file.path(dataSetDir,paste0(file.code,".RDS")))

  clusterization <- getClusterizationData(dataset, clName = "mergedClusters")[[1]]
  #print(file.code)

  deaMonocle <- read.csv(file.path(dirOut,paste0(file.code,"Monocle_DEA_genes.csv")),row.names = 1)

  cl.names <- NA

  for (cl.val in  unique(clusterization)) {
    #print(cl.val)
    cl.name <- str_split(names(clusterization[clusterization == cl.val])[1],
                            pattern = "_",simplify = T)[1]
    cl.names <- c(cl.names,cl.name)
    cl.names <- cl.names[!is.na(cl.names)]

    deaMonocle[deaMonocle$cell_group == cl.val,"cell_group"] <- cl.name

  }

  clusters <- str_split(datasets_csv$Collection[ind],pattern = "_[+]_",simplify = T)

  colnames(deaMonocle) <- str_replace(colnames(deaMonocle),
                                     pattern = "cell_group",
                                     replacement = "clusters")
  colnames(deaMonocle) <- str_replace(colnames(deaMonocle),
                                     pattern = "gene_id",
                                     replacement = "genes")

  deaMonocle$data_set <- subset.datasets_csv[ind,1]
  deaMonocle$set_number <- ind
  deaMonocle <- as.data.frame(deaMonocle)
  deaMonocle_tot <- rbind(deaMonocle_tot, deaMonocle)


  }
 deaMonocle_tot <-  deaMonocle_tot[2:nrow(deaMonocle_tot),]

 deaMonocle_tot <- merge.data.frame(deaMonocle_tot,
                                   ground_truth_tot,
                                   by = c("genes","clusters","data_set","set_number"),
                                   all.x = T,all.y = F)

# Convert TRUE/FALSE to 1/0
deaMonocle_tot$value <- as.numeric(deaMonocle_tot$value)

# Compute the ROC curve - note that we invert the p-values with 1 - p_values
roc_resultMonocle <- roc(deaMonocle_tot$value, 1 - deaMonocle_tot$marker_test_p_value)

# Plot the ROC curve
#plot(roc_resultMonocle)
ROC from Scanpy
deaScanpy_tot <- NA
for (ind in 1:dim(subset.datasets_csv)[1]) {
  file.code <- paste0(subset.datasets_csv$Group[ind],"_",subset.datasets_csv$Collection[ind])
  dataset <- readRDS(file = file.path(dataSetDir,paste0(file.code,".RDS")))

  clusterization <- getClusterizationData(dataset, clName = "mergedClusters")[[1]]
  #print(file.code)

  deaScanpy <- read.csv(file.path(dirOut,paste0(file.code,"Scanpy_DEA_genes.csv")),
                        row.names = 1)

  cl.names <- NA

  for (cl.val in  unique(clusterization)) {
    #print(cl.val)
    cl.name <- str_split(names(clusterization[clusterization == cl.val])[1],
                            pattern = "_",simplify = T)[1]
    cl.names <- c(cl.names,cl.name)
    cl.names <- cl.names[!is.na(cl.names)]

    deaScanpy[deaScanpy$clusters == paste0("cl",cl.val),"clusters"] <- cl.name

  }

  clusters <- str_split(datasets_csv$Collection[ind],pattern = "_[+]_",simplify = T)


  deaScanpy$data_set <- subset.datasets_csv[ind,1]
  deaScanpy$set_number <- ind
  deaScanpy_tot <- rbind(deaScanpy_tot, deaScanpy)


  }
 deaScanpy_tot <-  deaScanpy_tot[2:nrow(deaScanpy_tot),]

 deaScanpy_tot <- merge.data.frame(deaScanpy_tot,
                                   ground_truth_tot,
                                   by = c("genes","clusters","data_set","set_number"),
                                   all.x = T,all.y = F)

# Convert TRUE/FALSE to 1/0
deaScanpy_tot$value <- as.numeric(deaScanpy_tot$value)

# Compute the ROC curve - note that we invert the p-values with 1 - p_values
roc_resultScanpy <- roc(deaScanpy_tot$value, 1 - deaScanpy_tot$pval)

# Plot the ROC curve
#plot(roc_resultScanpy)
Summary ROC for all methods
Two_Clusters_uneven_medium <- ggroc(list(COTAN=roc_resultCOTAN,
                                    Seurat=roc_resultSeurat,
                 Seurat_scTr = roc_resultSeurat_scTr,
                 Seurat_Bimod = roc_resultSeurat_Bimod,
                 Monocle=roc_resultMonocle,
                 Scanpy=roc_resultScanpy),
                 aes = c("colour"),
            legacy.axes = T,
            linewidth = 1)+theme_light()+
  scale_colour_manual("",
                      values = methods.color)

Two_Clusters_uneven_mediumPL <- Two_Clusters_uneven_medium + xlab("FPR") + ylab("TPR")

Two_Clusters_uneven_mediumPL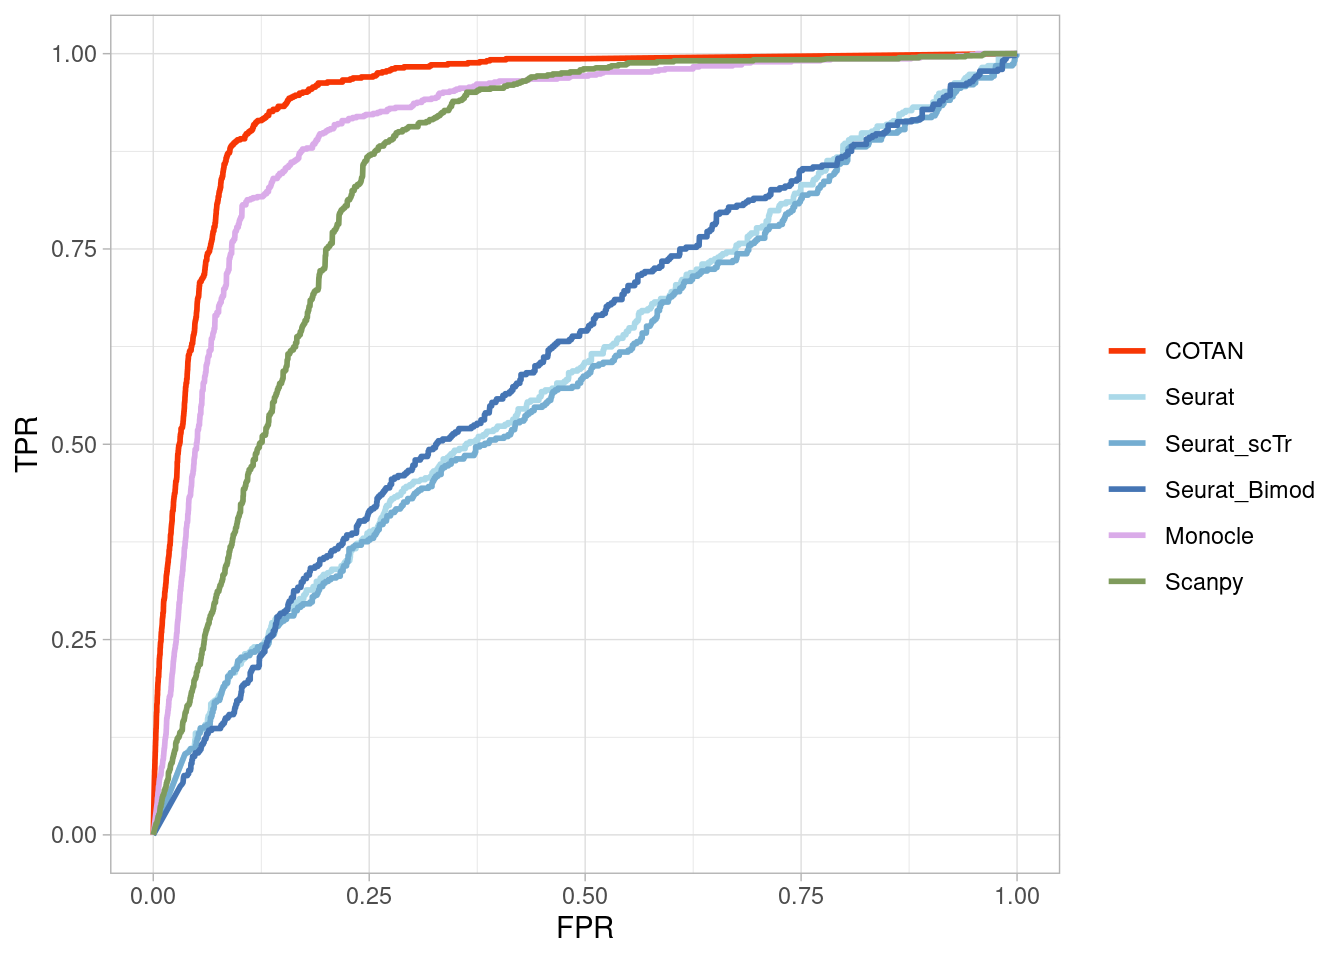
2_Clusters_uneven_far
True vector
subset.datasets_csv <-datasets_csv[datasets_csv$Group == "2_Clusters_uneven_far",]

ground_truth_tot <- NA

for (ind in 1:dim(subset.datasets_csv)[1]) {
  clusters <- str_split(subset.datasets_csv$Collection[ind],pattern = "_[+]_",simplify = T)

  file.presence.subset <- file.presence[,clusters]


  #file.presence.subset <- as.matrix(file.presence.subset)


  ground_truth <- as.data.frame(matrix(nrow = nrow(file.presence.subset),
                                       ncol = ncol(file.presence.subset)))
  rownames(ground_truth) <- rownames(file.presence.subset)
  colnames(ground_truth) <- colnames(file.presence.subset)

  ground_truth[file.presence.subset == "Absent"] <- 0
  ground_truth[file.presence.subset == "Present"] <- 1
  ground_truth[file.presence.subset == "Uncertain"] <- 0.6

  file.presence.subset <- ground_truth

  for (col in 1:ncol(ground_truth)) {
    ground_truth[,col] <- FALSE
    ground_truth[file.presence.subset[,col] == 1 & rowMeans(file.presence.subset[,-col,drop = FALSE]) < 0.35  ,col] <- TRUE
    }

  ground_truth$genes <- rownames(ground_truth)
  ground_truth <- pivot_longer(ground_truth,
                               cols = 1:(ncol(ground_truth)-1),
                               names_to = "clusters")
  ground_truth$data_set <- subset.datasets_csv[ind,1]
  ground_truth$set_number <- ind
  ground_truth_tot <- rbind(ground_truth_tot, ground_truth)

}
ground_truth_tot <- ground_truth_tot[2:nrow(ground_truth_tot),]

head(ground_truth_tot)
# A tibble: 6 × 5
genes clusters value data_set set_number
<chr> <chr> <lgl> <chr> <int>
1 Neil2 E17.5-516 FALSE 2_Clusters_uneven_far 1
2 Neil2 E13.5-187 FALSE 2_Clusters_uneven_far 1
3 Lamc1 E17.5-516 FALSE 2_Clusters_uneven_far 1
4 Lamc1 E13.5-187 FALSE 2_Clusters_uneven_far 1
5 Lama1 E17.5-516 FALSE 2_Clusters_uneven_far 1
6 Lama1 E13.5-187 TRUE 2_Clusters_uneven_far 1length(unique(ground_truth_tot$genes)) [1] 14695sum(ground_truth_tot$value)[1] 2325ROC for COTAN
onlyPositive.pVal.Cotan_tot <- NA

for (ind in 1:dim(subset.datasets_csv)[1]) {
  #print(ind)
  file.code <- paste0(subset.datasets_csv$Group[ind],"_",
                      subset.datasets_csv$Collection[ind])
  dataset <- readRDS(file = file.path(dataSetDir,paste0(file.code,".RDS")))
  deaCOTAN <- getClusterizationData(dataset,clName = "mergedClusters")[[2]]
  pvalCOTAN <- pValueFromDEA(deaCOTAN,
              numCells = getNumCells(dataset),adjustmentMethod ="none")

  clusterization <- getClusterizationData(dataset, clName = "mergedClusters")[[1]]
  cl.names <- NA

  for (cl.val in  unique(clusterization)) {
    #print(cl.val)
    cl.names <- c(cl.names,
                  str_split(names(clusterization[clusterization == cl.val])[1],
                            pattern = "_",simplify = T)[1])
    cl.names <- cl.names[!is.na(cl.names)]
  }
  colnames(deaCOTAN) <- cl.names
  colnames(pvalCOTAN) <- cl.names

  clusters <- str_split(datasets_csv$Collection[ind],pattern = "_[+]_",simplify = T)

  onlyPositive.pVal.Cotan <- pvalCOTAN

    for (cl in cl.names) {
    print(cl)
    #temp.DEA.CotanSign <- deaCOTAN[rownames(pvalCOTAN[pvalCOTAN[,cl] < 0.05,]) ,]
    onlyPositive.pVal.Cotan[rownames(deaCOTAN[deaCOTAN[,cl] < 0,]),cl] <-  1 #onlyPositive.pVal.Cotan[rownames(deaCOTAN[deaCOTAN[,cl] < 0,]),cl]+1
    }

    onlyPositive.pVal.Cotan$genes <- rownames(onlyPositive.pVal.Cotan)
    onlyPositive.pVal.Cotan <- pivot_longer(onlyPositive.pVal.Cotan,
                                            values_to = "p_values",
                               cols = 1:(ncol(onlyPositive.pVal.Cotan)-1),
                               names_to = "clusters")
  onlyPositive.pVal.Cotan$data_set <- subset.datasets_csv[ind,1]
  onlyPositive.pVal.Cotan$set_number <- ind
  onlyPositive.pVal.Cotan_tot <- rbind(onlyPositive.pVal.Cotan_tot, onlyPositive.pVal.Cotan)

  }
[1] "E13.5-187"
[1] "E17.5-516"
[1] "E15.0-510"
[1] "E13.5-437"
[1] "E15.0-509"
[1] "E13.5-184"onlyPositive.pVal.Cotan_tot <- onlyPositive.pVal.Cotan_tot[2:nrow(onlyPositive.pVal.Cotan_tot),]
onlyPositive.pVal.Cotan_tot <- merge.data.frame(onlyPositive.pVal.Cotan_tot,
ground_truth_tot,by = c("genes","clusters","data_set","set_number"),all.x = T,all.y = F)
#onlyPositive.pVal.Cotan_tot <- onlyPositive.pVal.Cotan_tot[order(onlyPositive.pVal.Cotan_tot$p_values,
# decreasing = F),]
# df <- as.data.frame(matrix(nrow = nrow(onlyPositive.pVal.Cotan_tot),ncol = 3))
# colnames(df) <- c("TPR","FPR","Method")
# df$Method <- "COTAN"
#
# Positive <- sum(onlyPositive.pVal.Cotan_tot$value)
# Negative <- sum(!onlyPositive.pVal.Cotan_tot$value)
#
# for (i in 1:nrow(onlyPositive.pVal.Cotan_tot)) {
# df[i,"TPR"] <- sum(onlyPositive.pVal.Cotan_tot[1:i,"value"])/Positive
# df[i,"FPR"] <- (i-sum(onlyPositive.pVal.Cotan_tot[1:i,"value"]))/Negative
# Convert TRUE/FALSE to 1/0
onlyPositive.pVal.Cotan_tot$value <- as.numeric(onlyPositive.pVal.Cotan_tot$value)
# Compute the ROC curve - note that we invert the p-values with 1 - p_values
roc_resultCOTAN <- roc(onlyPositive.pVal.Cotan_tot$value, 1 - onlyPositive.pVal.Cotan_tot$p_values)
# Plot the ROC curve
#plot(roc_resultCOTAN)ROC for Seurat
deaSeurat_tot <- NA

for (ind in 1:dim(subset.datasets_csv)[1]) {
  #print(ind)
  file.code <- paste0(subset.datasets_csv$Group[ind],"_",subset.datasets_csv$Collection[ind])

  dataset <- readRDS(file = file.path(dataSetDir,paste0(file.code,".RDS")))

  clusterization <- getClusterizationData(dataset, clName = "mergedClusters")[[1]]

  deaSeurat <- read.csv(file.path(dirOut,paste0(file.code,"Seurat_DEA_genes.csv")), row.names = 1)

  cl.names <- NA

  for (cl.val in  unique(clusterization)) {
    #print(cl.val)
    cl.name <- str_split(names(clusterization[clusterization == cl.val])[1],
                            pattern = "_",simplify = T)[1]
    cl.names <- c(cl.names,cl.name)
    cl.names <- cl.names[!is.na(cl.names)]

    deaSeurat[deaSeurat$cluster == cl.val,]$cluster <- cl.name

  }

  clusters <- str_split(datasets_csv$Collection[ind],pattern = "_[+]_",simplify = T)

  colnames(deaSeurat) <- str_replace(colnames(deaSeurat),
                                     pattern = "cluster",
                                     replacement = "clusters")
  colnames(deaSeurat) <- str_replace(colnames(deaSeurat),
                                     pattern = "gene",
                                     replacement = "genes")

  deaSeurat$data_set <- subset.datasets_csv[ind,1]
  deaSeurat$set_number <- ind
  deaSeurat_tot <- rbind(deaSeurat_tot, deaSeurat)


  }
 deaSeurat_tot <-  deaSeurat_tot[2:nrow(deaSeurat_tot),]

 deaSeurat_tot <- merge.data.frame(deaSeurat_tot,
                                   ground_truth_tot,
                                   by = c("genes","clusters","data_set","set_number"),
                                   all.x = T,all.y = F)

# Convert TRUE/FALSE to 1/0
deaSeurat_tot$value <- as.numeric(deaSeurat_tot$value)

# Compute the ROC curve - note that we invert the p-values with 1 - p_values
roc_resultSeurat <- roc(deaSeurat_tot$value, 1 - deaSeurat_tot$p_val)

# Plot the ROC curve
#plot(roc_resultSeurat)
ROC for Seurat scTransform
deaSeurat_tot <- NA

for (ind in 1:dim(subset.datasets_csv)[1]) {
  #print(ind)
  file.code <- paste0(subset.datasets_csv$Group[ind],"_",subset.datasets_csv$Collection[ind])

  dataset <- readRDS(file = file.path(dataSetDir,paste0(file.code,".RDS")))

  clusterization <- getClusterizationData(dataset, clName = "mergedClusters")[[1]]

  deaSeurat <- read.csv(file.path(dirOut,paste0(file.code,"Seurat_DEA_ScTransform_genes.csv")), row.names = 1)

  cl.names <- NA

  for (cl.val in  unique(clusterization)) {
    #print(cl.val)
    cl.name <- str_split(names(clusterization[clusterization == cl.val])[1],
                            pattern = "_",simplify = T)[1]
    cl.names <- c(cl.names,cl.name)
    cl.names <- cl.names[!is.na(cl.names)]

    deaSeurat[deaSeurat$cluster == cl.val,]$cluster <- cl.name

  }

  clusters <- str_split(datasets_csv$Collection[ind],pattern = "_[+]_",simplify = T)

  colnames(deaSeurat) <- str_replace(colnames(deaSeurat),
                                     pattern = "cluster",
                                     replacement = "clusters")
  colnames(deaSeurat) <- str_replace(colnames(deaSeurat),
                                     pattern = "gene",
                                     replacement = "genes")

  deaSeurat$data_set <- subset.datasets_csv[ind,1]
  deaSeurat$set_number <- ind
  deaSeurat_tot <- rbind(deaSeurat_tot, deaSeurat)


  }
 deaSeurat_tot <-  deaSeurat_tot[2:nrow(deaSeurat_tot),]

 deaSeurat_tot <- merge.data.frame(deaSeurat_tot,
                                   ground_truth_tot,
                                   by = c("genes","clusters","data_set","set_number"),
                                   all.x = T,all.y = F)

# Convert TRUE/FALSE to 1/0
deaSeurat_tot$value <- as.numeric(deaSeurat_tot$value)

# Compute the ROC curve - note that we invert the p-values with 1 - p_values
roc_resultSeurat_scTr <- roc(deaSeurat_tot$value, 1 - deaSeurat_tot$p_val)
ROC for Seurat Bimod
deaSeurat_tot <- NA

for (ind in 1:dim(subset.datasets_csv)[1]) {
  #print(ind)
  file.code <- paste0(subset.datasets_csv$Group[ind],"_",subset.datasets_csv$Collection[ind])

  dataset <- readRDS(file = file.path(dataSetDir,paste0(file.code,".RDS")))

  clusterization <- getClusterizationData(dataset, clName = "mergedClusters")[[1]]

  deaSeurat <- read.csv(file.path(dirOut,paste0(file.code,"Seurat_DEA_Bimod_genes.csv")), row.names = 1)

  cl.names <- NA

  for (cl.val in  unique(clusterization)) {
    #print(cl.val)
    cl.name <- str_split(names(clusterization[clusterization == cl.val])[1],
                            pattern = "_",simplify = T)[1]
    cl.names <- c(cl.names,cl.name)
    cl.names <- cl.names[!is.na(cl.names)]

    deaSeurat[deaSeurat$cluster == cl.val,]$cluster <- cl.name

  }

  clusters <- str_split(datasets_csv$Collection[ind],pattern = "_[+]_",simplify = T)

  colnames(deaSeurat) <- str_replace(colnames(deaSeurat),
                                     pattern = "cluster",
                                     replacement = "clusters")
  colnames(deaSeurat) <- str_replace(colnames(deaSeurat),
                                     pattern = "gene",
                                     replacement = "genes")

  deaSeurat$data_set <- subset.datasets_csv[ind,1]
  deaSeurat$set_number <- ind
  deaSeurat_tot <- rbind(deaSeurat_tot, deaSeurat)


  }
 deaSeurat_tot <-  deaSeurat_tot[2:nrow(deaSeurat_tot),]

 deaSeurat_tot <- merge.data.frame(deaSeurat_tot,
                                   ground_truth_tot,
                                   by = c("genes","clusters","data_set","set_number"),
                                   all.x = T,all.y = F)

# Convert TRUE/FALSE to 1/0
deaSeurat_tot$value <- as.numeric(deaSeurat_tot$value)

# Compute the ROC curve - note that we invert the p-values with 1 - p_values
roc_resultSeurat_Bimod <- roc(deaSeurat_tot$value, 1 - deaSeurat_tot$p_val)
ROC for Monocle
deaMonocle_tot <- NA
for (ind in 1:dim(subset.datasets_csv)[1]) {
  file.code <- paste0(subset.datasets_csv$Group[ind],"_",subset.datasets_csv$Collection[ind])
  dataset <- readRDS(file = file.path(dataSetDir,paste0(file.code,".RDS")))

  clusterization <- getClusterizationData(dataset, clName = "mergedClusters")[[1]]
  #print(file.code)

  deaMonocle <- read.csv(file.path(dirOut,paste0(file.code,"Monocle_DEA_genes.csv")),row.names = 1)

  cl.names <- NA

  for (cl.val in  unique(clusterization)) {
    #print(cl.val)
    cl.name <- str_split(names(clusterization[clusterization == cl.val])[1],
                            pattern = "_",simplify = T)[1]
    cl.names <- c(cl.names,cl.name)
    cl.names <- cl.names[!is.na(cl.names)]

    deaMonocle[deaMonocle$cell_group == cl.val,"cell_group"] <- cl.name

  }

  clusters <- str_split(datasets_csv$Collection[ind],pattern = "_[+]_",simplify = T)

  colnames(deaMonocle) <- str_replace(colnames(deaMonocle),
                                     pattern = "cell_group",
                                     replacement = "clusters")
  colnames(deaMonocle) <- str_replace(colnames(deaMonocle),
                                     pattern = "gene_id",
                                     replacement = "genes")

  deaMonocle$data_set <- subset.datasets_csv[ind,1]
  deaMonocle$set_number <- ind
  deaMonocle <- as.data.frame(deaMonocle)
  deaMonocle_tot <- rbind(deaMonocle_tot, deaMonocle)


  }
 deaMonocle_tot <-  deaMonocle_tot[2:nrow(deaMonocle_tot),]

 deaMonocle_tot <- merge.data.frame(deaMonocle_tot,
                                   ground_truth_tot,
                                   by = c("genes","clusters","data_set","set_number"),
                                   all.x = T,all.y = F)

# Convert TRUE/FALSE to 1/0
deaMonocle_tot$value <- as.numeric(deaMonocle_tot$value)

# Compute the ROC curve - note that we invert the p-values with 1 - p_values
roc_resultMonocle <- roc(deaMonocle_tot$value, 1 - deaMonocle_tot$marker_test_p_value)

# Plot the ROC curve
#plot(roc_resultMonocle)
ROC from Scanpy
deaScanpy_tot <- NA
for (ind in 1:dim(subset.datasets_csv)[1]) {
  file.code <- paste0(subset.datasets_csv$Group[ind],"_",subset.datasets_csv$Collection[ind])
  dataset <- readRDS(file = file.path(dataSetDir,paste0(file.code,".RDS")))

  clusterization <- getClusterizationData(dataset, clName = "mergedClusters")[[1]]
  #print(file.code)

  deaScanpy <- read.csv(file.path(dirOut,paste0(file.code,"Scanpy_DEA_genes.csv")),
                        row.names = 1)

  cl.names <- NA

  for (cl.val in  unique(clusterization)) {
    #print(cl.val)
    cl.name <- str_split(names(clusterization[clusterization == cl.val])[1],
                            pattern = "_",simplify = T)[1]
    cl.names <- c(cl.names,cl.name)
    cl.names <- cl.names[!is.na(cl.names)]

    deaScanpy[deaScanpy$clusters == paste0("cl",cl.val),"clusters"] <- cl.name

  }

  clusters <- str_split(datasets_csv$Collection[ind],pattern = "_[+]_",simplify = T)


  deaScanpy$data_set <- subset.datasets_csv[ind,1]
  deaScanpy$set_number <- ind
  deaScanpy_tot <- rbind(deaScanpy_tot, deaScanpy)


  }
 deaScanpy_tot <-  deaScanpy_tot[2:nrow(deaScanpy_tot),]

 deaScanpy_tot <- merge.data.frame(deaScanpy_tot,
                                   ground_truth_tot,
                                   by = c("genes","clusters","data_set","set_number"),
                                   all.x = T,all.y = F)

# Convert TRUE/FALSE to 1/0
deaScanpy_tot$value <- as.numeric(deaScanpy_tot$value)

# Compute the ROC curve - note that we invert the p-values with 1 - p_values
roc_resultScanpy <- roc(deaScanpy_tot$value, 1 - deaScanpy_tot$pval)

# Plot the ROC curve
#plot(roc_resultScanpy)
Summary ROC for all methods
Two_Clusters_uneven_far <- ggroc(list(COTAN=roc_resultCOTAN,
                                    Seurat=roc_resultSeurat,
                 Seurat_scTr = roc_resultSeurat_scTr,
                 Seurat_Bimod = roc_resultSeurat_Bimod,
                 Monocle=roc_resultMonocle,
                 Scanpy=roc_resultScanpy),
                 aes = c("colour"),
            legacy.axes = T,
            linewidth = 1)+theme_light()+
  scale_colour_manual("",
                      values = methods.color)

Two_Clusters_uneven_farPL <- Two_Clusters_uneven_far + xlab("FPR") + ylab("TPR")

lg <- get_legend(Two_Clusters_uneven_farPL)

Two_Clusters_uneven_farPL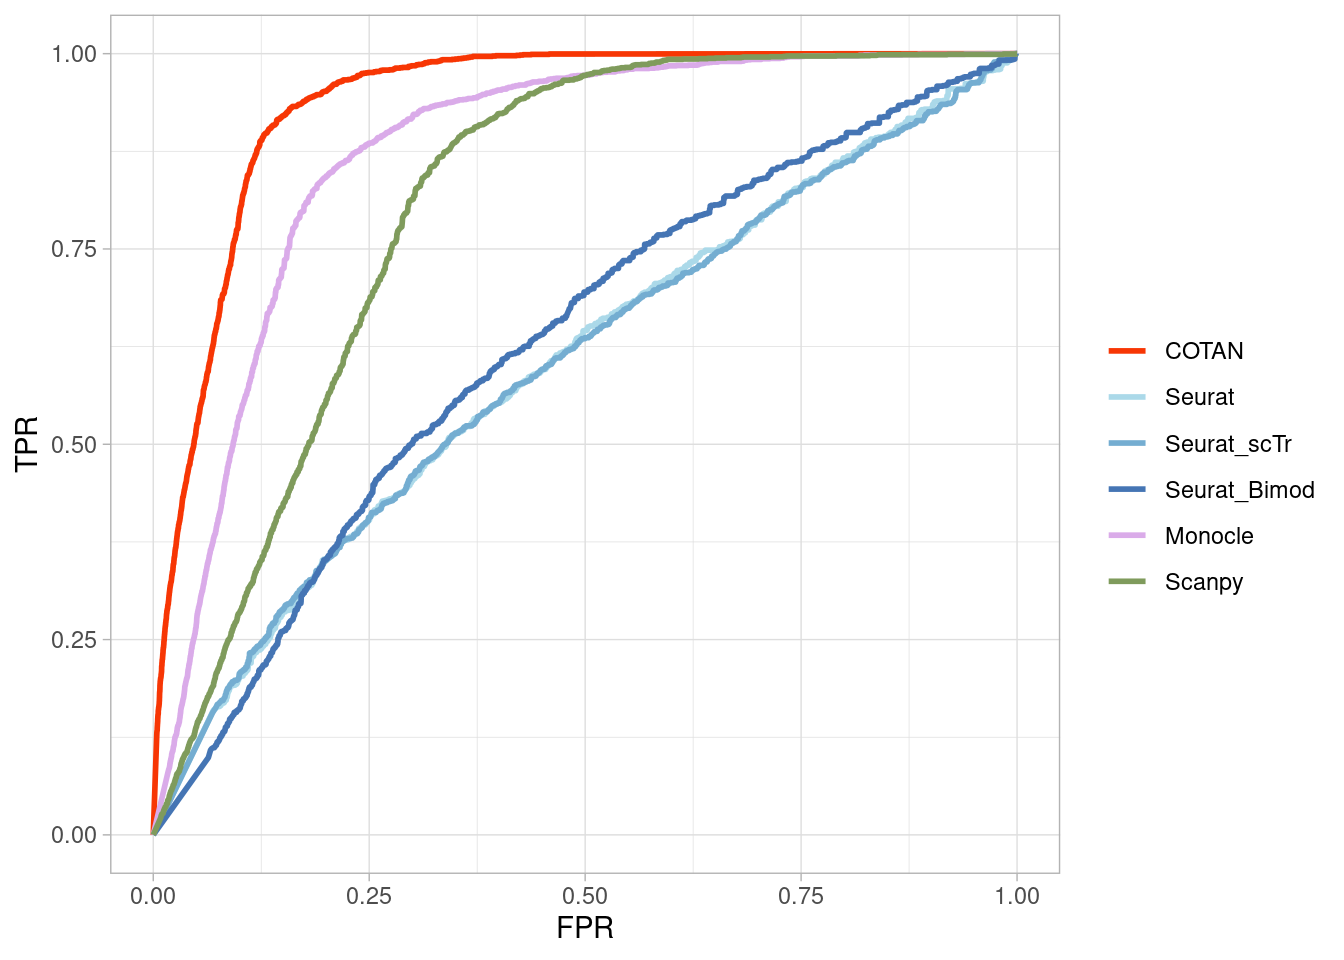
3 clusters
3_Clusters_even
True vector
subset.datasets_csv <-datasets_csv[datasets_csv$Group == "3_Clusters_even",]

ground_truth_tot <- NA

for (ind in 1:dim(subset.datasets_csv)[1]) {
  clusters <- str_split(subset.datasets_csv$Collection[ind],pattern = "_[+]_",simplify = T)

  file.presence.subset <- file.presence[,clusters]


  #file.presence.subset <- as.matrix(file.presence.subset)


  ground_truth <- as.data.frame(matrix(nrow = nrow(file.presence.subset),
                                       ncol = ncol(file.presence.subset)))
  rownames(ground_truth) <- rownames(file.presence.subset)
  colnames(ground_truth) <- colnames(file.presence.subset)

  ground_truth[file.presence.subset == "Absent"] <- 0
  ground_truth[file.presence.subset == "Present"] <- 1
  ground_truth[file.presence.subset == "Uncertain"] <- 0.6

  file.presence.subset <- ground_truth

  for (col in 1:ncol(ground_truth)) {
    ground_truth[,col] <- FALSE
    ground_truth[file.presence.subset[,col] == 1 & rowMeans(file.presence.subset[,-col,drop = FALSE]) < 0.35  ,col] <- TRUE
    }

  ground_truth$genes <- rownames(ground_truth)
  ground_truth <- pivot_longer(ground_truth,
                               cols = 1:(ncol(ground_truth)-1),
                               names_to = "clusters")
  ground_truth$data_set <- subset.datasets_csv[ind,1]
  ground_truth$set_number <- ind
  ground_truth_tot <- rbind(ground_truth_tot, ground_truth)

}
ground_truth_tot <- ground_truth_tot[2:nrow(ground_truth_tot),]

head(ground_truth_tot)
# A tibble: 6 × 5
genes clusters value data_set set_number
<chr> <chr> <lgl> <chr> <int>
1 Neil2 E15.0-437 FALSE 3_Clusters_even 1
2 Neil2 E13.5-510 FALSE 3_Clusters_even 1
3 Neil2 E13.5-437 FALSE 3_Clusters_even 1
4 Lamc1 E15.0-437 FALSE 3_Clusters_even 1
5 Lamc1 E13.5-510 FALSE 3_Clusters_even 1
6 Lamc1 E13.5-437 FALSE 3_Clusters_even 1length(unique(ground_truth_tot$genes)) [1] 14695sum(ground_truth_tot$value)[1] 1288ROC for COTAN
onlyPositive.pVal.Cotan_tot <- NA

for (ind in 1:dim(subset.datasets_csv)[1]) {
  #print(ind)
  file.code <- paste0(subset.datasets_csv$Group[ind],"_",
                      subset.datasets_csv$Collection[ind])
  dataset <- readRDS(file = file.path(dataSetDir,paste0(file.code,".RDS")))
  deaCOTAN <- getClusterizationData(dataset,clName = "mergedClusters")[[2]]
  pvalCOTAN <- pValueFromDEA(deaCOTAN,
              numCells = getNumCells(dataset),adjustmentMethod ="none")

  clusterization <- getClusterizationData(dataset, clName = "mergedClusters")[[1]]
  cl.names <- NA

  for (cl.val in  unique(clusterization)) {
    #print(cl.val)
    cl.names <- c(cl.names,
                  str_split(names(clusterization[clusterization == cl.val])[1],
                            pattern = "_",simplify = T)[1])
    cl.names <- cl.names[!is.na(cl.names)]
  }
  colnames(deaCOTAN) <- cl.names
  colnames(pvalCOTAN) <- cl.names

  clusters <- str_split(datasets_csv$Collection[ind],pattern = "_[+]_",simplify = T)

  onlyPositive.pVal.Cotan <- pvalCOTAN

    for (cl in cl.names) {
    print(cl)
    #temp.DEA.CotanSign <- deaCOTAN[rownames(pvalCOTAN[pvalCOTAN[,cl] < 0.05,]) ,]
    onlyPositive.pVal.Cotan[rownames(deaCOTAN[deaCOTAN[,cl] < 0,]),cl] <-  1 #onlyPositive.pVal.Cotan[rownames(deaCOTAN[deaCOTAN[,cl] < 0,]),cl]+1
    }

    onlyPositive.pVal.Cotan$genes <- rownames(onlyPositive.pVal.Cotan)
    onlyPositive.pVal.Cotan <- pivot_longer(onlyPositive.pVal.Cotan,
                                            values_to = "p_values",
                               cols = 1:(ncol(onlyPositive.pVal.Cotan)-1),
                               names_to = "clusters")
  onlyPositive.pVal.Cotan$data_set <- subset.datasets_csv[ind,1]
  onlyPositive.pVal.Cotan$set_number <- ind
  onlyPositive.pVal.Cotan_tot <- rbind(onlyPositive.pVal.Cotan_tot, onlyPositive.pVal.Cotan)

  }
[1] "E13.5-437"
[1] "E15.0-437"
[1] "E13.5-510"
[1] "E17.5-516"
[1] "E13.5-437"
[1] "E17.5-505"
[1] "E15.0-510"
[1] "E15.0-428"
[1] "E13.5-510"onlyPositive.pVal.Cotan_tot <- onlyPositive.pVal.Cotan_tot[2:nrow(onlyPositive.pVal.Cotan_tot),]
onlyPositive.pVal.Cotan_tot <- merge.data.frame(onlyPositive.pVal.Cotan_tot,
ground_truth_tot,by = c("genes","clusters","data_set","set_number"),all.x = T,all.y = F)
#onlyPositive.pVal.Cotan_tot <- onlyPositive.pVal.Cotan_tot[order(onlyPositive.pVal.Cotan_tot$p_values,
# decreasing = F),]
# df <- as.data.frame(matrix(nrow = nrow(onlyPositive.pVal.Cotan_tot),ncol = 3))
# colnames(df) <- c("TPR","FPR","Method")
# df$Method <- "COTAN"
#
# Positive <- sum(onlyPositive.pVal.Cotan_tot$value)
# Negative <- sum(!onlyPositive.pVal.Cotan_tot$value)
#
# for (i in 1:nrow(onlyPositive.pVal.Cotan_tot)) {
# df[i,"TPR"] <- sum(onlyPositive.pVal.Cotan_tot[1:i,"value"])/Positive
# df[i,"FPR"] <- (i-sum(onlyPositive.pVal.Cotan_tot[1:i,"value"]))/Negative
# Convert TRUE/FALSE to 1/0
onlyPositive.pVal.Cotan_tot$value <- as.numeric(onlyPositive.pVal.Cotan_tot$value)
# Compute the ROC curve - note that we invert the p-values with 1 - p_values
roc_resultCOTAN <- roc(onlyPositive.pVal.Cotan_tot$value, 1 - onlyPositive.pVal.Cotan_tot$p_values)
# Plot the ROC curve
#plot(roc_resultCOTAN)ROC for Seurat
deaSeurat_tot <- NA

for (ind in 1:dim(subset.datasets_csv)[1]) {
  #print(ind)
  file.code <- paste0(subset.datasets_csv$Group[ind],"_",subset.datasets_csv$Collection[ind])

  dataset <- readRDS(file = file.path(dataSetDir,paste0(file.code,".RDS")))

  clusterization <- getClusterizationData(dataset, clName = "mergedClusters")[[1]]

  deaSeurat <- read.csv(file.path(dirOut,paste0(file.code,"Seurat_DEA_genes.csv")), row.names = 1)

  cl.names <- NA

  for (cl.val in  unique(clusterization)) {
    #print(cl.val)
    cl.name <- str_split(names(clusterization[clusterization == cl.val])[1],
                            pattern = "_",simplify = T)[1]
    cl.names <- c(cl.names,cl.name)
    cl.names <- cl.names[!is.na(cl.names)]

    deaSeurat[deaSeurat$cluster == cl.val,]$cluster <- cl.name

  }

  clusters <- str_split(datasets_csv$Collection[ind],pattern = "_[+]_",simplify = T)

  colnames(deaSeurat) <- str_replace(colnames(deaSeurat),
                                     pattern = "cluster",
                                     replacement = "clusters")
  colnames(deaSeurat) <- str_replace(colnames(deaSeurat),
                                     pattern = "gene",
                                     replacement = "genes")

  deaSeurat$data_set <- subset.datasets_csv[ind,1]
  deaSeurat$set_number <- ind
  deaSeurat_tot <- rbind(deaSeurat_tot, deaSeurat)


  }
 deaSeurat_tot <-  deaSeurat_tot[2:nrow(deaSeurat_tot),]

 deaSeurat_tot <- merge.data.frame(deaSeurat_tot,
                                   ground_truth_tot,
                                   by = c("genes","clusters","data_set","set_number"),
                                   all.x = T,all.y = F)

# Convert TRUE/FALSE to 1/0
deaSeurat_tot$value <- as.numeric(deaSeurat_tot$value)

# Compute the ROC curve - note that we invert the p-values with 1 - p_values
roc_resultSeurat <- roc(deaSeurat_tot$value, 1 - deaSeurat_tot$p_val)

# Plot the ROC curve
#plot(roc_resultSeurat)
ROC for Seurat scTransform
deaSeurat_tot <- NA

for (ind in 1:dim(subset.datasets_csv)[1]) {
  #print(ind)
  file.code <- paste0(subset.datasets_csv$Group[ind],"_",subset.datasets_csv$Collection[ind])

  dataset <- readRDS(file = file.path(dataSetDir,paste0(file.code,".RDS")))

  clusterization <- getClusterizationData(dataset, clName = "mergedClusters")[[1]]

  deaSeurat <- read.csv(file.path(dirOut,paste0(file.code,"Seurat_DEA_ScTransform_genes.csv")), row.names = 1)

  cl.names <- NA

  for (cl.val in  unique(clusterization)) {
    #print(cl.val)
    cl.name <- str_split(names(clusterization[clusterization == cl.val])[1],
                            pattern = "_",simplify = T)[1]
    cl.names <- c(cl.names,cl.name)
    cl.names <- cl.names[!is.na(cl.names)]

    deaSeurat[deaSeurat$cluster == cl.val,]$cluster <- cl.name

  }

  clusters <- str_split(datasets_csv$Collection[ind],pattern = "_[+]_",simplify = T)

  colnames(deaSeurat) <- str_replace(colnames(deaSeurat),
                                     pattern = "cluster",
                                     replacement = "clusters")
  colnames(deaSeurat) <- str_replace(colnames(deaSeurat),
                                     pattern = "gene",
                                     replacement = "genes")

  deaSeurat$data_set <- subset.datasets_csv[ind,1]
  deaSeurat$set_number <- ind
  deaSeurat_tot <- rbind(deaSeurat_tot, deaSeurat)


  }
 deaSeurat_tot <-  deaSeurat_tot[2:nrow(deaSeurat_tot),]

 deaSeurat_tot <- merge.data.frame(deaSeurat_tot,
                                   ground_truth_tot,
                                   by = c("genes","clusters","data_set","set_number"),
                                   all.x = T,all.y = F)

# Convert TRUE/FALSE to 1/0
deaSeurat_tot$value <- as.numeric(deaSeurat_tot$value)

# Compute the ROC curve - note that we invert the p-values with 1 - p_values
roc_resultSeurat_scTr <- roc(deaSeurat_tot$value, 1 - deaSeurat_tot$p_val)
ROC for Seurat Bimod
deaSeurat_tot <- NA

for (ind in 1:dim(subset.datasets_csv)[1]) {
  #print(ind)
  file.code <- paste0(subset.datasets_csv$Group[ind],"_",subset.datasets_csv$Collection[ind])

  dataset <- readRDS(file = file.path(dataSetDir,paste0(file.code,".RDS")))

  clusterization <- getClusterizationData(dataset, clName = "mergedClusters")[[1]]

  deaSeurat <- read.csv(file.path(dirOut,paste0(file.code,"Seurat_DEA_Bimod_genes.csv")), row.names = 1)

  cl.names <- NA

  for (cl.val in  unique(clusterization)) {
    #print(cl.val)
    cl.name <- str_split(names(clusterization[clusterization == cl.val])[1],
                            pattern = "_",simplify = T)[1]
    cl.names <- c(cl.names,cl.name)
    cl.names <- cl.names[!is.na(cl.names)]

    deaSeurat[deaSeurat$cluster == cl.val,]$cluster <- cl.name

  }

  clusters <- str_split(datasets_csv$Collection[ind],pattern = "_[+]_",simplify = T)

  colnames(deaSeurat) <- str_replace(colnames(deaSeurat),
                                     pattern = "cluster",
                                     replacement = "clusters")
  colnames(deaSeurat) <- str_replace(colnames(deaSeurat),
                                     pattern = "gene",
                                     replacement = "genes")

  deaSeurat$data_set <- subset.datasets_csv[ind,1]
  deaSeurat$set_number <- ind
  deaSeurat_tot <- rbind(deaSeurat_tot, deaSeurat)


  }
 deaSeurat_tot <-  deaSeurat_tot[2:nrow(deaSeurat_tot),]

 deaSeurat_tot <- merge.data.frame(deaSeurat_tot,
                                   ground_truth_tot,
                                   by = c("genes","clusters","data_set","set_number"),
                                   all.x = T,all.y = F)

# Convert TRUE/FALSE to 1/0
deaSeurat_tot$value <- as.numeric(deaSeurat_tot$value)

# Compute the ROC curve - note that we invert the p-values with 1 - p_values
roc_resultSeurat_Bimod <- roc(deaSeurat_tot$value, 1 - deaSeurat_tot$p_val)
ROC for Monocle
deaMonocle_tot <- NA
for (ind in 1:dim(subset.datasets_csv)[1]) {
  file.code <- paste0(subset.datasets_csv$Group[ind],"_",subset.datasets_csv$Collection[ind])
  dataset <- readRDS(file = file.path(dataSetDir,paste0(file.code,".RDS")))

  clusterization <- getClusterizationData(dataset, clName = "mergedClusters")[[1]]
  #print(file.code)

  deaMonocle <- read.csv(file.path(dirOut,paste0(file.code,"Monocle_DEA_genes.csv")),row.names = 1)

  cl.names <- NA

  for (cl.val in  unique(clusterization)) {
    #print(cl.val)
    cl.name <- str_split(names(clusterization[clusterization == cl.val])[1],
                            pattern = "_",simplify = T)[1]
    cl.names <- c(cl.names,cl.name)
    cl.names <- cl.names[!is.na(cl.names)]

    deaMonocle[deaMonocle$cell_group == cl.val,"cell_group"] <- cl.name

  }

  clusters <- str_split(datasets_csv$Collection[ind],pattern = "_[+]_",simplify = T)

  colnames(deaMonocle) <- str_replace(colnames(deaMonocle),
                                     pattern = "cell_group",
                                     replacement = "clusters")
  colnames(deaMonocle) <- str_replace(colnames(deaMonocle),
                                     pattern = "gene_id",
                                     replacement = "genes")

  deaMonocle$data_set <- subset.datasets_csv[ind,1]
  deaMonocle$set_number <- ind
  deaMonocle <- as.data.frame(deaMonocle)
  deaMonocle_tot <- rbind(deaMonocle_tot, deaMonocle)


  }
 deaMonocle_tot <-  deaMonocle_tot[2:nrow(deaMonocle_tot),]

 deaMonocle_tot <- merge.data.frame(deaMonocle_tot,
                                   ground_truth_tot,
                                   by = c("genes","clusters","data_set","set_number"),
                                   all.x = T,all.y = F)

# Convert TRUE/FALSE to 1/0
deaMonocle_tot$value <- as.numeric(deaMonocle_tot$value)

# Compute the ROC curve - note that we invert the p-values with 1 - p_values
roc_resultMonocle <- roc(deaMonocle_tot$value, 1 - deaMonocle_tot$marker_test_p_value)

# Plot the ROC curve
#plot(roc_resultMonocle)
ROC from Scanpy
deaScanpy_tot <- NA
for (ind in 1:dim(subset.datasets_csv)[1]) {
  file.code <- paste0(subset.datasets_csv$Group[ind],"_",subset.datasets_csv$Collection[ind])
  dataset <- readRDS(file = file.path(dataSetDir,paste0(file.code,".RDS")))

  clusterization <- getClusterizationData(dataset, clName = "mergedClusters")[[1]]
  #print(file.code)

  deaScanpy <- read.csv(file.path(dirOut,paste0(file.code,"Scanpy_DEA_genes.csv")),
                        row.names = 1)

  cl.names <- NA

  for (cl.val in  unique(clusterization)) {
    #print(cl.val)
    cl.name <- str_split(names(clusterization[clusterization == cl.val])[1],
                            pattern = "_",simplify = T)[1]
    cl.names <- c(cl.names,cl.name)
    cl.names <- cl.names[!is.na(cl.names)]

    deaScanpy[deaScanpy$clusters == paste0("cl",cl.val),"clusters"] <- cl.name

  }

  clusters <- str_split(datasets_csv$Collection[ind],pattern = "_[+]_",simplify = T)


  deaScanpy$data_set <- subset.datasets_csv[ind,1]
  deaScanpy$set_number <- ind
  deaScanpy_tot <- rbind(deaScanpy_tot, deaScanpy)


  }
 deaScanpy_tot <-  deaScanpy_tot[2:nrow(deaScanpy_tot),]

 deaScanpy_tot <- merge.data.frame(deaScanpy_tot,
                                   ground_truth_tot,
                                   by = c("genes","clusters","data_set","set_number"),
                                   all.x = T,all.y = F)

# Convert TRUE/FALSE to 1/0
deaScanpy_tot$value <- as.numeric(deaScanpy_tot$value)

# Compute the ROC curve - note that we invert the p-values with 1 - p_values
roc_resultScanpy <- roc(deaScanpy_tot$value, 1 - deaScanpy_tot$pval)

# Plot the ROC curve
#plot(roc_resultScanpy)
Summary ROC for all methods
Three_Clusters_even <- ggroc(list(COTAN=roc_resultCOTAN,
                                    Seurat=roc_resultSeurat,
                 Seurat_scTr = roc_resultSeurat_scTr,
                 Seurat_Bimod = roc_resultSeurat_Bimod,
                 Monocle=roc_resultMonocle,
                 Scanpy=roc_resultScanpy),
                 aes = c("colour"),
            legacy.axes = T,
            linewidth = 1)+theme_light()+
  scale_colour_manual("",
                      values = methods.color)

Three_Clusters_evenPL <- Three_Clusters_even +
  xlab("FPR") + ylab("TPR")+theme(legend.position="none")
Three_Clusters_even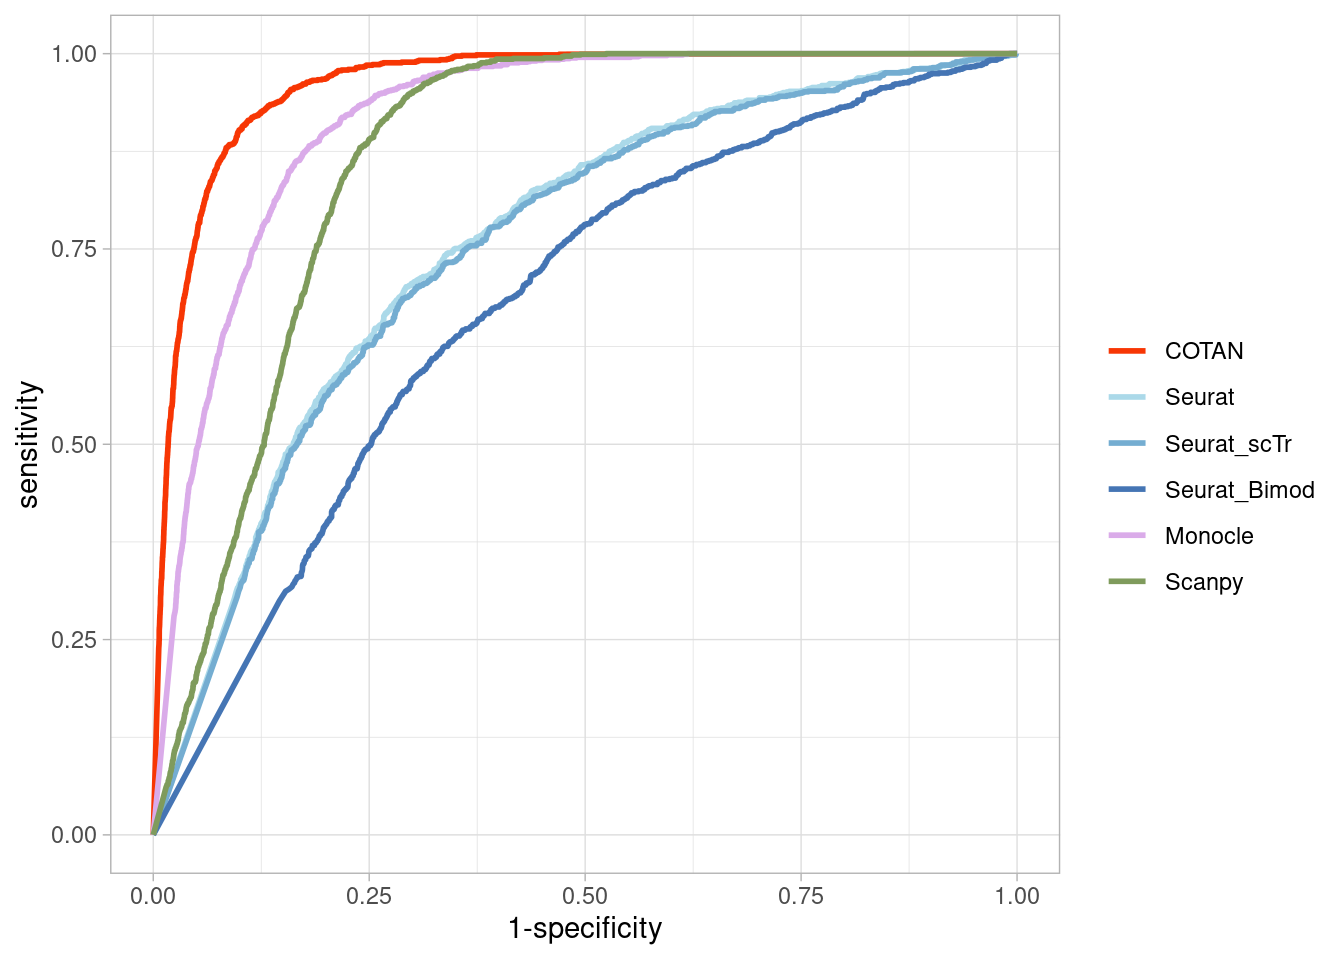
3_Clusters_uneven
True vector
subset.datasets_csv <-datasets_csv[datasets_csv$Group == "3_Clusters_uneven",]

ground_truth_tot <- NA

for (ind in 1:dim(subset.datasets_csv)[1]) {
  clusters <- str_split(subset.datasets_csv$Collection[ind],pattern = "_[+]_",simplify = T)

  file.presence.subset <- file.presence[,clusters]


  #file.presence.subset <- as.matrix(file.presence.subset)


  ground_truth <- as.data.frame(matrix(nrow = nrow(file.presence.subset),
                                       ncol = ncol(file.presence.subset)))
  rownames(ground_truth) <- rownames(file.presence.subset)
  colnames(ground_truth) <- colnames(file.presence.subset)

  ground_truth[file.presence.subset == "Absent"] <- 0
  ground_truth[file.presence.subset == "Present"] <- 1
  ground_truth[file.presence.subset == "Uncertain"] <- 0.6

  file.presence.subset <- ground_truth

  for (col in 1:ncol(ground_truth)) {
    ground_truth[,col] <- FALSE
    ground_truth[file.presence.subset[,col] == 1 & rowMeans(file.presence.subset[,-col,drop = FALSE]) < 0.35  ,col] <- TRUE
    }

  ground_truth$genes <- rownames(ground_truth)
  ground_truth <- pivot_longer(ground_truth,
                               cols = 1:(ncol(ground_truth)-1),
                               names_to = "clusters")
  ground_truth$data_set <- subset.datasets_csv[ind,1]
  ground_truth$set_number <- ind
  ground_truth_tot <- rbind(ground_truth_tot, ground_truth)

}
ground_truth_tot <- ground_truth_tot[2:nrow(ground_truth_tot),]

head(ground_truth_tot)
# A tibble: 6 × 5
genes clusters value data_set set_number
<chr> <chr> <lgl> <chr> <int>
1 Neil2 E15.0-428 FALSE 3_Clusters_uneven 1
2 Neil2 E13.5-434 FALSE 3_Clusters_uneven 1
3 Neil2 E15.0-510 FALSE 3_Clusters_uneven 1
4 Lamc1 E15.0-428 FALSE 3_Clusters_uneven 1
5 Lamc1 E13.5-434 FALSE 3_Clusters_uneven 1
6 Lamc1 E15.0-510 FALSE 3_Clusters_uneven 1length(unique(ground_truth_tot$genes)) [1] 14695sum(ground_truth_tot$value)[1] 1804ROC for COTAN
onlyPositive.pVal.Cotan_tot <- NA

for (ind in 1:dim(subset.datasets_csv)[1]) {
  #print(ind)
  file.code <- paste0(subset.datasets_csv$Group[ind],"_",
                      subset.datasets_csv$Collection[ind])
  dataset <- readRDS(file = file.path(dataSetDir,paste0(file.code,".RDS")))
  deaCOTAN <- getClusterizationData(dataset,clName = "mergedClusters")[[2]]
  pvalCOTAN <- pValueFromDEA(deaCOTAN,
              numCells = getNumCells(dataset),adjustmentMethod ="none")

  clusterization <- getClusterizationData(dataset, clName = "mergedClusters")[[1]]
  cl.names <- NA

  for (cl.val in  unique(clusterization)) {
    #print(cl.val)
    cl.names <- c(cl.names,
                  str_split(names(clusterization[clusterization == cl.val])[1],
                            pattern = "_",simplify = T)[1])
    cl.names <- cl.names[!is.na(cl.names)]
  }
  colnames(deaCOTAN) <- cl.names
  colnames(pvalCOTAN) <- cl.names

  clusters <- str_split(datasets_csv$Collection[ind],pattern = "_[+]_",simplify = T)

  onlyPositive.pVal.Cotan <- pvalCOTAN

    for (cl in cl.names) {
    print(cl)
    #temp.DEA.CotanSign <- deaCOTAN[rownames(pvalCOTAN[pvalCOTAN[,cl] < 0.05,]) ,]
    onlyPositive.pVal.Cotan[rownames(deaCOTAN[deaCOTAN[,cl] < 0,]),cl] <-  1 #onlyPositive.pVal.Cotan[rownames(deaCOTAN[deaCOTAN[,cl] < 0,]),cl]+1
    }

    onlyPositive.pVal.Cotan$genes <- rownames(onlyPositive.pVal.Cotan)
    onlyPositive.pVal.Cotan <- pivot_longer(onlyPositive.pVal.Cotan,
                                            values_to = "p_values",
                               cols = 1:(ncol(onlyPositive.pVal.Cotan)-1),
                               names_to = "clusters")
  onlyPositive.pVal.Cotan$data_set <- subset.datasets_csv[ind,1]
  onlyPositive.pVal.Cotan$set_number <- ind
  onlyPositive.pVal.Cotan_tot <- rbind(onlyPositive.pVal.Cotan_tot, onlyPositive.pVal.Cotan)

  }
[1] "E15.0-510"
[1] "E13.5-434"
[1] "E15.0-428"
[1] "E15.0-432"
[1] "E13.5-432"
[1] "E13.5-187"
[1] "E15.0-509"
[1] "E15.0-508"
[1] "E13.5-184"onlyPositive.pVal.Cotan_tot <- onlyPositive.pVal.Cotan_tot[2:nrow(onlyPositive.pVal.Cotan_tot),]
onlyPositive.pVal.Cotan_tot <- merge.data.frame(onlyPositive.pVal.Cotan_tot,
ground_truth_tot,by = c("genes","clusters","data_set","set_number"),all.x = T,all.y = F)
#onlyPositive.pVal.Cotan_tot <- onlyPositive.pVal.Cotan_tot[order(onlyPositive.pVal.Cotan_tot$p_values,
# decreasing = F),]
# df <- as.data.frame(matrix(nrow = nrow(onlyPositive.pVal.Cotan_tot),ncol = 3))
# colnames(df) <- c("TPR","FPR","Method")
# df$Method <- "COTAN"
#
# Positive <- sum(onlyPositive.pVal.Cotan_tot$value)
# Negative <- sum(!onlyPositive.pVal.Cotan_tot$value)
#
# for (i in 1:nrow(onlyPositive.pVal.Cotan_tot)) {
# df[i,"TPR"] <- sum(onlyPositive.pVal.Cotan_tot[1:i,"value"])/Positive
# df[i,"FPR"] <- (i-sum(onlyPositive.pVal.Cotan_tot[1:i,"value"]))/Negative
# Convert TRUE/FALSE to 1/0
onlyPositive.pVal.Cotan_tot$value <- as.numeric(onlyPositive.pVal.Cotan_tot$value)
# Compute the ROC curve - note that we invert the p-values with 1 - p_values
roc_resultCOTAN <- roc(onlyPositive.pVal.Cotan_tot$value, 1 - onlyPositive.pVal.Cotan_tot$p_values)
# Plot the ROC curve
#plot(roc_resultCOTAN)ROC for Seurat
deaSeurat_tot <- NA

for (ind in 1:dim(subset.datasets_csv)[1]) {
  #print(ind)
  file.code <- paste0(subset.datasets_csv$Group[ind],"_",subset.datasets_csv$Collection[ind])

  dataset <- readRDS(file = file.path(dataSetDir,paste0(file.code,".RDS")))

  clusterization <- getClusterizationData(dataset, clName = "mergedClusters")[[1]]

  deaSeurat <- read.csv(file.path(dirOut,paste0(file.code,"Seurat_DEA_genes.csv")), row.names = 1)

  cl.names <- NA

  for (cl.val in  unique(clusterization)) {
    #print(cl.val)
    cl.name <- str_split(names(clusterization[clusterization == cl.val])[1],
                            pattern = "_",simplify = T)[1]
    cl.names <- c(cl.names,cl.name)
    cl.names <- cl.names[!is.na(cl.names)]

    deaSeurat[deaSeurat$cluster == cl.val,]$cluster <- cl.name

  }

  clusters <- str_split(datasets_csv$Collection[ind],pattern = "_[+]_",simplify = T)

  colnames(deaSeurat) <- str_replace(colnames(deaSeurat),
                                     pattern = "cluster",
                                     replacement = "clusters")
  colnames(deaSeurat) <- str_replace(colnames(deaSeurat),
                                     pattern = "gene",
                                     replacement = "genes")

  deaSeurat$data_set <- subset.datasets_csv[ind,1]
  deaSeurat$set_number <- ind
  deaSeurat_tot <- rbind(deaSeurat_tot, deaSeurat)


  }
 deaSeurat_tot <-  deaSeurat_tot[2:nrow(deaSeurat_tot),]

 deaSeurat_tot <- merge.data.frame(deaSeurat_tot,
                                   ground_truth_tot,
                                   by = c("genes","clusters","data_set","set_number"),
                                   all.x = T,all.y = F)

# Convert TRUE/FALSE to 1/0
deaSeurat_tot$value <- as.numeric(deaSeurat_tot$value)

# Compute the ROC curve - note that we invert the p-values with 1 - p_values
roc_resultSeurat <- roc(deaSeurat_tot$value, 1 - deaSeurat_tot$p_val)

# Plot the ROC curve
#plot(roc_resultSeurat)
ROC for Seurat scTransform
deaSeurat_tot <- NA

for (ind in 1:dim(subset.datasets_csv)[1]) {
  #print(ind)
  file.code <- paste0(subset.datasets_csv$Group[ind],"_",subset.datasets_csv$Collection[ind])

  dataset <- readRDS(file = file.path(dataSetDir,paste0(file.code,".RDS")))

  clusterization <- getClusterizationData(dataset, clName = "mergedClusters")[[1]]

  deaSeurat <- read.csv(file.path(dirOut,paste0(file.code,"Seurat_DEA_ScTransform_genes.csv")), row.names = 1)

  cl.names <- NA

  for (cl.val in  unique(clusterization)) {
    #print(cl.val)
    cl.name <- str_split(names(clusterization[clusterization == cl.val])[1],
                            pattern = "_",simplify = T)[1]
    cl.names <- c(cl.names,cl.name)
    cl.names <- cl.names[!is.na(cl.names)]

    deaSeurat[deaSeurat$cluster == cl.val,]$cluster <- cl.name

  }

  clusters <- str_split(datasets_csv$Collection[ind],pattern = "_[+]_",simplify = T)

  colnames(deaSeurat) <- str_replace(colnames(deaSeurat),
                                     pattern = "cluster",
                                     replacement = "clusters")
  colnames(deaSeurat) <- str_replace(colnames(deaSeurat),
                                     pattern = "gene",
                                     replacement = "genes")

  deaSeurat$data_set <- subset.datasets_csv[ind,1]
  deaSeurat$set_number <- ind
  deaSeurat_tot <- rbind(deaSeurat_tot, deaSeurat)


  }
 deaSeurat_tot <-  deaSeurat_tot[2:nrow(deaSeurat_tot),]

 deaSeurat_tot <- merge.data.frame(deaSeurat_tot,
                                   ground_truth_tot,
                                   by = c("genes","clusters","data_set","set_number"),
                                   all.x = T,all.y = F)

# Convert TRUE/FALSE to 1/0
deaSeurat_tot$value <- as.numeric(deaSeurat_tot$value)

# Compute the ROC curve - note that we invert the p-values with 1 - p_values
roc_resultSeurat_scTr <- roc(deaSeurat_tot$value, 1 - deaSeurat_tot$p_val)
ROC for Seurat Bimod
deaSeurat_tot <- NA

for (ind in 1:dim(subset.datasets_csv)[1]) {
  #print(ind)
  file.code <- paste0(subset.datasets_csv$Group[ind],"_",subset.datasets_csv$Collection[ind])

  dataset <- readRDS(file = file.path(dataSetDir,paste0(file.code,".RDS")))

  clusterization <- getClusterizationData(dataset, clName = "mergedClusters")[[1]]

  deaSeurat <- read.csv(file.path(dirOut,paste0(file.code,"Seurat_DEA_Bimod_genes.csv")), row.names = 1)

  cl.names <- NA

  for (cl.val in  unique(clusterization)) {
    #print(cl.val)
    cl.name <- str_split(names(clusterization[clusterization == cl.val])[1],
                            pattern = "_",simplify = T)[1]
    cl.names <- c(cl.names,cl.name)
    cl.names <- cl.names[!is.na(cl.names)]

    deaSeurat[deaSeurat$cluster == cl.val,]$cluster <- cl.name

  }

  clusters <- str_split(datasets_csv$Collection[ind],pattern = "_[+]_",simplify = T)

  colnames(deaSeurat) <- str_replace(colnames(deaSeurat),
                                     pattern = "cluster",
                                     replacement = "clusters")
  colnames(deaSeurat) <- str_replace(colnames(deaSeurat),
                                     pattern = "gene",
                                     replacement = "genes")

  deaSeurat$data_set <- subset.datasets_csv[ind,1]
  deaSeurat$set_number <- ind
  deaSeurat_tot <- rbind(deaSeurat_tot, deaSeurat)


  }
 deaSeurat_tot <-  deaSeurat_tot[2:nrow(deaSeurat_tot),]

 deaSeurat_tot <- merge.data.frame(deaSeurat_tot,
                                   ground_truth_tot,
                                   by = c("genes","clusters","data_set","set_number"),
                                   all.x = T,all.y = F)

# Convert TRUE/FALSE to 1/0
deaSeurat_tot$value <- as.numeric(deaSeurat_tot$value)

# Compute the ROC curve - note that we invert the p-values with 1 - p_values
roc_resultSeurat_Bimod <- roc(deaSeurat_tot$value, 1 - deaSeurat_tot$p_val)
ROC for Monocle
deaMonocle_tot <- NA
for (ind in 1:dim(subset.datasets_csv)[1]) {
  file.code <- paste0(subset.datasets_csv$Group[ind],"_",subset.datasets_csv$Collection[ind])
  dataset <- readRDS(file = file.path(dataSetDir,paste0(file.code,".RDS")))

  clusterization <- getClusterizationData(dataset, clName = "mergedClusters")[[1]]
  #print(file.code)

  deaMonocle <- read.csv(file.path(dirOut,paste0(file.code,"Monocle_DEA_genes.csv")),row.names = 1)

  cl.names <- NA

  for (cl.val in  unique(clusterization)) {
    #print(cl.val)
    cl.name <- str_split(names(clusterization[clusterization == cl.val])[1],
                            pattern = "_",simplify = T)[1]
    cl.names <- c(cl.names,cl.name)
    cl.names <- cl.names[!is.na(cl.names)]

    deaMonocle[deaMonocle$cell_group == cl.val,"cell_group"] <- cl.name

  }

  clusters <- str_split(datasets_csv$Collection[ind],pattern = "_[+]_",simplify = T)

  colnames(deaMonocle) <- str_replace(colnames(deaMonocle),
                                     pattern = "cell_group",
                                     replacement = "clusters")
  colnames(deaMonocle) <- str_replace(colnames(deaMonocle),
                                     pattern = "gene_id",
                                     replacement = "genes")

  deaMonocle$data_set <- subset.datasets_csv[ind,1]
  deaMonocle$set_number <- ind
  deaMonocle <- as.data.frame(deaMonocle)
  deaMonocle_tot <- rbind(deaMonocle_tot, deaMonocle)


  }
 deaMonocle_tot <-  deaMonocle_tot[2:nrow(deaMonocle_tot),]

 deaMonocle_tot <- merge.data.frame(deaMonocle_tot,
                                   ground_truth_tot,
                                   by = c("genes","clusters","data_set","set_number"),
                                   all.x = T,all.y = F)

# Convert TRUE/FALSE to 1/0
deaMonocle_tot$value <- as.numeric(deaMonocle_tot$value)

# Compute the ROC curve - note that we invert the p-values with 1 - p_values
roc_resultMonocle <- roc(deaMonocle_tot$value, 1 - deaMonocle_tot$marker_test_p_value)

# Plot the ROC curve
#plot(roc_resultMonocle)
ROC from Scanpy
deaScanpy_tot <- NA
for (ind in 1:dim(subset.datasets_csv)[1]) {
  file.code <- paste0(subset.datasets_csv$Group[ind],"_",subset.datasets_csv$Collection[ind])
  dataset <- readRDS(file = file.path(dataSetDir,paste0(file.code,".RDS")))

  clusterization <- getClusterizationData(dataset, clName = "mergedClusters")[[1]]
  #print(file.code)

  deaScanpy <- read.csv(file.path(dirOut,paste0(file.code,"Scanpy_DEA_genes.csv")),
                        row.names = 1)

  cl.names <- NA

  for (cl.val in  unique(clusterization)) {
    #print(cl.val)
    cl.name <- str_split(names(clusterization[clusterization == cl.val])[1],
                            pattern = "_",simplify = T)[1]
    cl.names <- c(cl.names,cl.name)
    cl.names <- cl.names[!is.na(cl.names)]

    deaScanpy[deaScanpy$clusters == paste0("cl",cl.val),"clusters"] <- cl.name

  }

  clusters <- str_split(datasets_csv$Collection[ind],pattern = "_[+]_",simplify = T)


  deaScanpy$data_set <- subset.datasets_csv[ind,1]
  deaScanpy$set_number <- ind
  deaScanpy_tot <- rbind(deaScanpy_tot, deaScanpy)


  }
 deaScanpy_tot <-  deaScanpy_tot[2:nrow(deaScanpy_tot),]

 deaScanpy_tot <- merge.data.frame(deaScanpy_tot,
                                   ground_truth_tot,
                                   by = c("genes","clusters","data_set","set_number"),
                                   all.x = T,all.y = F)

# Convert TRUE/FALSE to 1/0
deaScanpy_tot$value <- as.numeric(deaScanpy_tot$value)

# Compute the ROC curve - note that we invert the p-values with 1 - p_values
roc_resultScanpy <- roc(deaScanpy_tot$value, 1 - deaScanpy_tot$pval)

# Plot the ROC curve
#plot(roc_resultScanpy)
Summary ROC for all methods
Three_Clusters_uneven <- ggroc(list(COTAN=roc_resultCOTAN,
                                    Seurat=roc_resultSeurat,
                 Seurat_scTr = roc_resultSeurat_scTr,
                 Seurat_Bimod = roc_resultSeurat_Bimod,
                 Monocle=roc_resultMonocle,
                 Scanpy=roc_resultScanpy),
                 aes = c("colour"),
            legacy.axes = T,
            linewidth = 1)+theme_light()+
  scale_colour_manual("",
                      values = methods.color)

Three_Clusters_unevenPL <- Three_Clusters_uneven + xlab("FPR") + ylab("TPR")+theme(legend.position="none")

Three_Clusters_uneven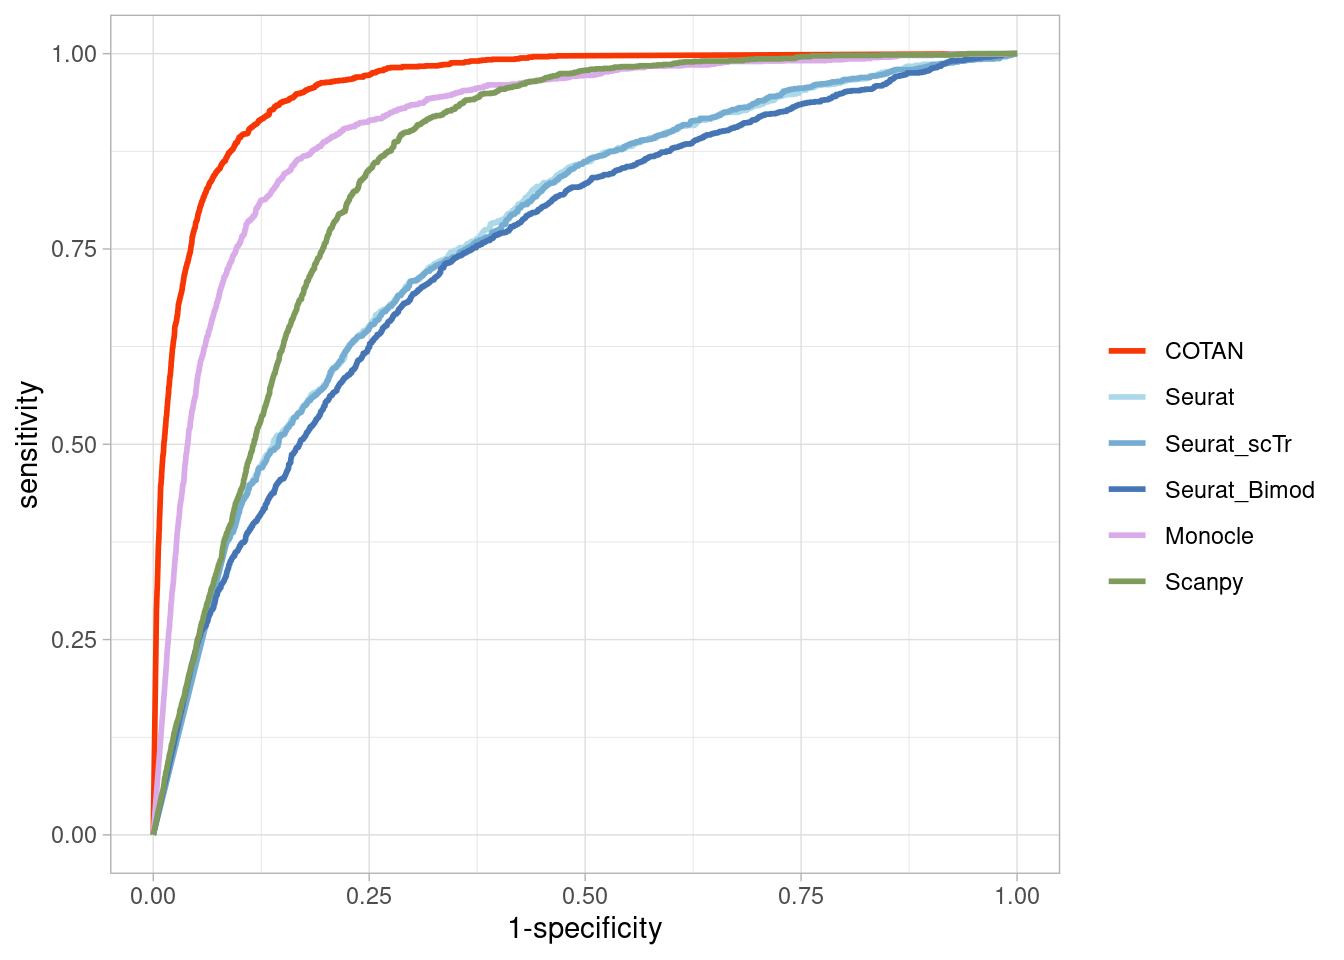
5 clusters
5_Clusters_uneven
True vector
subset.datasets_csv <-datasets_csv[datasets_csv$Group == "5_Clusters_uneven",]

ground_truth_tot <- NA

for (ind in 1:dim(subset.datasets_csv)[1]) {
  clusters <- str_split(subset.datasets_csv$Collection[ind],pattern = "_[+]_",simplify = T)

  file.presence.subset <- file.presence[,clusters]


  #file.presence.subset <- as.matrix(file.presence.subset)


  ground_truth <- as.data.frame(matrix(nrow = nrow(file.presence.subset),
                                       ncol = ncol(file.presence.subset)))
  rownames(ground_truth) <- rownames(file.presence.subset)
  colnames(ground_truth) <- colnames(file.presence.subset)

  ground_truth[file.presence.subset == "Absent"] <- 0
  ground_truth[file.presence.subset == "Present"] <- 1
  ground_truth[file.presence.subset == "Uncertain"] <- 0.6

  file.presence.subset <- ground_truth

  for (col in 1:ncol(ground_truth)) {
    ground_truth[,col] <- FALSE
    ground_truth[file.presence.subset[,col] == 1 & rowMeans(file.presence.subset[,-col,drop = FALSE]) < 0.35  ,col] <- TRUE
    }

  ground_truth$genes <- rownames(ground_truth)
  ground_truth <- pivot_longer(ground_truth,
                               cols = 1:(ncol(ground_truth)-1),
                               names_to = "clusters")
  ground_truth$data_set <- subset.datasets_csv[ind,1]
  ground_truth$set_number <- ind
  ground_truth_tot <- rbind(ground_truth_tot, ground_truth)

}
ground_truth_tot <- ground_truth_tot[2:nrow(ground_truth_tot),]


head(ground_truth_tot)
# A tibble: 6 × 5
genes clusters value data_set set_number
<chr> <chr> <lgl> <chr> <int>
1 Neil2 E13.5-510 FALSE 5_Clusters_uneven 1
2 Neil2 E15.0-437 FALSE 5_Clusters_uneven 1
3 Neil2 E15.0-510 FALSE 5_Clusters_uneven 1
4 Neil2 E13.5-432 FALSE 5_Clusters_uneven 1
5 Neil2 E13.5-437 FALSE 5_Clusters_uneven 1
6 Lamc1 E13.5-510 FALSE 5_Clusters_uneven 1length(unique(ground_truth_tot$genes)) [1] 14695sum(ground_truth_tot$value)[1] 1663ROC for COTAN
onlyPositive.pVal.Cotan_tot <- NA

for (ind in 1:dim(subset.datasets_csv)[1]) {
  #print(ind)
  file.code <- paste0(subset.datasets_csv$Group[ind],"_",
                      subset.datasets_csv$Collection[ind])
  dataset <- readRDS(file = file.path(dataSetDir,paste0(file.code,".RDS")))
  deaCOTAN <- getClusterizationData(dataset,clName = "mergedClusters")[[2]]
  pvalCOTAN <- pValueFromDEA(deaCOTAN,
              numCells = getNumCells(dataset),adjustmentMethod ="none")
  genesLambda <- getLambda(dataset)
  genesLambda <- as.data.frame(genesLambda)
  genesLambda$genes <- rownames(genesLambda)


  clusterization <- getClusterizationData(dataset, clName = "mergedClusters")[[1]]
  cl.names <- NA

  for (cl.val in  unique(clusterization)) {
    #print(cl.val)
    cl.names <- c(cl.names,
                  str_split(names(clusterization[clusterization == cl.val])[1],
                            pattern = "_",simplify = T)[1])
    cl.names <- cl.names[!is.na(cl.names)]
  }
  colnames(deaCOTAN) <- cl.names
  colnames(pvalCOTAN) <- cl.names

  clusters <- str_split(datasets_csv$Collection[ind],pattern = "_[+]_",simplify = T)

  onlyPositive.pVal.Cotan <- pvalCOTAN

    for (cl in cl.names) {
    print(cl)
    #temp.DEA.CotanSign <- deaCOTAN[rownames(pvalCOTAN[pvalCOTAN[,cl] < 0.05,]) ,]
    onlyPositive.pVal.Cotan[rownames(deaCOTAN[deaCOTAN[,cl] < 0,]),cl] <-  1 #onlyPositive.pVal.Cotan[rownames(deaCOTAN[deaCOTAN[,cl] < 0,]),cl]+1
    }

    onlyPositive.pVal.Cotan$genes <- rownames(onlyPositive.pVal.Cotan)
    onlyPositive.pVal.Cotan <- pivot_longer(onlyPositive.pVal.Cotan,
                                            values_to = "p_values",
                               cols = 1:(ncol(onlyPositive.pVal.Cotan)-1),
                               names_to = "clusters")
  onlyPositive.pVal.Cotan$data_set <- subset.datasets_csv[ind,1]
  onlyPositive.pVal.Cotan$set_number <- ind

  onlyPositive.pVal.Cotan <- merge(onlyPositive.pVal.Cotan,genesLambda,by="genes")

  onlyPositive.pVal.Cotan_tot <- rbind(onlyPositive.pVal.Cotan_tot, onlyPositive.pVal.Cotan)

  }
[1] "E13.5-432"
[1] "E15.0-510"
[1] "E13.5-437"
[1] "E15.0-437"
[1] "E13.5-510"
[1] "E13.5-434"
[1] "E15.0-428"
[1] "E13.5-184"
[1] "E15.0-434"
[1] "E17.5-505"
[1] "E15.0-432"
[1] "E13.5-432"
[1] "E15.0-509"
[1] "E15.0-508"
[1] "E13.5-187"onlyPositive.pVal.Cotan_tot <- onlyPositive.pVal.Cotan_tot[2:nrow(onlyPositive.pVal.Cotan_tot),]
onlyPositive.pVal.Cotan_tot <- merge.data.frame(onlyPositive.pVal.Cotan_tot,
ground_truth_tot,by = c("genes","clusters","data_set","set_number"),all.x = T,all.y = F)
# Convert TRUE/FALSE to 1/0
onlyPositive.pVal.Cotan_tot$value <- as.numeric(onlyPositive.pVal.Cotan_tot$value)
# Compute the ROC curve - note that we invert the p-values with 1 - p_values
roc_resultCOTAN <- roc(onlyPositive.pVal.Cotan_tot$value, 1 - onlyPositive.pVal.Cotan_tot$p_values)
cotan.threshold.pval <- quantile(onlyPositive.pVal.Cotan_tot[onlyPositive.pVal.Cotan_tot$value == 0,]$p_values,probs = 0.05)
# Plot the ROC curve
#plot(roc_resultCOTAN)ROC for Seurat
deaSeurat_tot <- NA

for (ind in 1:dim(subset.datasets_csv)[1]) {
  #print(ind)
  file.code <- paste0(subset.datasets_csv$Group[ind],"_",subset.datasets_csv$Collection[ind])

  dataset <- readRDS(file = file.path(dataSetDir,paste0(file.code,".RDS")))

  clusterization <- getClusterizationData(dataset, clName = "mergedClusters")[[1]]

  deaSeurat <- read.csv(file.path(dirOut,paste0(file.code,"Seurat_DEA_genes.csv")), row.names = 1)

  cl.names <- NA

  for (cl.val in  unique(clusterization)) {
    #print(cl.val)
    cl.name <- str_split(names(clusterization[clusterization == cl.val])[1],
                            pattern = "_",simplify = T)[1]
    cl.names <- c(cl.names,cl.name)
    cl.names <- cl.names[!is.na(cl.names)]

    deaSeurat[deaSeurat$cluster == cl.val,]$cluster <- cl.name

  }

  clusters <- str_split(datasets_csv$Collection[ind],pattern = "_[+]_",simplify = T)

  colnames(deaSeurat) <- str_replace(colnames(deaSeurat),
                                     pattern = "cluster",
                                     replacement = "clusters")
  colnames(deaSeurat) <- str_replace(colnames(deaSeurat),
                                     pattern = "gene",
                                     replacement = "genes")

  deaSeurat$data_set <- subset.datasets_csv[ind,1]
  deaSeurat$set_number <- ind
  deaSeurat_tot <- rbind(deaSeurat_tot, deaSeurat)


  }
 deaSeurat_tot <-  deaSeurat_tot[2:nrow(deaSeurat_tot),]

 deaSeurat_tot <- merge.data.frame(deaSeurat_tot,
                                   ground_truth_tot,
                                   by = c("genes","clusters","data_set","set_number"),
                                   all.x = T,all.y = F)

# Convert TRUE/FALSE to 1/0
deaSeurat_tot$value <- as.numeric(deaSeurat_tot$value)

deaSeurat_tot_base <- deaSeurat_tot

# Compute the ROC curve - note that we invert the p-values with 1 - p_values
roc_resultSeurat <- roc(deaSeurat_tot$value, 1 - deaSeurat_tot$p_val)


seurat.threshold.pval <- quantile(deaSeurat_tot_base[deaSeurat_tot_base$value == 0,]$p_val,probs = 0.05)
# Plot the ROC curve
#plot(roc_resultSeurat)
ROC for Seurat scTransform
deaSeurat_tot <- NA

for (ind in 1:dim(subset.datasets_csv)[1]) {
  #print(ind)
  file.code <- paste0(subset.datasets_csv$Group[ind],"_",subset.datasets_csv$Collection[ind])

  dataset <- readRDS(file = file.path(dataSetDir,paste0(file.code,".RDS")))

  clusterization <- getClusterizationData(dataset, clName = "mergedClusters")[[1]]

  deaSeurat <- read.csv(file.path(dirOut,paste0(file.code,"Seurat_DEA_ScTransform_genes.csv")), row.names = 1)

  cl.names <- NA

  for (cl.val in  unique(clusterization)) {
    #print(cl.val)
    cl.name <- str_split(names(clusterization[clusterization == cl.val])[1],
                            pattern = "_",simplify = T)[1]
    cl.names <- c(cl.names,cl.name)
    cl.names <- cl.names[!is.na(cl.names)]

    deaSeurat[deaSeurat$cluster == cl.val,]$cluster <- cl.name

  }

  clusters <- str_split(datasets_csv$Collection[ind],pattern = "_[+]_",simplify = T)

  colnames(deaSeurat) <- str_replace(colnames(deaSeurat),
                                     pattern = "cluster",
                                     replacement = "clusters")
  colnames(deaSeurat) <- str_replace(colnames(deaSeurat),
                                     pattern = "gene",
                                     replacement = "genes")

  deaSeurat$data_set <- subset.datasets_csv[ind,1]
  deaSeurat$set_number <- ind
  deaSeurat_tot <- rbind(deaSeurat_tot, deaSeurat)


  }
 deaSeurat_tot <-  deaSeurat_tot[2:nrow(deaSeurat_tot),]

 deaSeurat_tot <- merge.data.frame(deaSeurat_tot,
                                   ground_truth_tot,
                                   by = c("genes","clusters","data_set","set_number"),
                                   all.x = T,all.y = F)

# Convert TRUE/FALSE to 1/0
deaSeurat_tot$value <- as.numeric(deaSeurat_tot$value)

deaSeurat_tot_scTr <- deaSeurat_tot

Seurat_scTr.threshold.pval <- quantile(deaSeurat_tot_scTr[deaSeurat_tot_scTr$value == 0,]$p_val,probs = 0.05)

# Compute the ROC curve - note that we invert the p-values with 1 - p_values
roc_resultSeurat_scTr <- roc(deaSeurat_tot$value, 1 - deaSeurat_tot$p_val)
ROC for Seurat Bimod
deaSeurat_tot <- NA

for (ind in 1:dim(subset.datasets_csv)[1]) {
  #print(ind)
  file.code <- paste0(subset.datasets_csv$Group[ind],"_",subset.datasets_csv$Collection[ind])

  dataset <- readRDS(file = file.path(dataSetDir,paste0(file.code,".RDS")))

  clusterization <- getClusterizationData(dataset, clName = "mergedClusters")[[1]]

  deaSeurat <- read.csv(file.path(dirOut,paste0(file.code,"Seurat_DEA_Bimod_genes.csv")), row.names = 1)

  cl.names <- NA

  for (cl.val in  unique(clusterization)) {
    #print(cl.val)
    cl.name <- str_split(names(clusterization[clusterization == cl.val])[1],
                            pattern = "_",simplify = T)[1]
    cl.names <- c(cl.names,cl.name)
    cl.names <- cl.names[!is.na(cl.names)]

    deaSeurat[deaSeurat$cluster == cl.val,]$cluster <- cl.name

  }

  clusters <- str_split(datasets_csv$Collection[ind],pattern = "_[+]_",simplify = T)

  colnames(deaSeurat) <- str_replace(colnames(deaSeurat),
                                     pattern = "cluster",
                                     replacement = "clusters")
  colnames(deaSeurat) <- str_replace(colnames(deaSeurat),
                                     pattern = "gene",
                                     replacement = "genes")

  deaSeurat$data_set <- subset.datasets_csv[ind,1]
  deaSeurat$set_number <- ind
  deaSeurat_tot <- rbind(deaSeurat_tot, deaSeurat)


  }
 deaSeurat_tot <-  deaSeurat_tot[2:nrow(deaSeurat_tot),]

 deaSeurat_tot <- merge.data.frame(deaSeurat_tot,
                                   ground_truth_tot,
                                   by = c("genes","clusters","data_set","set_number"),
                                   all.x = T,all.y = F)

# Convert TRUE/FALSE to 1/0
deaSeurat_tot$value <- as.numeric(deaSeurat_tot$value)

deaSeurat_tot_Bimod <- deaSeurat_tot

seurat_bimod.threshold.pval <- quantile(deaSeurat_tot_Bimod[deaSeurat_tot_Bimod$value == 0,]$p_val,probs = 0.05)

# Compute the ROC curve - note that we invert the p-values with 1 - p_values
roc_resultSeurat_Bimod <- roc(deaSeurat_tot$value, 1 - deaSeurat_tot$p_val)
ROC for Monocle
deaMonocle_tot <- NA
for (ind in 1:dim(subset.datasets_csv)[1]) {
  file.code <- paste0(subset.datasets_csv$Group[ind],"_",subset.datasets_csv$Collection[ind])
  dataset <- readRDS(file = file.path(dataSetDir,paste0(file.code,".RDS")))

  clusterization <- getClusterizationData(dataset, clName = "mergedClusters")[[1]]
  #print(file.code)

  deaMonocle <- read.csv(file.path(dirOut,paste0(file.code,"Monocle_DEA_genes.csv")),row.names = 1)

  cl.names <- NA

  for (cl.val in  unique(clusterization)) {
    #print(cl.val)
    cl.name <- str_split(names(clusterization[clusterization == cl.val])[1],
                            pattern = "_",simplify = T)[1]
    cl.names <- c(cl.names,cl.name)
    cl.names <- cl.names[!is.na(cl.names)]

    deaMonocle[deaMonocle$cell_group == cl.val,"cell_group"] <- cl.name

  }

  clusters <- str_split(datasets_csv$Collection[ind],pattern = "_[+]_",simplify = T)

  colnames(deaMonocle) <- str_replace(colnames(deaMonocle),
                                     pattern = "cell_group",
                                     replacement = "clusters")
  colnames(deaMonocle) <- str_replace(colnames(deaMonocle),
                                     pattern = "gene_id",
                                     replacement = "genes")

  deaMonocle$data_set <- subset.datasets_csv[ind,1]
  deaMonocle$set_number <- ind
  deaMonocle <- as.data.frame(deaMonocle)
  deaMonocle_tot <- rbind(deaMonocle_tot, deaMonocle)


  }
 deaMonocle_tot <-  deaMonocle_tot[2:nrow(deaMonocle_tot),]

 deaMonocle_tot <- merge.data.frame(deaMonocle_tot,
                                   ground_truth_tot,
                                   by = c("genes","clusters","data_set","set_number"),
                                   all.x = T,all.y = F)

# Convert TRUE/FALSE to 1/0
deaMonocle_tot$value <- as.numeric(deaMonocle_tot$value)

monocle.threshold.pval <- quantile(deaMonocle_tot[deaMonocle_tot$value == 0,]$marker_test_p_value,probs = 0.05)

# Compute the ROC curve - note that we invert the p-values with 1 - p_values
roc_resultMonocle <- roc(deaMonocle_tot$value, 1 - deaMonocle_tot$marker_test_p_value)

# Plot the ROC curve
#plot(roc_resultMonocle)
ROC from Scanpy
deaScanpy_tot <- NA
for (ind in 1:dim(subset.datasets_csv)[1]) {
  file.code <- paste0(subset.datasets_csv$Group[ind],"_",subset.datasets_csv$Collection[ind])
  dataset <- readRDS(file = file.path(dataSetDir,paste0(file.code,".RDS")))

  clusterization <- getClusterizationData(dataset, clName = "mergedClusters")[[1]]
  #print(file.code)

  deaScanpy <- read.csv(file.path(dirOut,paste0(file.code,"Scanpy_DEA_genes.csv")),
                        row.names = 1)

  cl.names <- NA

  for (cl.val in  unique(clusterization)) {
    #print(cl.val)
    cl.name <- str_split(names(clusterization[clusterization == cl.val])[1],
                            pattern = "_",simplify = T)[1]
    cl.names <- c(cl.names,cl.name)
    cl.names <- cl.names[!is.na(cl.names)]

    deaScanpy[deaScanpy$clusters == paste0("cl",cl.val),"clusters"] <- cl.name

  }

  clusters <- str_split(datasets_csv$Collection[ind],pattern = "_[+]_",simplify = T)


  deaScanpy$data_set <- subset.datasets_csv[ind,1]
  deaScanpy$set_number <- ind
  deaScanpy_tot <- rbind(deaScanpy_tot, deaScanpy)


  }
 deaScanpy_tot <-  deaScanpy_tot[2:nrow(deaScanpy_tot),]

 deaScanpy_tot <- merge.data.frame(deaScanpy_tot,
                                   ground_truth_tot,
                                   by = c("genes","clusters","data_set","set_number"),
                                   all.x = T,all.y = F)

# Convert TRUE/FALSE to 1/0
deaScanpy_tot$value <- as.numeric(deaScanpy_tot$value)

scanpy.threshold.pval <- quantile(deaScanpy_tot[deaScanpy_tot$value == 0,]$pval,probs = 0.05)

# Compute the ROC curve - note that we invert the p-values with 1 - p_values
roc_resultScanpy <- roc(deaScanpy_tot$value, 1 - deaScanpy_tot$pval)

# Plot the ROC curve
#plot(roc_resultScanpy)
Summary ROC for all methods
Five_Clusters <- ggroc(list(COTAN=roc_resultCOTAN,
                                    Seurat=roc_resultSeurat,
                 Seurat_scTr = roc_resultSeurat_scTr,
                 Seurat_Bimod = roc_resultSeurat_Bimod,
                 Monocle=roc_resultMonocle,
                 Scanpy=roc_resultScanpy),
                 aes = c("colour"),
            legacy.axes = T,
            linewidth = 1)+theme_light()+
  scale_colour_manual("",
                      values = methods.color)


Five_Clusters_unevenPL <- Five_Clusters + xlab("FPR") + ylab("TPR")

Five_Clusters_unevenPL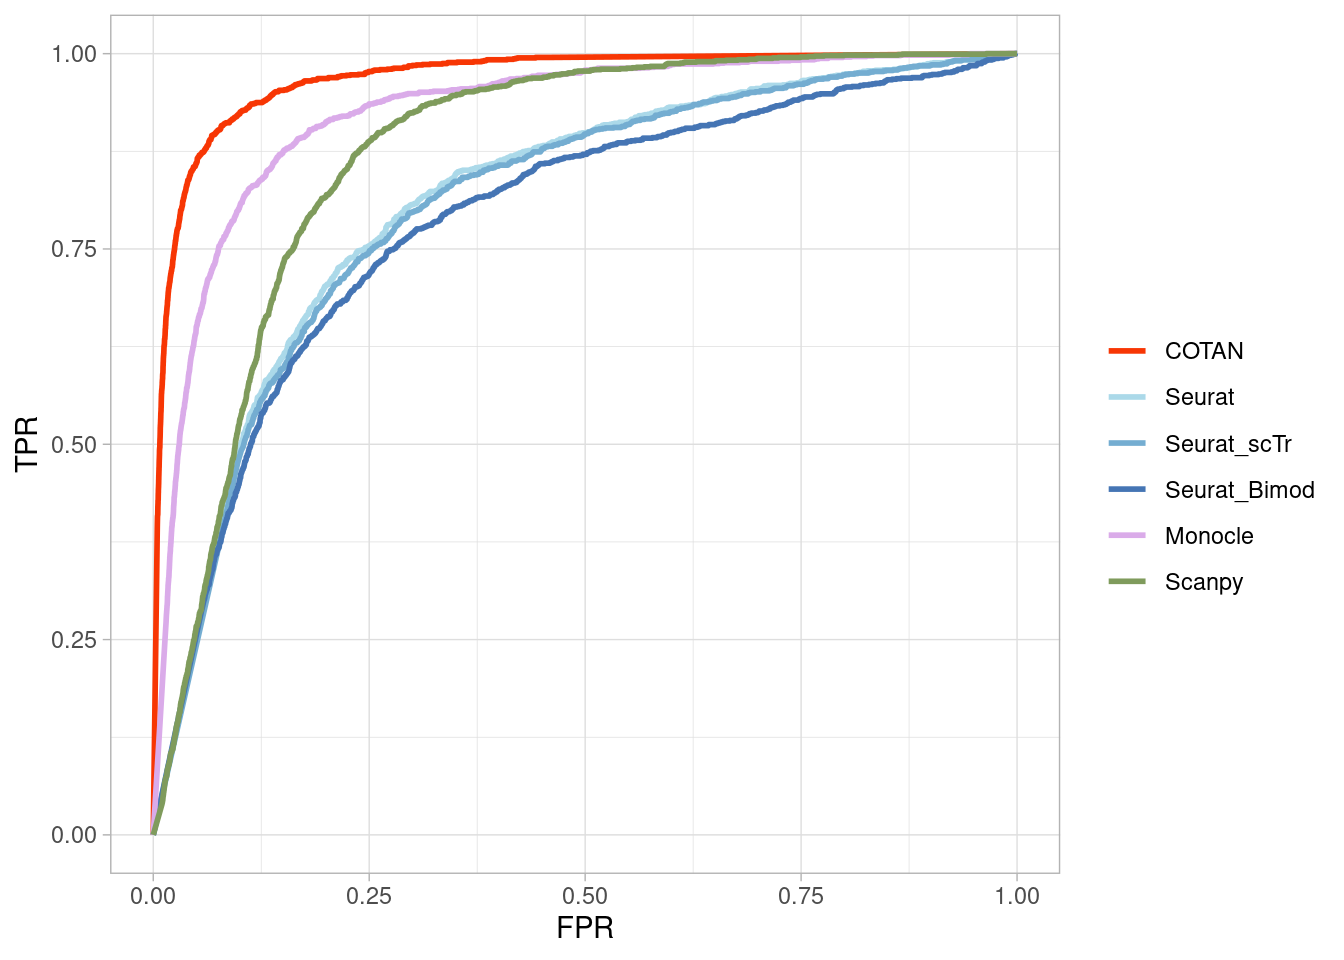
Global Summary
2 Clusters
plot_2cl <- ggarrange(TwoClusters_even_nearPL,Two_Clusters_even_mediumPL, Two_Clusters_even_farPL,Two_Clusters_uneven_nearPL, Two_Clusters_uneven_mediumPL,Two_Clusters_uneven_farPL,
          labels = c("Even_Near", "Even_Medium", "Even_Far", "Uneven_Near","Uneven_Medium","Uneven_Far"),
          ncol = 3, nrow = 2, common.legend = T, legend = "bottom")

pdf(paste0(dirOut,"ROC_two_supp.pdf"),width = 15,height = 10)
plot(plot_2cl)
dev.off()
png
2 plot_2cl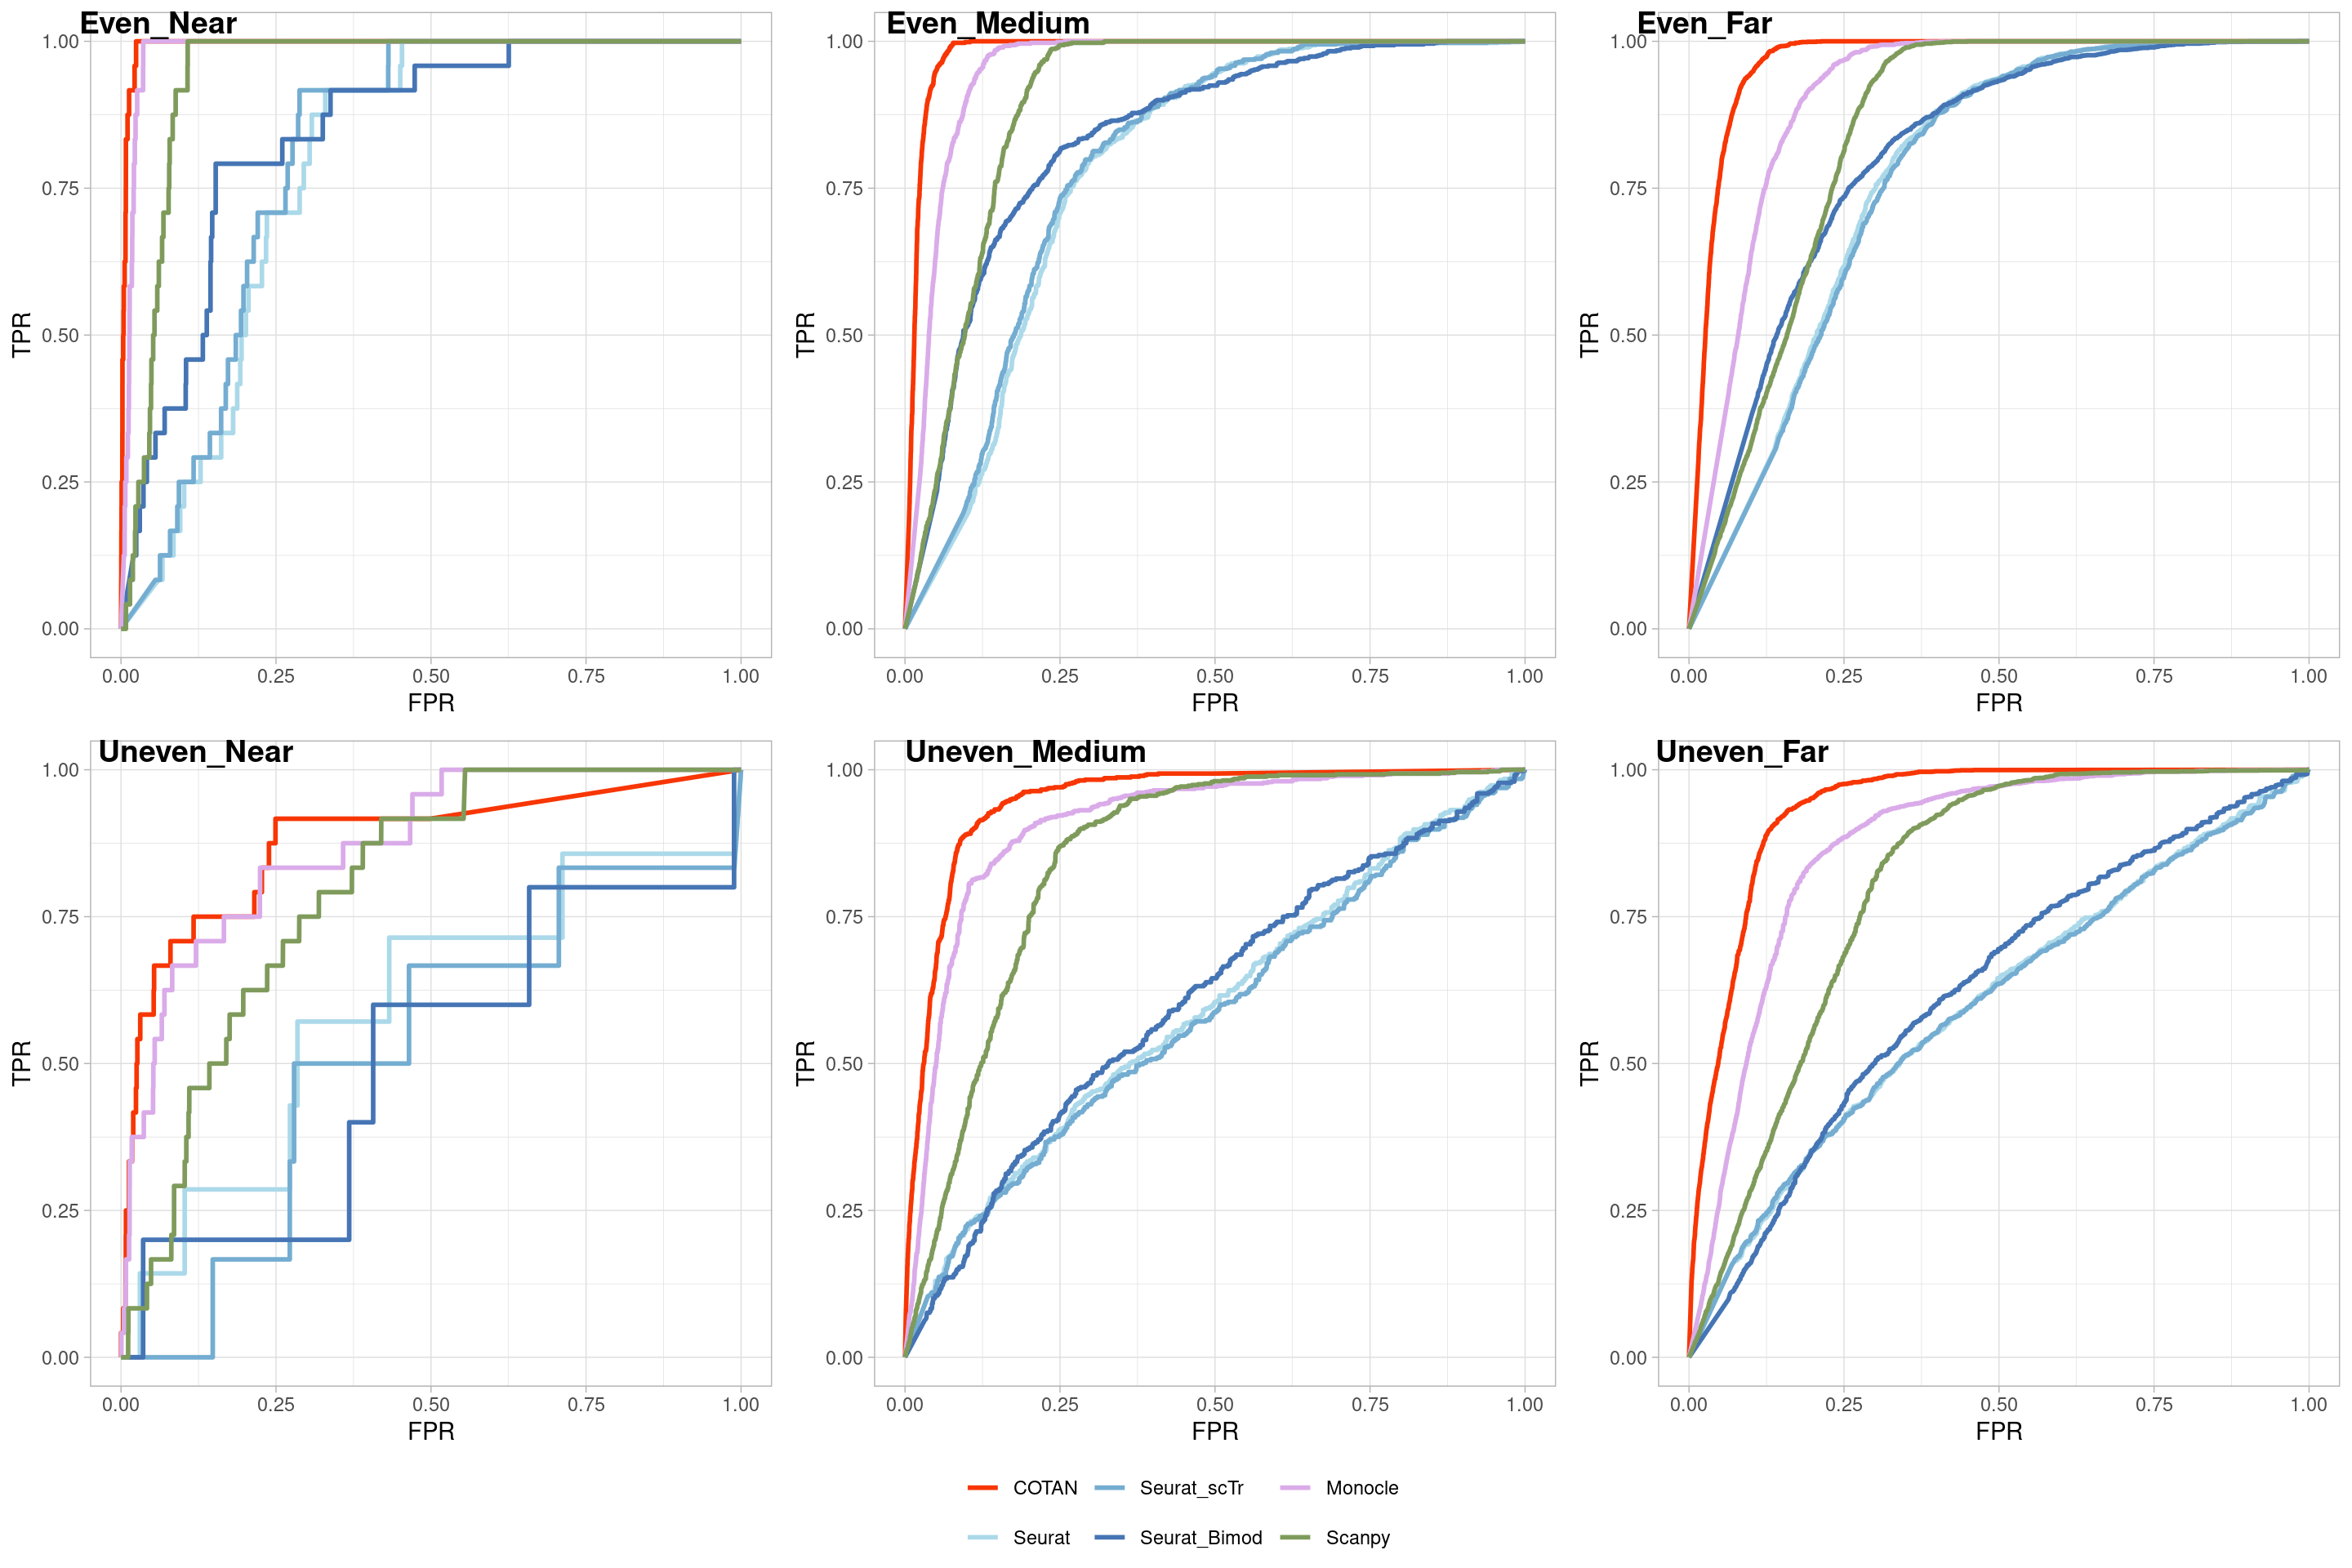
3 and 5 Clusters
plot_3_5 <- ggarrange(Three_Clusters_evenPL,Three_Clusters_unevenPL, NULL, Five_Clusters_unevenPL,
          labels = c("3_Even", "3_Uneven", "", "5_Uneven"),
          ncol = 2, nrow = 2, common.legend = T, legend = "bottom")

pdf(paste0(dirOut,"ROC_three_five_supp.pdf"),width = 10,height = 10)
plot(plot_3_5)
dev.off()
png
2 plot_3_5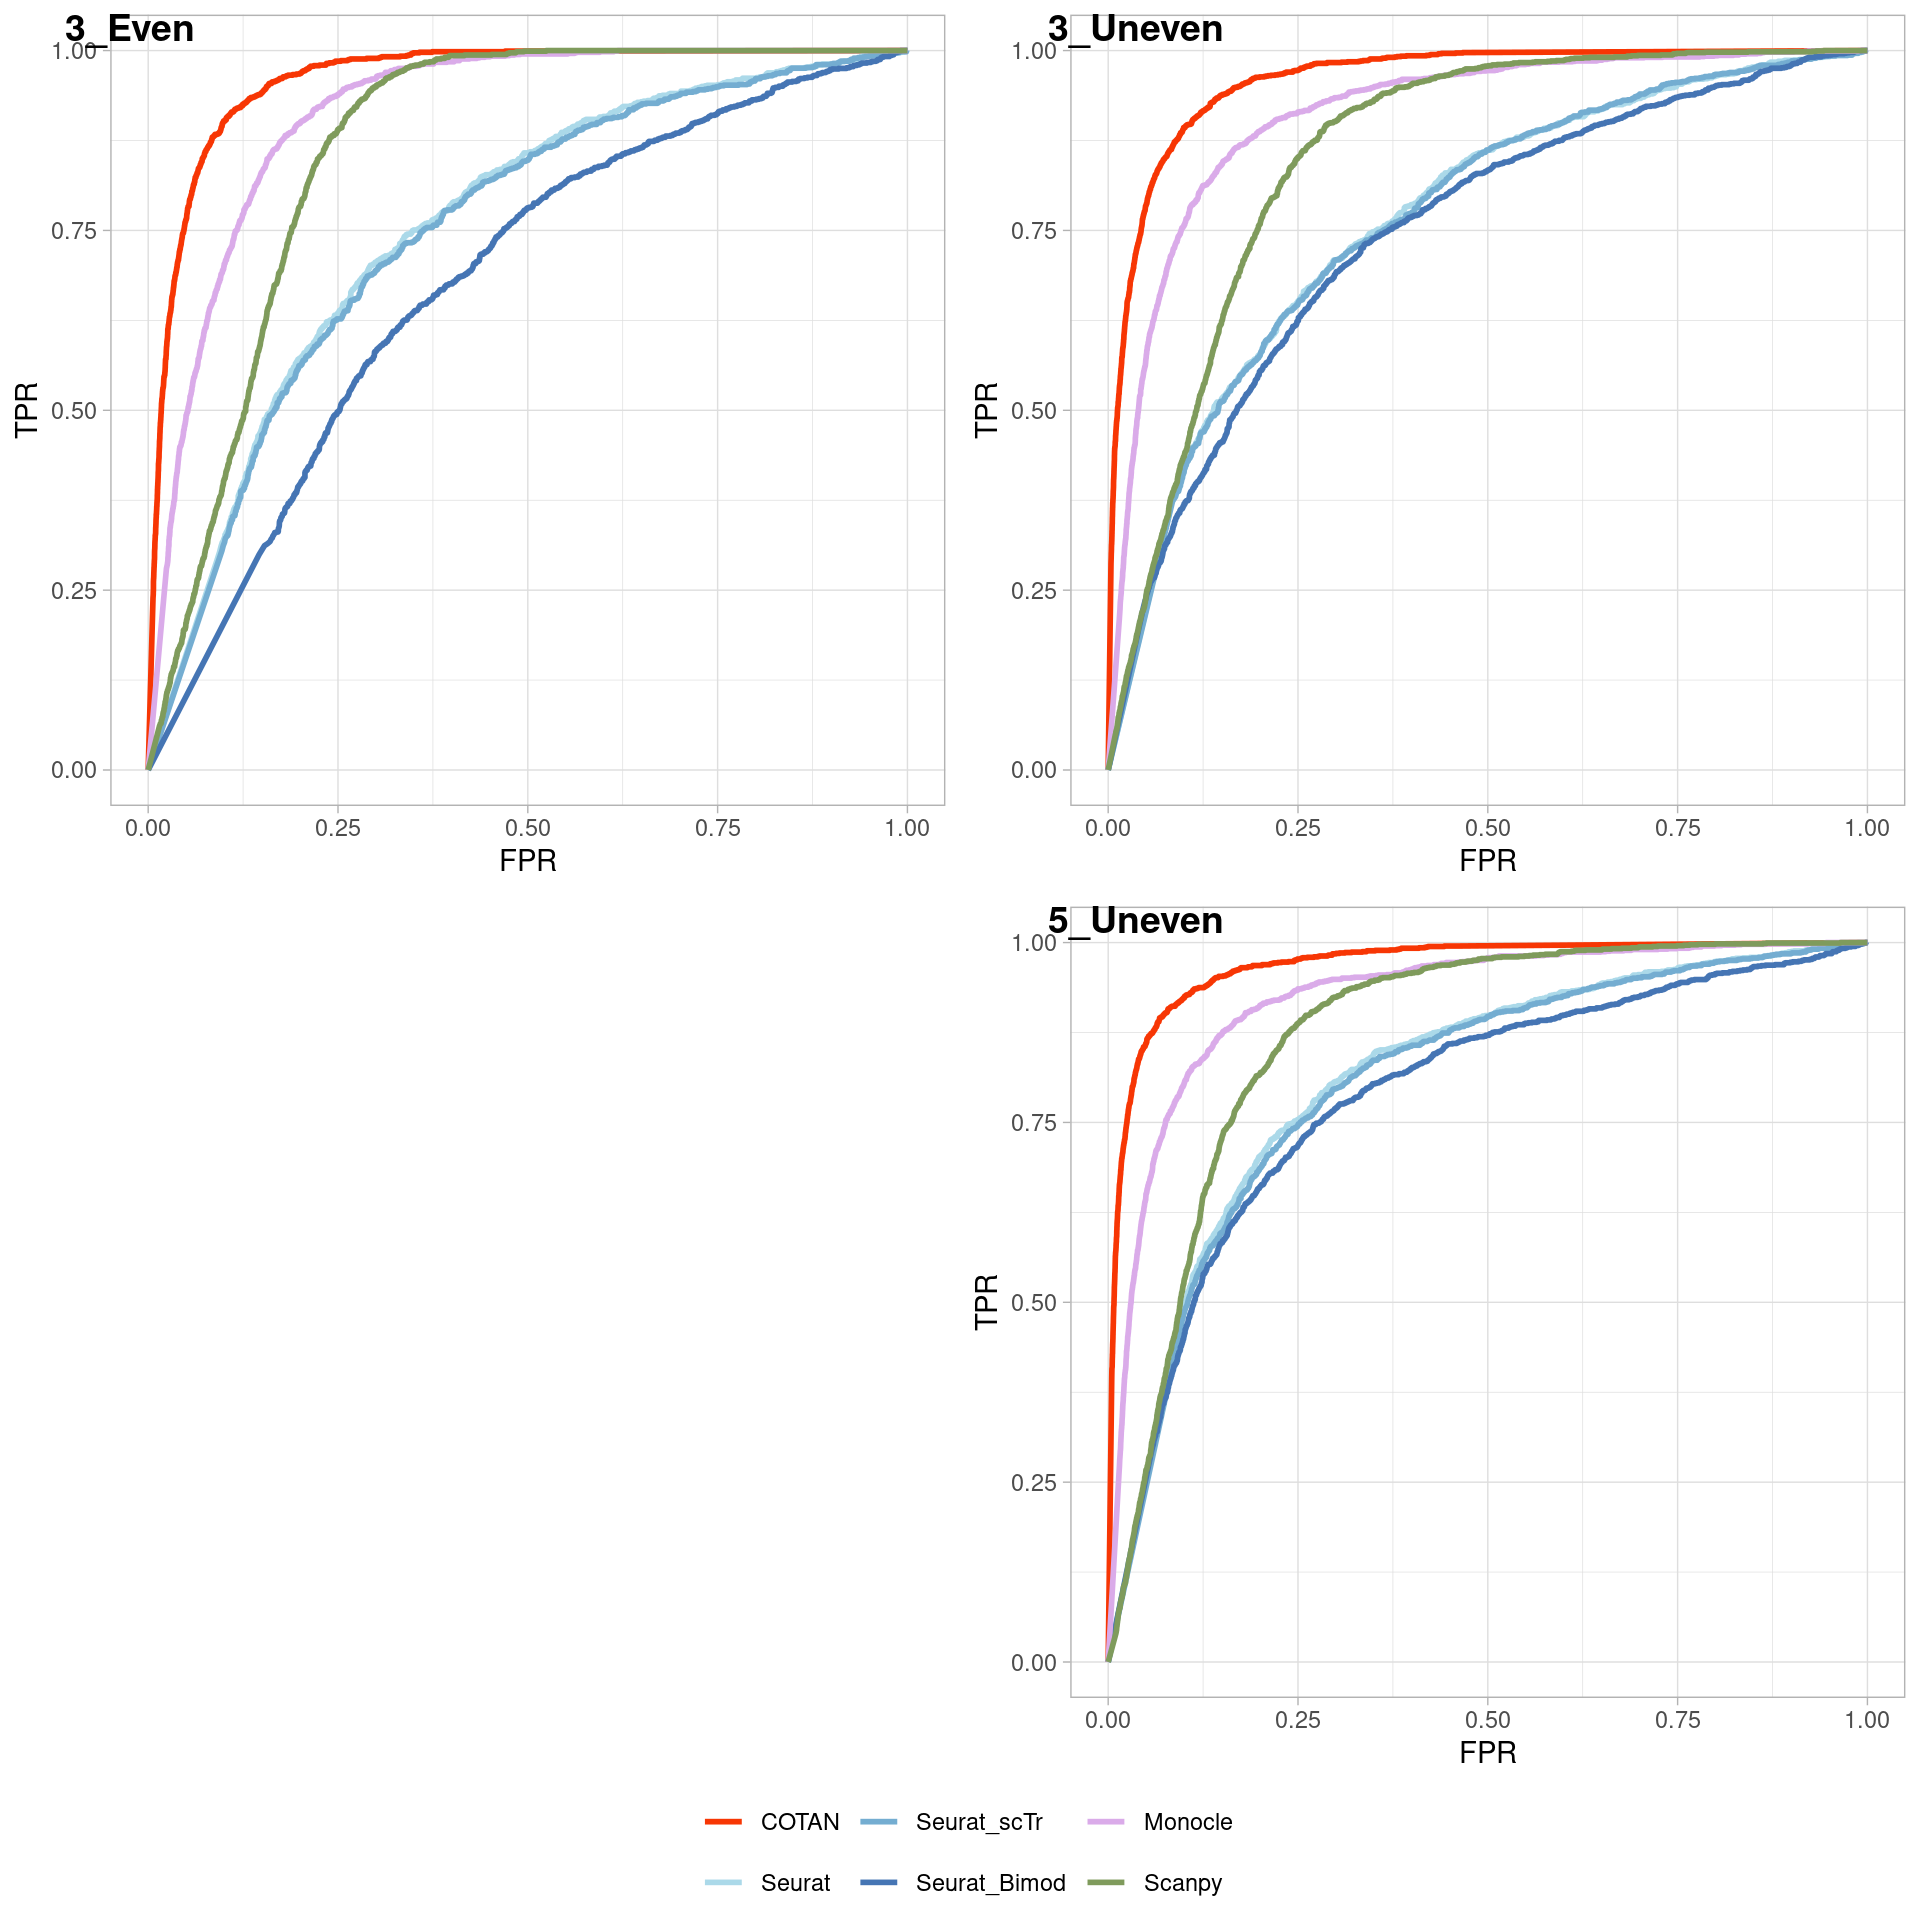
plot3 <- ggarrange(Two_Clusters_uneven_farPL,Three_Clusters_unevenPL, Five_Clusters_unevenPL,
          labels = c("A", "B", "C"),
          ncol = 3, nrow = 1, common.legend = T, legend = "none")

pdf(paste0(dirOut,"ROC_three_main.pdf"),width = 15,height = 5)
plot(plot3)
dev.off()
png
2 plot3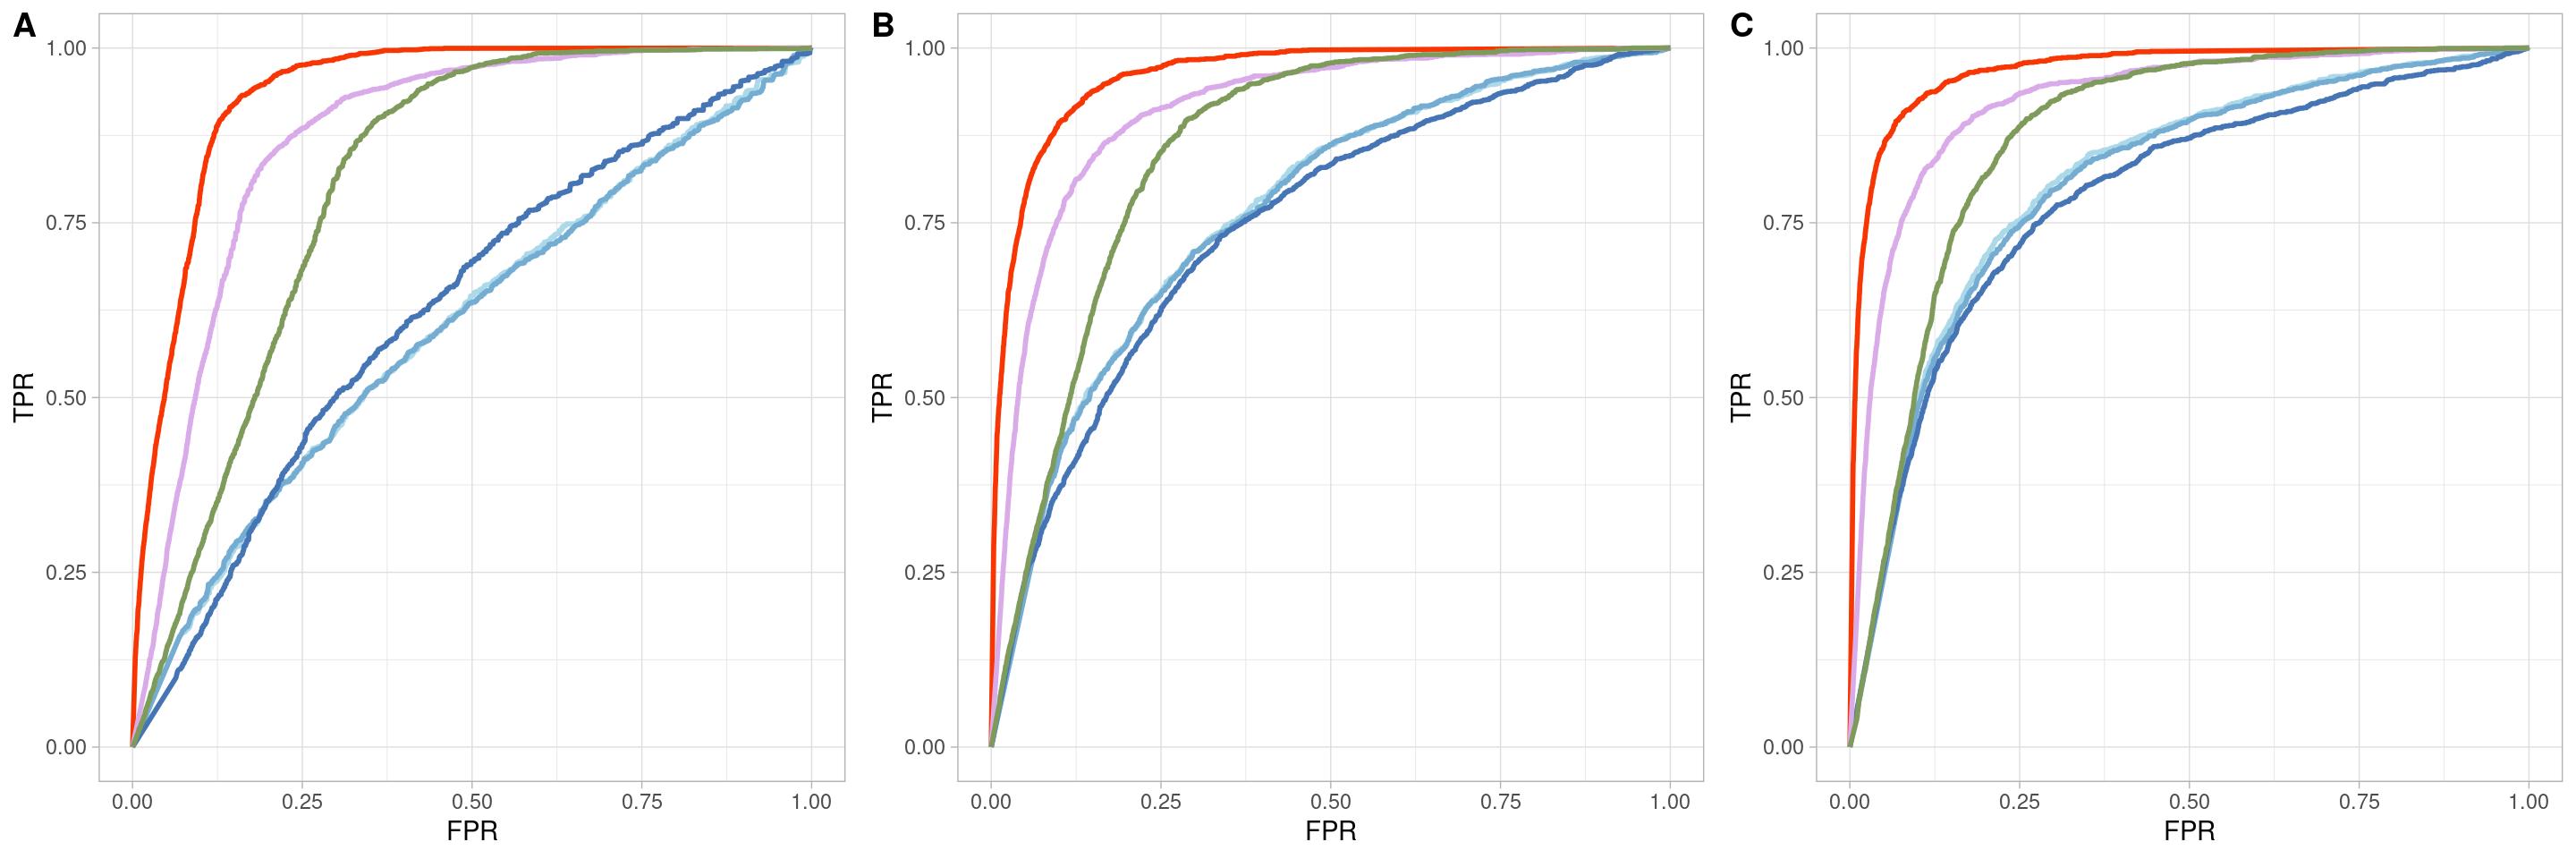
Histogram with gene expression level
ground_truth_tot_subset <- as.data.frame(ground_truth_tot[ground_truth_tot$value ==1,])

COTAN_data <- onlyPositive.pVal.Cotan_tot[,c("genes","set_number","clusters","p_values","genesLambda")]

colnames(COTAN_data) <- c("genes","set_number","clusters","p_value_COTAN","genesLambda")

ground_truth_tot_subset <- merge(ground_truth_tot_subset,
                                 COTAN_data,
                                 by=c("genes","set_number", "clusters"),
                                 all.x = T, all.y= FALSE)

Seurat_data_base <- deaSeurat_tot_base[,c("genes","set_number","clusters", "p_val")]
colnames(Seurat_data_base) <- c("genes","set_number","clusters","p_value_Seurat")

ground_truth_tot_subset <- merge(ground_truth_tot_subset,
                                 Seurat_data_base,
                                 by=c("genes","set_number","clusters"),
                                 all.x = T, all.y= FALSE)

Seurat_data_scTr <- deaSeurat_tot_scTr[,c("genes","set_number","clusters", "p_val")]
colnames(Seurat_data_scTr) <- c("genes","set_number","clusters","p_value_Seurat_scTr")

ground_truth_tot_subset <- merge(ground_truth_tot_subset,
                                 Seurat_data_scTr,
                                 by=c("genes","set_number","clusters"),
                                 all.x = T, all.y= FALSE)

Seurat_data_Bimod <- deaSeurat_tot_Bimod[,c("genes","set_number","clusters", "p_val")]
colnames(Seurat_data_Bimod) <- c("genes","set_number","clusters","p_value_Seurat_Bimod")

ground_truth_tot_subset <- merge(ground_truth_tot_subset,
                                 Seurat_data_Bimod,
                                 by=c("genes","set_number","clusters"),
                                 all.x = T, all.y= FALSE)


data_Monocle <- deaMonocle_tot[,c("genes","set_number","clusters", "marker_test_p_value")]
colnames(data_Monocle) <- c("genes","set_number","clusters","p_value_Monocle")

ground_truth_tot_subset <- merge(ground_truth_tot_subset,
                                 data_Monocle,
                                 by=c("genes","set_number","clusters"),
                                 all.x = T, all.y= FALSE)

data_Scanpy <- deaScanpy_tot[,c("genes","set_number","clusters", "pval")]
colnames(data_Scanpy) <- c("genes","set_number","clusters","p_value_Scanpy")

ground_truth_tot_subset <- merge(ground_truth_tot_subset,
                                 data_Scanpy,
                                 by=c("genes","set_number","clusters"),
                                 all.x = T, all.y= FALSE)

ground_truth_tot_subset <- ground_truth_tot_subset %>% mutate(lambda_bin = cut(genesLambda, breaks=50))

ground_truth_tot_subset[is.na(ground_truth_tot_subset)] <- 1

head(ground_truth_tot_subset)
genes set_number clusters value data_set p_value_COTAN
1 A330102I10Rik 2 E17.5-505 TRUE 5_Clusters_uneven 3.580400e-01
2 A630089N07Rik 2 E13.5-184 TRUE 5_Clusters_uneven 1.152963e-10
3 A830010M20Rik 1 E15.0-510 TRUE 5_Clusters_uneven 6.731088e-05
4 A930004D18Rik 2 E13.5-184 TRUE 5_Clusters_uneven 1.847177e-04
5 Aaed1 3 E13.5-187 TRUE 5_Clusters_uneven 1.613229e-05
6 Abat 2 E15.0-428 TRUE 5_Clusters_uneven 4.997729e-07
genesLambda p_value_Seurat p_value_Seurat_scTr p_value_Seurat_Bimod
1 0.03431373 1.000000e+00 1.000000e+00 2.718294e-04
2 0.06617647 1.632048e-12 7.812652e-13 1.731541e-09
3 0.07175926 2.117000e-07 1.205805e-07 1.913975e-06
4 0.06740196 1.841516e-05 1.287232e-05 4.368518e-06
5 0.01704158 8.730213e-07 7.218352e-07 3.744192e-05
6 0.05514706 2.469818e-05 3.984286e-05 5.906623e-04
p_value_Monocle p_value_Scanpy lambda_bin
1 1.935776e-01 0.793509146 (0.0341,0.0641]
2 1.328598e-09 0.004754579 (0.0641,0.0941]
3 2.189873e-06 0.024391612 (0.0641,0.0941]
4 1.947179e-04 0.074967388 (0.0641,0.0941]
5 2.742404e-03 0.311500465 (0.00259,0.0341]
6 6.040666e-05 0.102450927 (0.0341,0.0641]bins <- levels(ground_truth_tot_subset$lambda_bin)
bins <- bins[!is.na(bins)]
forBarChart <- as.data.frame(matrix(nrow = length(bins),ncol = 7,data = 0))
colnames(forBarChart) <- c("bins","COTAN","Seurat","Seurat_Bimod","Seurat_scTr","Monocle", "Scanpy")
forBarChart$bins <- bins
rownames(forBarChart) <- forBarChart$bins
#p_val_threshold <- 0.05
for (i in as.vector(forBarChart$bins)) {
forBarChart[ i,"COTAN"] <- sum(ground_truth_tot_subset$lambda_bin == i & ground_truth_tot_subset$p_value_COTAN <= cotan.threshold.pval)
forBarChart[ i,"Seurat"] <- sum(ground_truth_tot_subset$lambda_bin == i & ground_truth_tot_subset$p_value_Seurat <= seurat.threshold.pval)
forBarChart[ i,"Seurat_Bimod"] <- sum(ground_truth_tot_subset$lambda_bin == i & ground_truth_tot_subset$p_value_Seurat_Bimod <= seurat_bimod.threshold.pval)
forBarChart[ i,"Seurat_scTr"] <- sum(ground_truth_tot_subset$lambda_bin == i & ground_truth_tot_subset$p_value_Seurat_scTr <= Seurat_scTr.threshold.pval)
forBarChart[ i,"Monocle"] <- sum(ground_truth_tot_subset$lambda_bin == i & ground_truth_tot_subset$p_value_Monocle <= monocle.threshold.pval)
forBarChart[ i,"Scanpy"] <- sum(ground_truth_tot_subset$lambda_bin == i & ground_truth_tot_subset$p_value_Scanpy <= scanpy.threshold.pval)
}
temp.bin <- as.data.frame(str_split(forBarChart$bins,pattern = ",",simplify = T))
temp.bin[,1] <- as.numeric(str_remove(temp.bin[,1],pattern = "[(]"))
temp.bin[,2] <- as.numeric(str_remove(temp.bin[,2],pattern = "[]]"))
forBarChart$bins <- round(rowMeans(temp.bin),digits = 2)
forBarChart <- forBarChart[rowSums(forBarChart[,2:ncol(forBarChart)]) > 0,]
forBarChart.perc <- forBarChart[1:8,]
forBarChart.perc$tot <- rowSums(forBarChart.perc[,2:ncol(forBarChart.perc)])
forBarChart.perc[,2:(ncol(forBarChart.perc)-1)] <- round(forBarChart.perc[,2:(ncol(forBarChart.perc)-1)]/forBarChart.perc$tot,digits = 4)
forBarChart.perc <- pivot_longer(forBarChart.perc,
cols = 2:(ncol(forBarChart.perc)-1),
names_to = "Methods")
forBarChart.number <- pivot_longer(forBarChart[1:8,],
cols = 2:(ncol(forBarChart)),
names_to = "Methods")
colnames(forBarChart.number) <- c("bins","Methods", "valueOriginal")
forBarChart.perc <- merge(forBarChart.perc,forBarChart.number, by = c("bins","Methods"))
barChart <- ggplot(forBarChart.perc,aes(x=bins,y=value,fill=Methods))+
geom_bar(stat="identity")+
geom_text(aes(label = valueOriginal),
position = position_stack(vjust = 0.5), size=3)+
scale_fill_manual(
values = methods.color)+
theme_light()+
scale_x_continuous(breaks =forBarChart.perc$bins)+
theme(axis.title.y=element_blank(),axis.title.x=element_blank(),
legend.position="none",axis.text.x = element_text(angle = 45, hjust=1)
)+
scale_y_continuous(labels = scales::percent_format())
pdf(paste0(dirOut,"EnrichedGenesForExpressionLevel.pdf"),height = 3,width = 5)
barChart
dev.off()png
2 plot(barChart)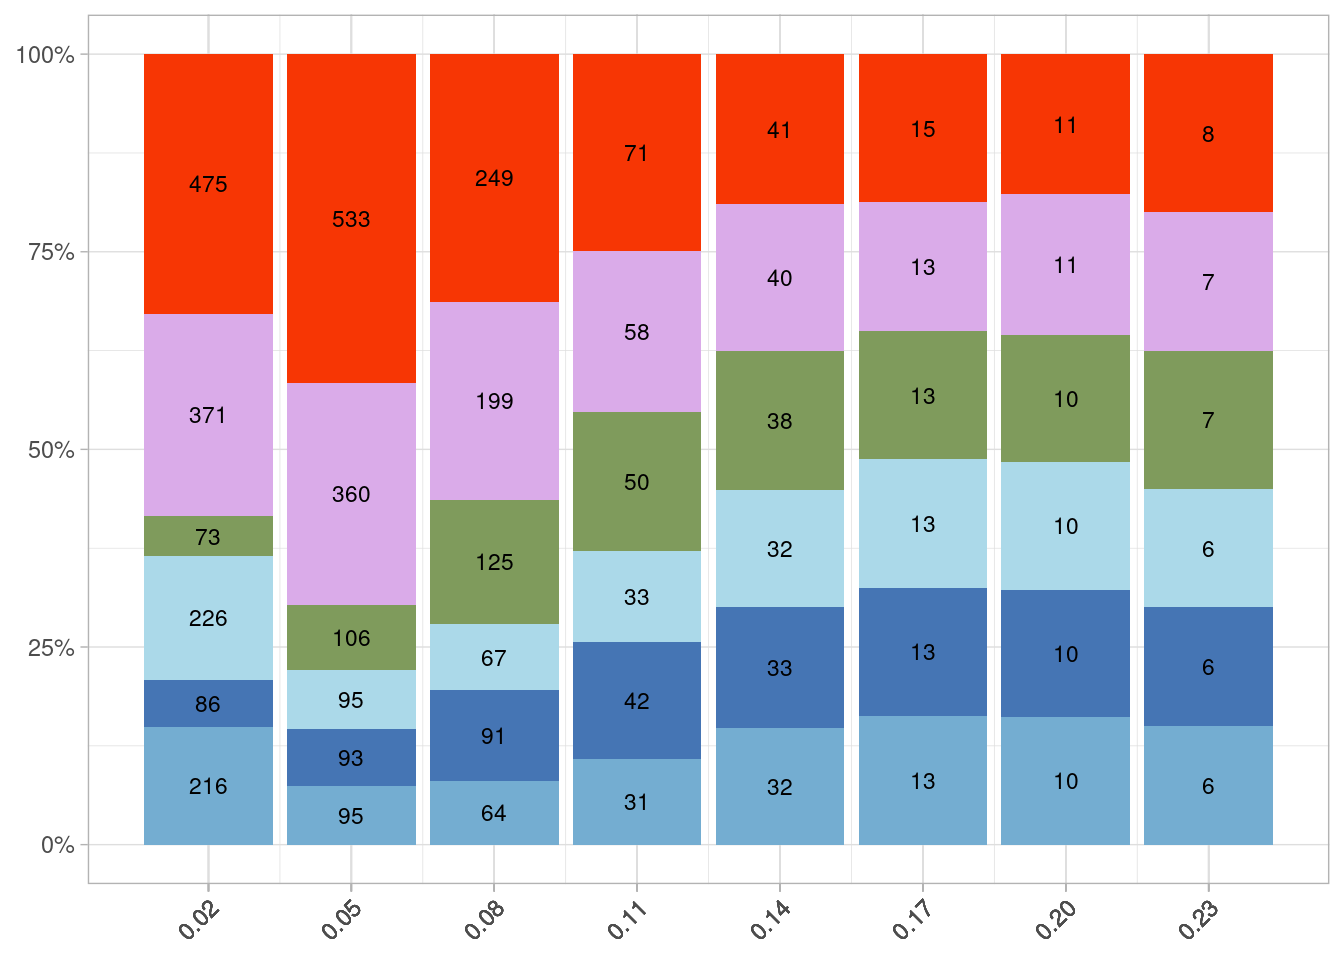
plot.with.inset <-
  ggdraw() +
  draw_plot(plot3) +
  draw_plot(as_ggplot(lg), x = 0.18, y = 0.1, width = 0.2, height = .45)+
  draw_plot(barChart, x = 0.78, y = 0.09, width = 0.22, height = .5)

pdf(paste0(dirOut,"Plot3WihtGenesExLevel.pdf"),height = 5,width = 15)
plot(plot.with.inset)
dev.off()
png
2 plot(plot.with.inset)