library(COTAN)
library(stringr)
library(tidyverse)Original Clusters Distance Evaluation
Extract the row matrix for each cluster
This is done on the La Manno Mouse Brain dataset (2021)
E13.5
E13.5Clusters.code <- c(432,187,434,184,437,510)

fb135Obj <- readRDS(file = file.path("Data/MouseCortexFromLoom/", "e13.5_ForebrainDorsal.cotan.RDS"))

sampleCondition <- getMetadataElement(fb135Obj, datasetTags()[["cond"]])

for (cl in E13.5Clusters.code) {
  cells <- names(getClusters(fb135Obj,
      clName = "original.clusters")[getClusters(fb135Obj,
                          clName = "original.clusters") == cl])

CLRawData <- getRawData(fb135Obj)[,cells]

saveRDS(CLRawData,file = paste0("Data/MouseCortexFromLoom/SingleClusterRawData/Cl",cl,sampleCondition,"RawData.RDS"))
}
E15.0
E15.0Clusters.code <- c(432,509,510,508,428,434,437)

fb150Obj <- readRDS(file = file.path("Data/MouseCortexFromLoom/", "e15.0_ForebrainDorsal.cotan.RDS"))

sampleCondition <- getMetadataElement(fb150Obj, datasetTags()[["cond"]])

for (cl in E15.0Clusters.code) {
  cells <- names(getClusters(fb150Obj,
      clName = "original.clusters")[getClusters(fb150Obj,
                          clName = "original.clusters") == cl])

CLRawData <- getRawData(fb150Obj)[,cells]

saveRDS(CLRawData,file = paste0("Data/MouseCortexFromLoom/SingleClusterRawData/Cl",cl,sampleCondition,"RawData.RDS"))
}
E17.5
E17.5Clusters.code <- c(516,505)

fb175Obj <- readRDS(file = file.path("Data/MouseCortexFromLoom/", "E17.5_ForebrainDorsal.cotan.RDS"))

sampleCondition <- getMetadataElement(fb175Obj, datasetTags()[["cond"]])

for (cl in E17.5Clusters.code) {
  cells <- names(getClusters(fb175Obj,
      clName = "original.clusters")[getClusters(fb175Obj,
                          clName = "original.clusters") == cl])

CLRawData <- getRawData(fb175Obj)[,cells]

saveRDS(CLRawData,file = paste0("Data/MouseCortexFromLoom/SingleClusterRawData/Cl",cl,sampleCondition,"RawData.RDS"))
}
Defining the two distances
To roughly determine the cluster distances we decided to test two simple Euclidean distances:
over the mean of the 0/1 raw matrix
over the \(1-e^{-\lambda}\) where \(\lambda\) is the average expression for the genes.
ClFiles <- list.files("Data/MouseCortexFromLoom/SingleClusterRawData/")

tot.Df.ZeroOne <- NA
tot.Df.Lambda <- NA
for(Fl in ClFiles) {
  print(Fl)
  cl <- str_split(Fl,pattern = "_",simplify = T)[1]
  data <- readRDS(paste0("Data/MouseCortexFromLoom/SingleClusterRawData/",
                         Fl))

  obj <- COTAN(data)

  ZeroOne <- rowMeans(as.matrix(getZeroOneProj(obj)))
  tot.Df.ZeroOne <- merge(tot.Df.ZeroOne,ZeroOne,by = 0,all = T)
  tot.Df.ZeroOne[is.na(tot.Df.ZeroOne)] <- 0
  colnames(tot.Df.ZeroOne)[ncol(tot.Df.ZeroOne)] <- cl
  tot.Df.ZeroOne <- column_to_rownames(tot.Df.ZeroOne,var = "Row.names")

  obj <- estimateLambdaLinear(obj)
  Lambda <- getLambda(obj)
  tot.Df.Lambda <- merge(tot.Df.Lambda,1-exp(-Lambda),by = 0, all = T)
  tot.Df.Lambda[is.na(tot.Df.Lambda)] <- 0
  colnames(tot.Df.Lambda)[ncol(tot.Df.Lambda)] <- cl
  tot.Df.Lambda <- column_to_rownames(tot.Df.Lambda,var = "Row.names")

}
tot.Df.Lambda <- tot.Df.Lambda[,2:ncol(tot.Df.Lambda)]
tot.Df.ZeroOne <- tot.Df.ZeroOne[,2:ncol(tot.Df.ZeroOne)]

tot.Df.Lambda <- tot.Df.Lambda[2:nrow(tot.Df.Lambda),]
tot.Df.ZeroOne <- tot.Df.ZeroOne[2:nrow(tot.Df.Lambda),]


head(tot.Df.Lambda)
head(tot.Df.ZeroOne)saveRDS(tot.Df.Lambda, "Data/MouseCortexFromLoom/ClustersDistances/Tot.Df.Lambda.RDS")
saveRDS(tot.Df.ZeroOne, "Data/MouseCortexFromLoom/ClustersDistances/Tot.Df.ZeroOne.RDS")library(ComplexHeatmap)
distance.df.Lambda <- as.matrix(dist(t(tot.Df.Lambda),diag = T,upper = T))
HeatmapLambda <- Heatmap(distance.df.Lambda,
name = "Lambda\ndistance",
cell_fun = function(j, i, x, y, width, height, fill)
{
grid.text(sprintf("%.1f", distance.df.Lambda[i, j]), x, y, gp = gpar(fontsize = 10))
},
show_row_dend = F,
show_row_names = F)
pdf("Results/ClustersDistances/HeatmapLambda.pdf",width = 6,height = 5)
plot(HeatmapLambda)
dev.off()png
2 plot(HeatmapLambda)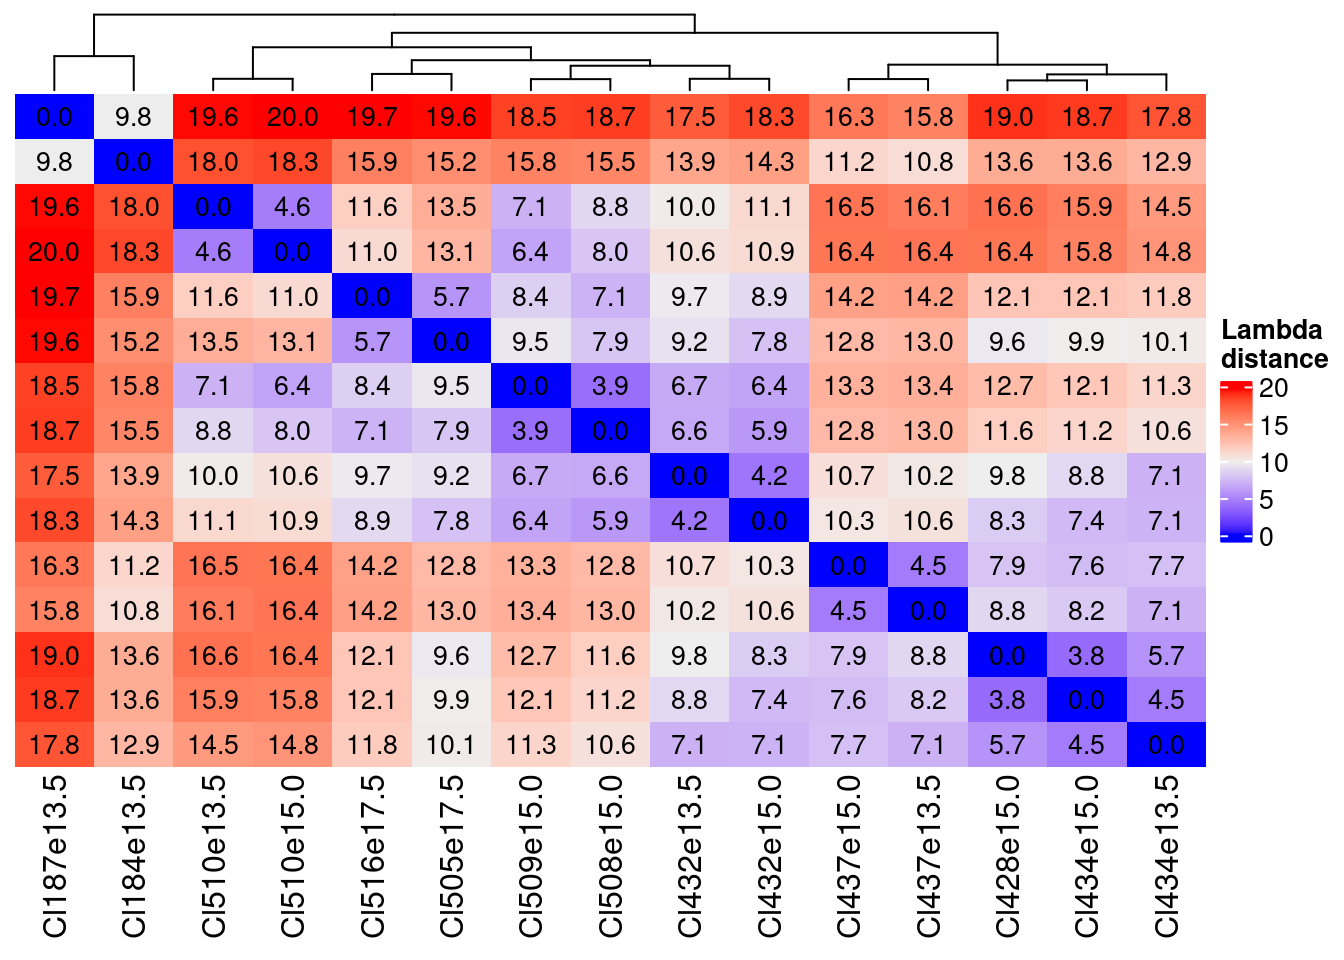
distance.df.ZeroOne <- as.matrix(dist(t(tot.Df.ZeroOne),diag = T,upper = T))

HeatmapZeorOne <- Heatmap(distance.df.ZeroOne,
        name = "ZeroOne\ndistance",
        cell_fun = function(j, i, x, y, width, height, fill)
        {
          grid.text(sprintf("%.1f", distance.df.ZeroOne[i, j]), x, y, gp = gpar(fontsize = 10))
        },
        show_row_dend = F,
        show_row_names = F)

pdf("Results/ClustersDistances/HeatmapZeorOne.pdf",width = 6,height = 5)
plot(HeatmapZeorOne)
dev.off()
png
2 plot(HeatmapZeorOne)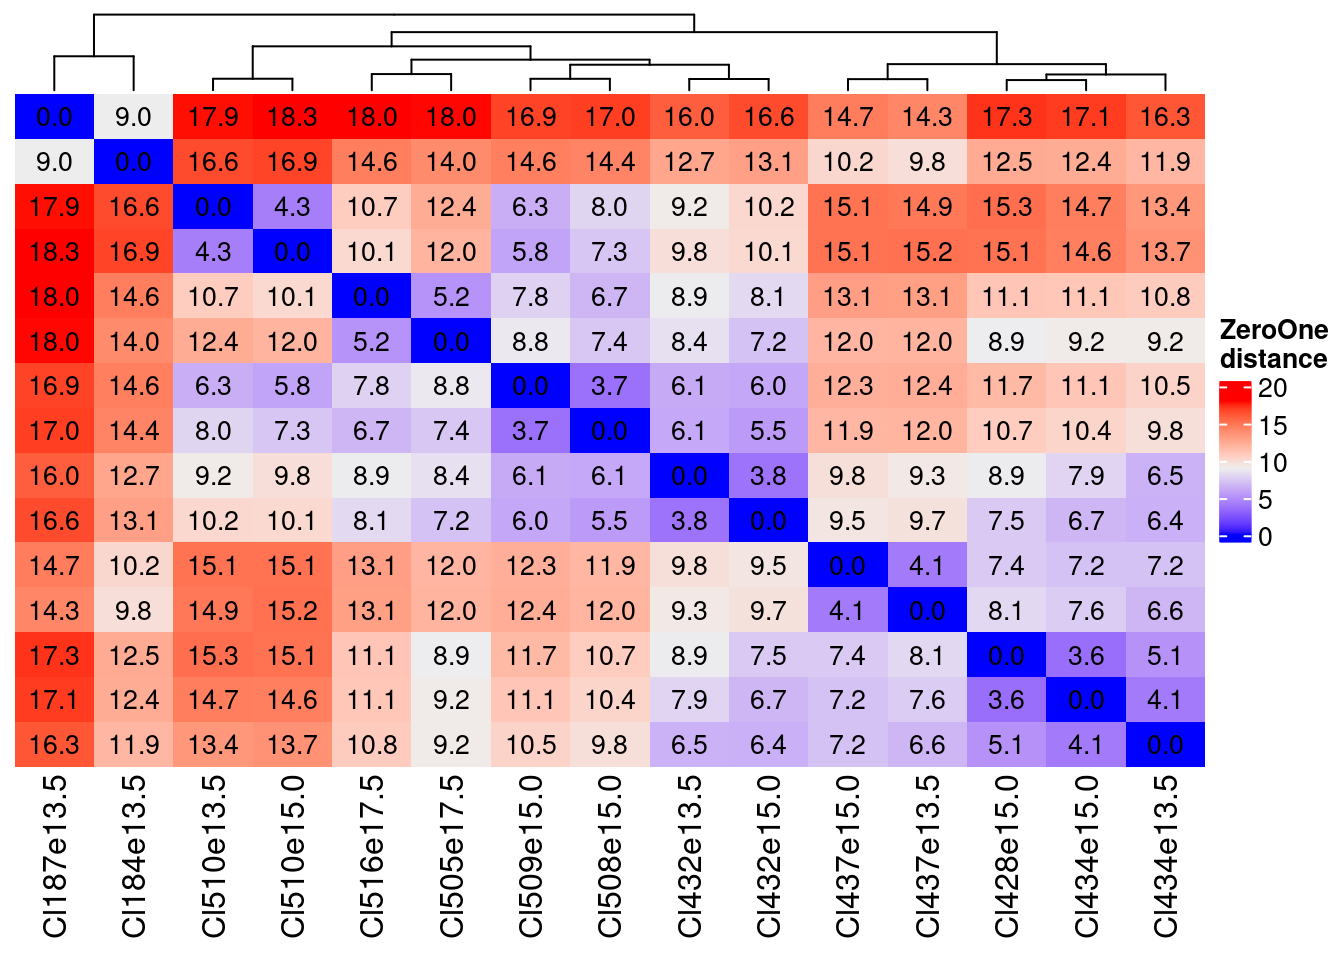
The distances are very similar with the Zero One a little lower as values…
distance.df.Lambda.Plot <- rownames_to_column(as.data.frame(distance.df.Lambda),
                                              var = "Cl.1")
distance.df.Lambda.Plot <-pivot_longer(distance.df.Lambda.Plot,
                                       cols = !Cl.1,
                                       names_to = "Cl.2",
                                       values_to = "Lambda.Dist")

distance.df.ZeroOne.Plot <- rownames_to_column(as.data.frame(distance.df.ZeroOne),
                                              var = "Cl.1")
distance.df.ZeroOne.Plot <-pivot_longer(distance.df.ZeroOne.Plot,
                                       cols = !Cl.1,
                                       names_to = "Cl.2",
                                       values_to = "ZeroOne.Dist")

distance.df.Tot <- merge(distance.df.ZeroOne.Plot,distance.df.Lambda.Plot,by= c("Cl.1","Cl.2"),all=T)

ggplot(as.data.frame(distance.df.Tot),aes(x=ZeroOne.Dist, y=Lambda.Dist))+geom_point()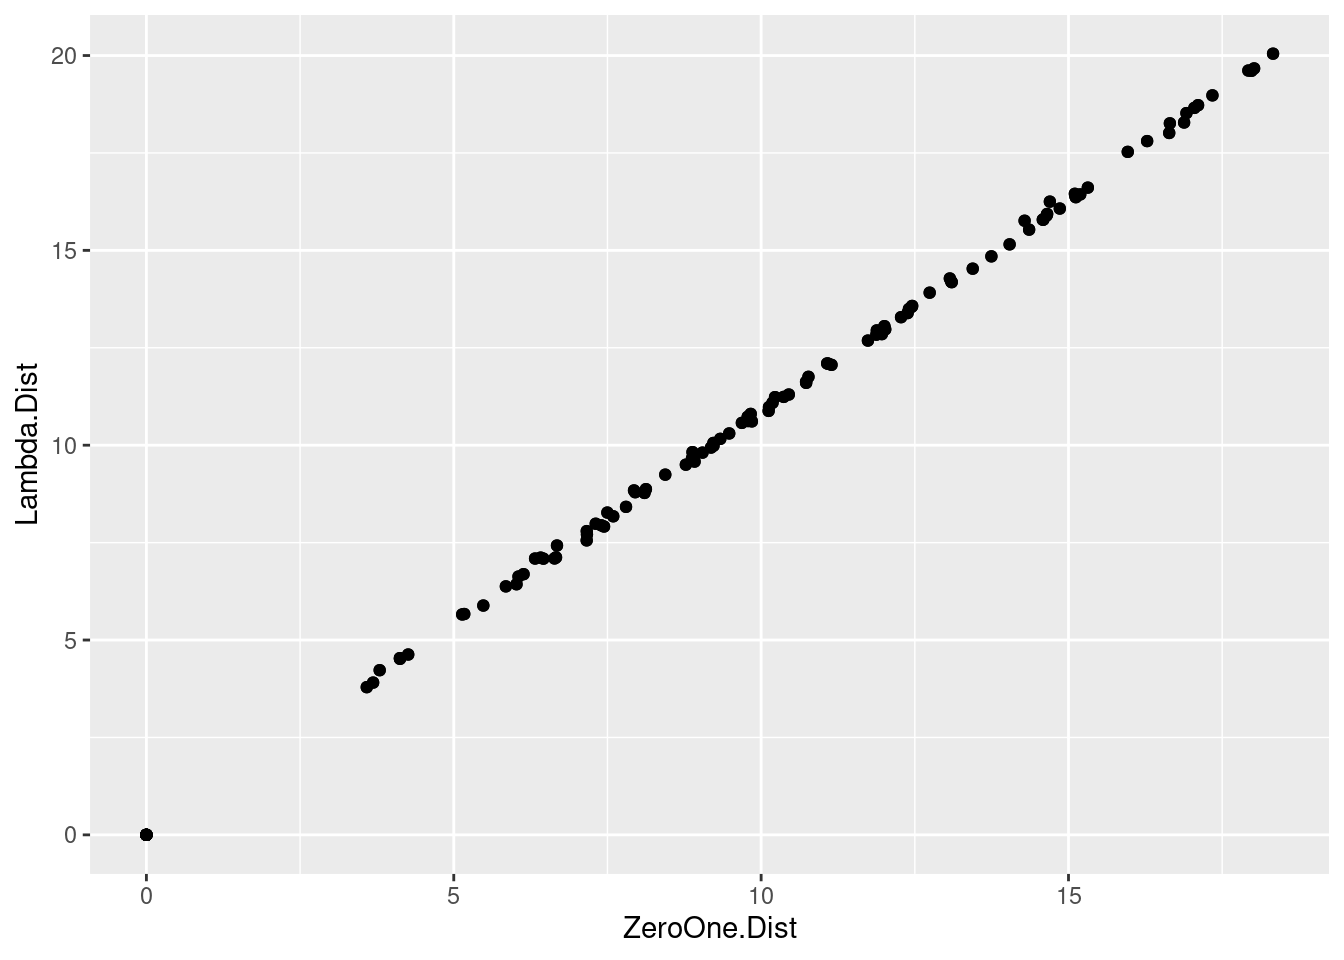
So for what we are using it is the same.
The key information is that we can define couple of, in one case, triplets of very near clusters:
- Cl510e13.5 and Cl510e15.0
- Cl516e17.5 and Cl505e17.5
- Cl509e15.0 and Cl508e15.0 which are also similar to Cl432e13.5 and Cl432e15.0
- Cl432e13.5 and Cl432e15.0
- Cl437e13.5 and Cl437e15.0
- Cl428e15.0, Cl434e15.0 and Cl434e13.5
Based on these distances we can consider three thresholds (with number of cluster pair):
less than 7 (first quartile)
sum(distance.df.ZeroOne < 7.1 & distance.df.ZeroOne > 0)/2[1] 19between 9 and 11 (around median)
sum(distance.df.ZeroOne > 9 & distance.df.ZeroOne < 11)/2[1] 20more than 13 (3rd quartile)
sum(distance.df.ZeroOne > 13)/2[1] 32
sessionInfo()R version 4.4.0 (2024-04-24)
Platform: x86_64-pc-linux-gnu
Running under: Ubuntu 20.04.6 LTS
Matrix products: default
BLAS: /usr/lib/x86_64-linux-gnu/openblas-pthread/libblas.so.3
LAPACK: /usr/lib/x86_64-linux-gnu/openblas-pthread/liblapack.so.3; LAPACK version 3.9.0
locale:
[1] LC_CTYPE=C.UTF-8 LC_NUMERIC=C LC_TIME=C.UTF-8
[4] LC_COLLATE=C.UTF-8 LC_MONETARY=C.UTF-8 LC_MESSAGES=C.UTF-8
[7] LC_PAPER=C.UTF-8 LC_NAME=C LC_ADDRESS=C
[10] LC_TELEPHONE=C LC_MEASUREMENT=C.UTF-8 LC_IDENTIFICATION=C
time zone: Europe/Rome
tzcode source: system (glibc)
attached base packages:
[1] grid stats graphics grDevices utils datasets methods
[8] base
other attached packages:
[1] ComplexHeatmap_2.20.0 lubridate_1.9.3 forcats_1.0.0
[4] dplyr_1.1.4 purrr_1.0.2 readr_2.1.5
[7] tidyr_1.3.1 tibble_3.2.1 ggplot2_3.5.1
[10] tidyverse_2.0.0 stringr_1.5.1 COTAN_2.5.2
loaded via a namespace (and not attached):
[1] RcppAnnoy_0.0.22 splines_4.4.0
[3] later_1.3.2 polyclip_1.10-6
[5] fastDummies_1.7.3 lifecycle_1.0.4
[7] doParallel_1.0.17 globals_0.16.3
[9] lattice_0.22-6 MASS_7.3-60.2
[11] dendextend_1.17.1 magrittr_2.0.3
[13] plotly_4.10.4 rmarkdown_2.27
[15] yaml_2.3.8 httpuv_1.6.15
[17] Seurat_5.1.0 sctransform_0.4.1
[19] spam_2.10-0 askpass_1.2.0
[21] sp_2.1-4 spatstat.sparse_3.0-3
[23] reticulate_1.37.0 cowplot_1.1.3
[25] pbapply_1.7-2 RColorBrewer_1.1-3
[27] abind_1.4-5 zlibbioc_1.50.0
[29] Rtsne_0.17 BiocGenerics_0.50.0
[31] circlize_0.4.16 IRanges_2.38.0
[33] S4Vectors_0.42.0 ggrepel_0.9.5
[35] irlba_2.3.5.1 listenv_0.9.1
[37] spatstat.utils_3.0-4 umap_0.2.10.0
[39] goftest_1.2-3 RSpectra_0.16-1
[41] spatstat.random_3.2-3 dqrng_0.4.0
[43] fitdistrplus_1.1-11 parallelly_1.37.1
[45] DelayedMatrixStats_1.26.0 leiden_0.4.3.1
[47] codetools_0.2-20 DelayedArray_0.30.1
[49] tidyselect_1.2.1 shape_1.4.6.1
[51] farver_2.1.2 ScaledMatrix_1.12.0
[53] viridis_0.6.5 matrixStats_1.3.0
[55] stats4_4.4.0 spatstat.explore_3.2-7
[57] jsonlite_1.8.8 GetoptLong_1.0.5
[59] progressr_0.14.0 ggridges_0.5.6
[61] survival_3.6-4 iterators_1.0.14
[63] foreach_1.5.2 tools_4.4.0
[65] ica_1.0-3 Rcpp_1.0.12
[67] glue_1.7.0 gridExtra_2.3
[69] SparseArray_1.4.5 xfun_0.44
[71] MatrixGenerics_1.16.0 ggthemes_5.1.0
[73] withr_3.0.0 fastmap_1.2.0
[75] fansi_1.0.6 openssl_2.2.0
[77] digest_0.6.35 rsvd_1.0.5
[79] timechange_0.3.0 parallelDist_0.2.6
[81] R6_2.5.1 mime_0.12
[83] colorspace_2.1-0 Cairo_1.6-2
[85] scattermore_1.2 tensor_1.5
[87] spatstat.data_3.0-4 utf8_1.2.4
[89] generics_0.1.3 data.table_1.15.4
[91] httr_1.4.7 htmlwidgets_1.6.4
[93] S4Arrays_1.4.1 uwot_0.2.2
[95] pkgconfig_2.0.3 gtable_0.3.5
[97] lmtest_0.9-40 XVector_0.44.0
[99] htmltools_0.5.8.1 dotCall64_1.1-1
[101] clue_0.3-65 SeuratObject_5.0.2
[103] scales_1.3.0 png_0.1-8
[105] knitr_1.46 rstudioapi_0.16.0
[107] tzdb_0.4.0 reshape2_1.4.4
[109] rjson_0.2.21 nlme_3.1-164
[111] zoo_1.8-12 GlobalOptions_0.1.2
[113] KernSmooth_2.23-24 parallel_4.4.0
[115] miniUI_0.1.1.1 RcppZiggurat_0.1.6
[117] pillar_1.9.0 vctrs_0.6.5
[119] RANN_2.6.1 promises_1.3.0
[121] BiocSingular_1.20.0 beachmat_2.20.0
[123] xtable_1.8-4 cluster_2.1.6
[125] evaluate_0.23 zeallot_0.1.0
[127] cli_3.6.2 compiler_4.4.0
[129] rlang_1.1.3 crayon_1.5.2
[131] future.apply_1.11.2 labeling_0.4.3
[133] plyr_1.8.9 stringi_1.8.4
[135] viridisLite_0.4.2 deldir_2.0-4
[137] BiocParallel_1.38.0 assertthat_0.2.1
[139] munsell_0.5.1 lazyeval_0.2.2
[141] spatstat.geom_3.2-9 PCAtools_2.16.0
[143] Matrix_1.7-0 RcppHNSW_0.6.0
[145] hms_1.1.3 patchwork_1.2.0
[147] sparseMatrixStats_1.16.0 future_1.33.2
[149] shiny_1.8.1.1 ROCR_1.0-11
[151] Rfast_2.1.0 igraph_2.0.3
[153] RcppParallel_5.1.7