library(ggplot2)
library(tibble)
library(zeallot)
library(COTAN)

options(parallelly.fork.enable = TRUE)

outDir <- "Data/MouseCortexFromLoom/"

setLoggingLevel(1)
setLoggingFile(file.path(outDir, "ForebrainDorsal_E135-analysis.log"))Forebrain Dorsal E13.5 Data-set Anaysis
Read the already created COTAN object
fb135Obj <- readRDS("Data/MouseCortexFromLoom/SourceData/e13.5_ForebrainDorsal.cotan.RDS")
sampleCondition <- getMetadataElement(fb135Obj, datasetTags()[["cond"]])

sampleCondition
[1] "e13.5_ForebrainDorsal"Inspect cells’ sizes
cellSizePlot(fb135Obj, splitPattern = ":", numCol = 1)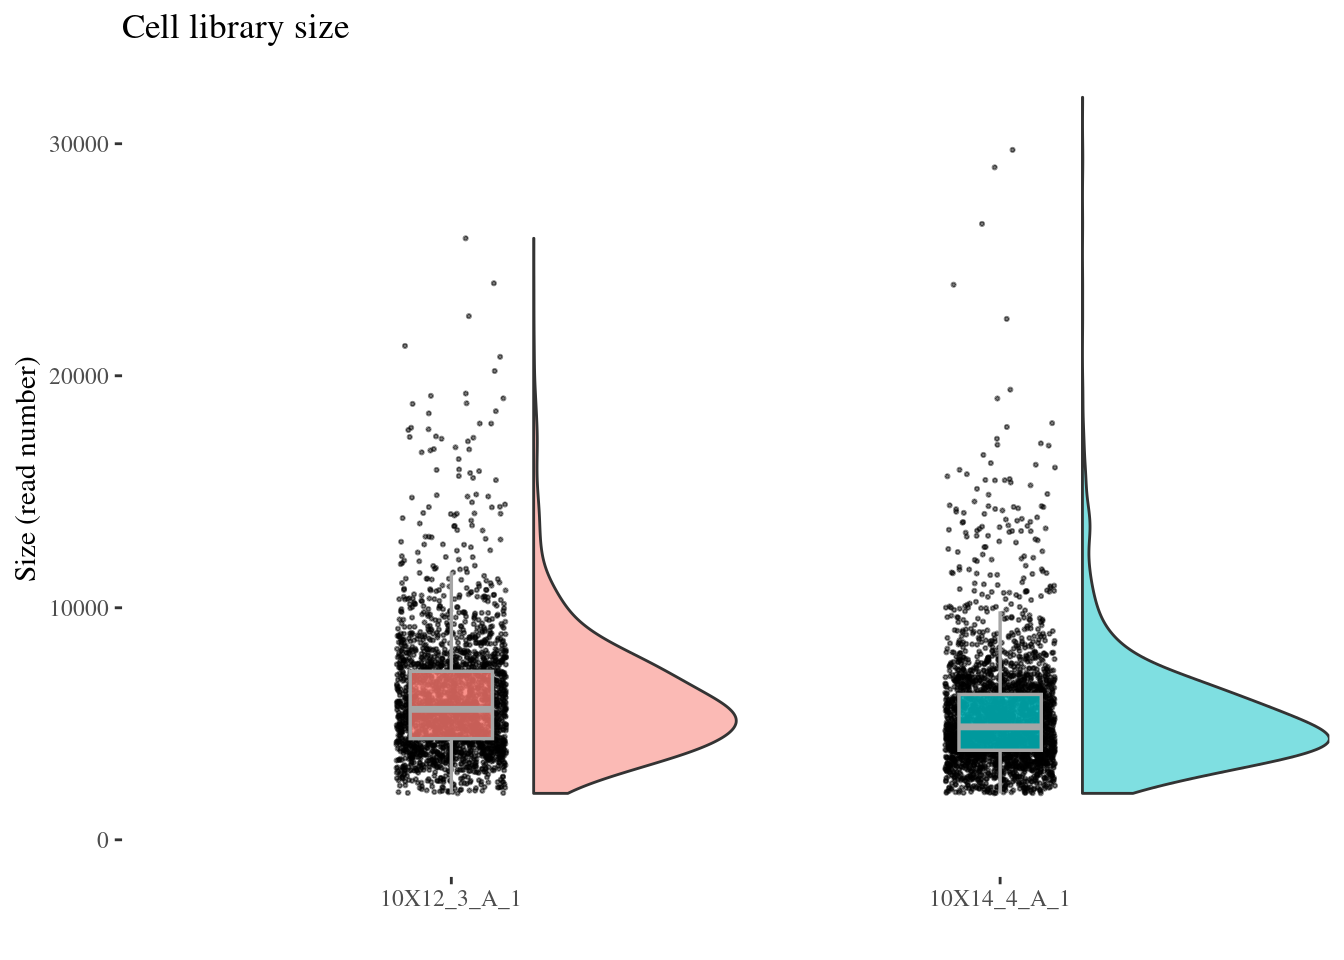
Drop cells with too many ritz reads as they are probably duplets
cellsSizeThr <- 10000
fb135Obj <- addElementToMetaDataset(fb135Obj, "Cells size threshold", cellsSizeThr)

cells_to_rem <- getCells(fb135Obj)[getCellsSize(fb135Obj) > cellsSizeThr]
fb135Obj <- dropGenesCells(fb135Obj, cells = cells_to_rem)

cellSizePlot(fb135Obj, splitPattern = ":", numCol = 1)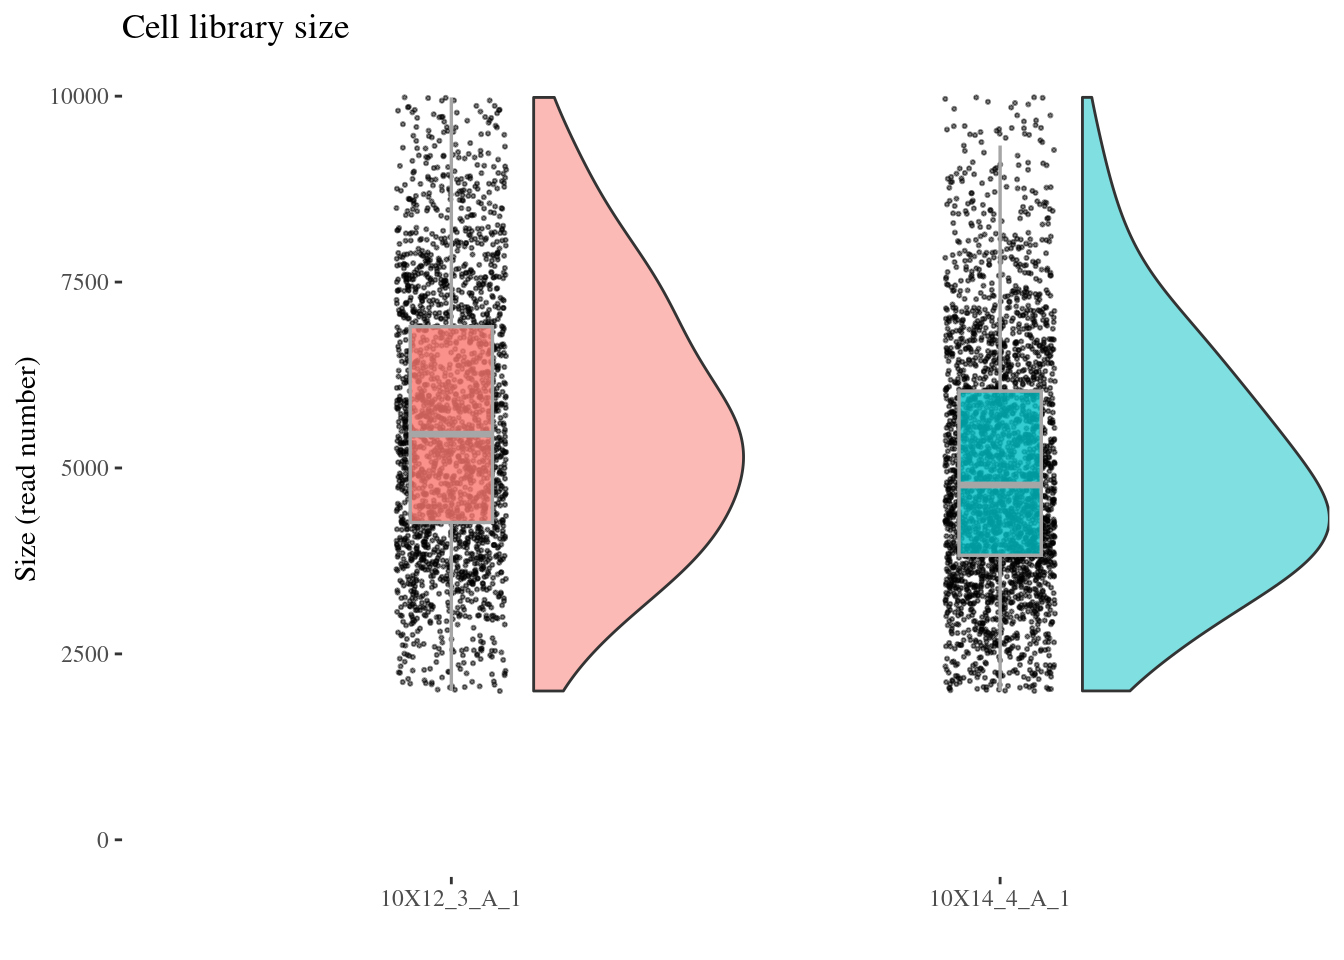
Inspect the number of expressed genes per cell
genesSizePlot(fb135Obj, splitPattern = ":", numCol = 1)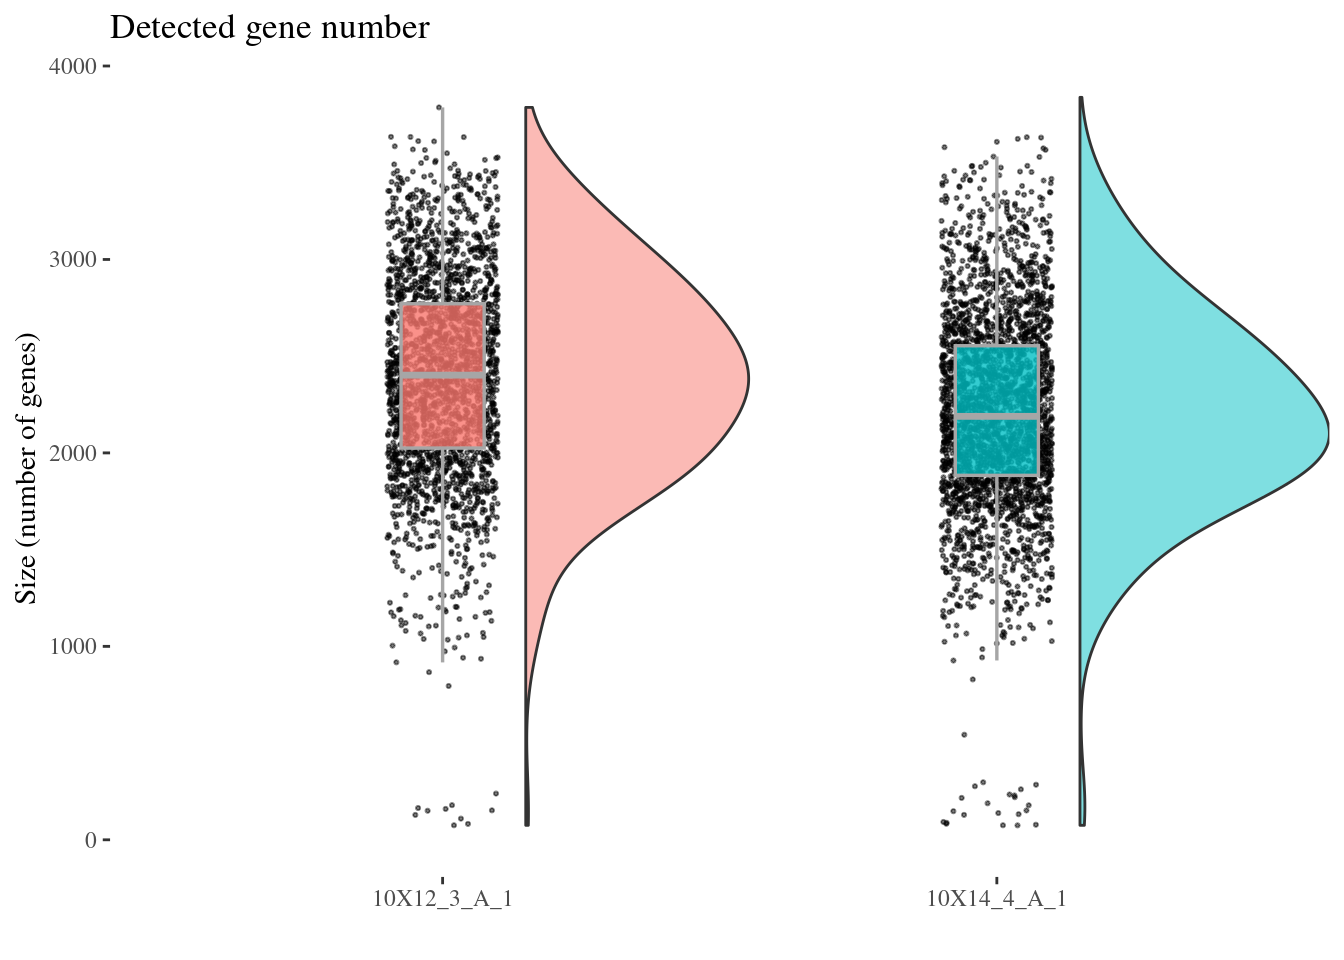
Drop cells with too low genes expession as they are probably dead
genesSizeLowThr <- 700
fb135Obj <- addElementToMetaDataset(fb135Obj, "Num genes low threshold", genesSizeLowThr)

numExprGenes <- getNumGenes(fb135Obj)
cells_to_rem <- names(numExprGenes)[numExprGenes < genesSizeLowThr]
fb135Obj <- dropGenesCells(fb135Obj, cells = cells_to_rem)

genesSizePlot(fb135Obj, splitPattern = ":", numCol = 1)
Check number of mitocondrial genes expressed in each cell
mitGenesPattern <- "^mt."
getGenes(fb135Obj)[grep(mitGenesPattern, getGenes(fb135Obj))]
[1] "mt.Co1" "mt.Co3" "mt.Nd4" "mt.Nd5" "mt.Nd1" "mt.Nd2" "mt.Atp6"c(mitPlot, mitSizes) %<-%
mitochondrialPercentagePlot(fb135Obj, genePrefix = mitGenesPattern,
splitPattern = ":", numCol = 1)
plot(mitPlot)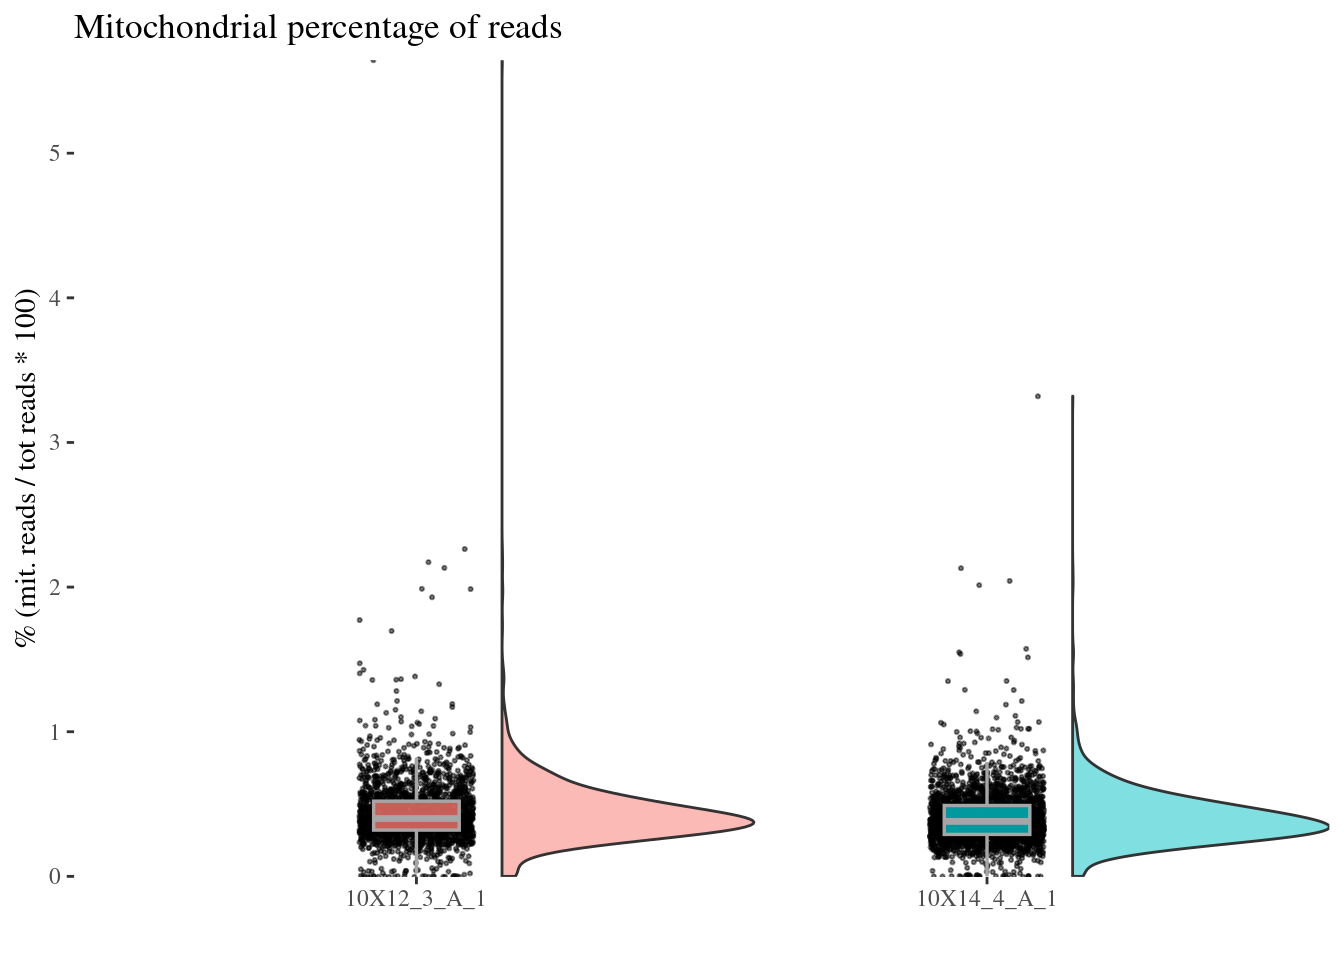
Cells with a too high percentage of mitocondrial genes are likely dead (or at the last problematic) cells. So we drop them!
mitPercThr <- 1.0
fb135Obj <- addElementToMetaDataset(fb135Obj, "Mitoc. perc. threshold", mitPercThr)
cells_to_rem <- rownames(mitSizes)[mitSizes[["mit.percentage"]] > mitPercThr]
fb135Obj <- dropGenesCells(fb135Obj, cells = cells_to_rem)
c(mitPlot, mitSizes) %<-%
  mitochondrialPercentagePlot(fb135Obj, genePrefix = mitGenesPattern,
                              splitPattern = ":", numCol = 1)

plot(mitPlot)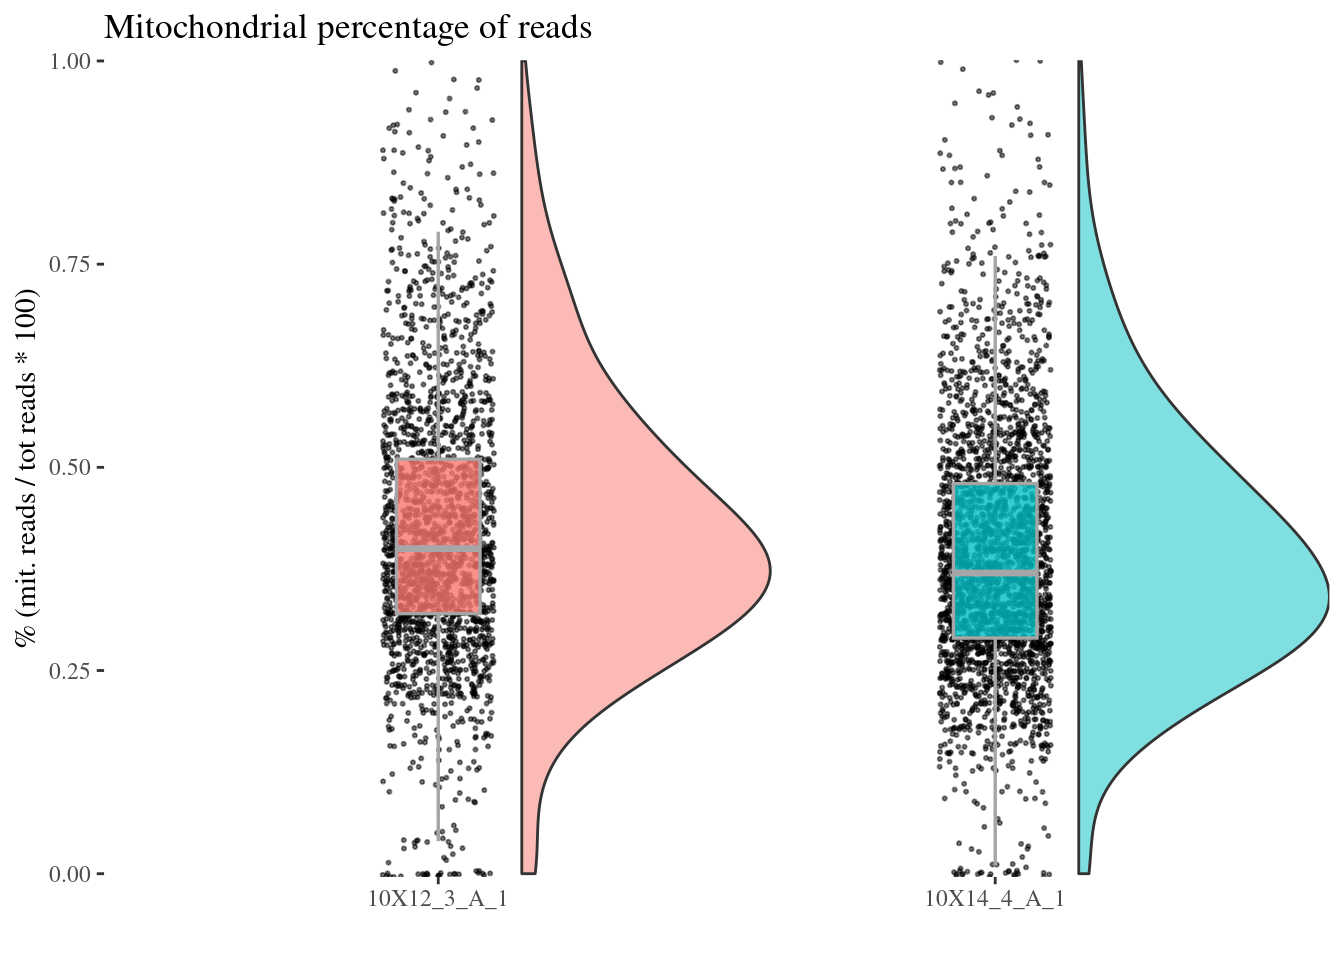
Check no further outliers after all the culling
cellSizePlot(fb135Obj, splitPattern = ":", numCol = 1)
genesSizePlot(fb135Obj, splitPattern = ":", numCol = 1)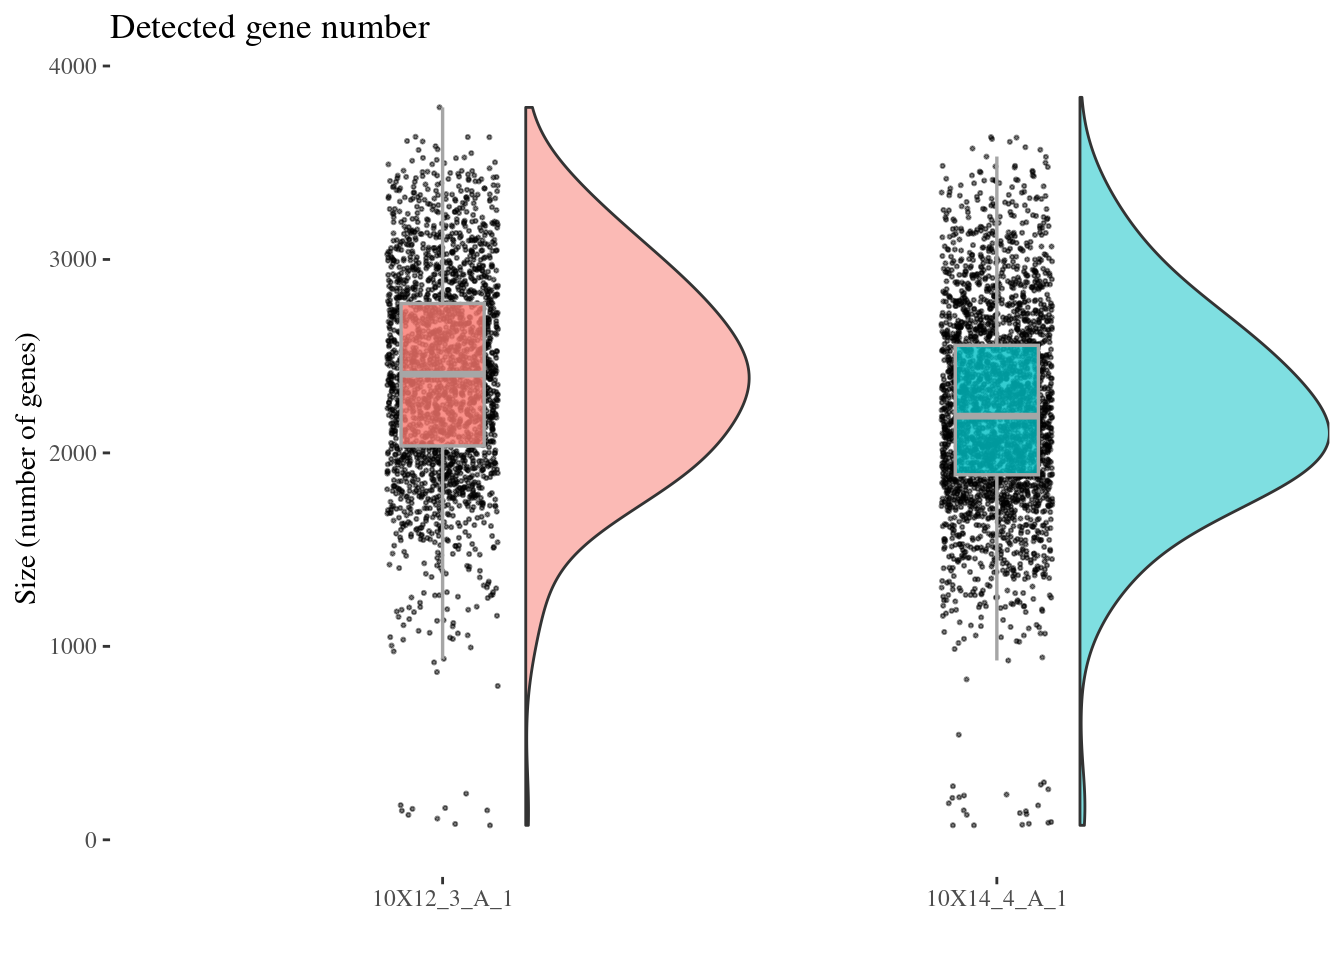
Clean: round 1
fb135Obj <- clean(fb135Obj)

c(pcaCellsPlot, pcaCellsData, genesPlot, UDEPlot, nuPlot) %<-% cleanPlots(fb135Obj)

plot(pcaCellsPlot)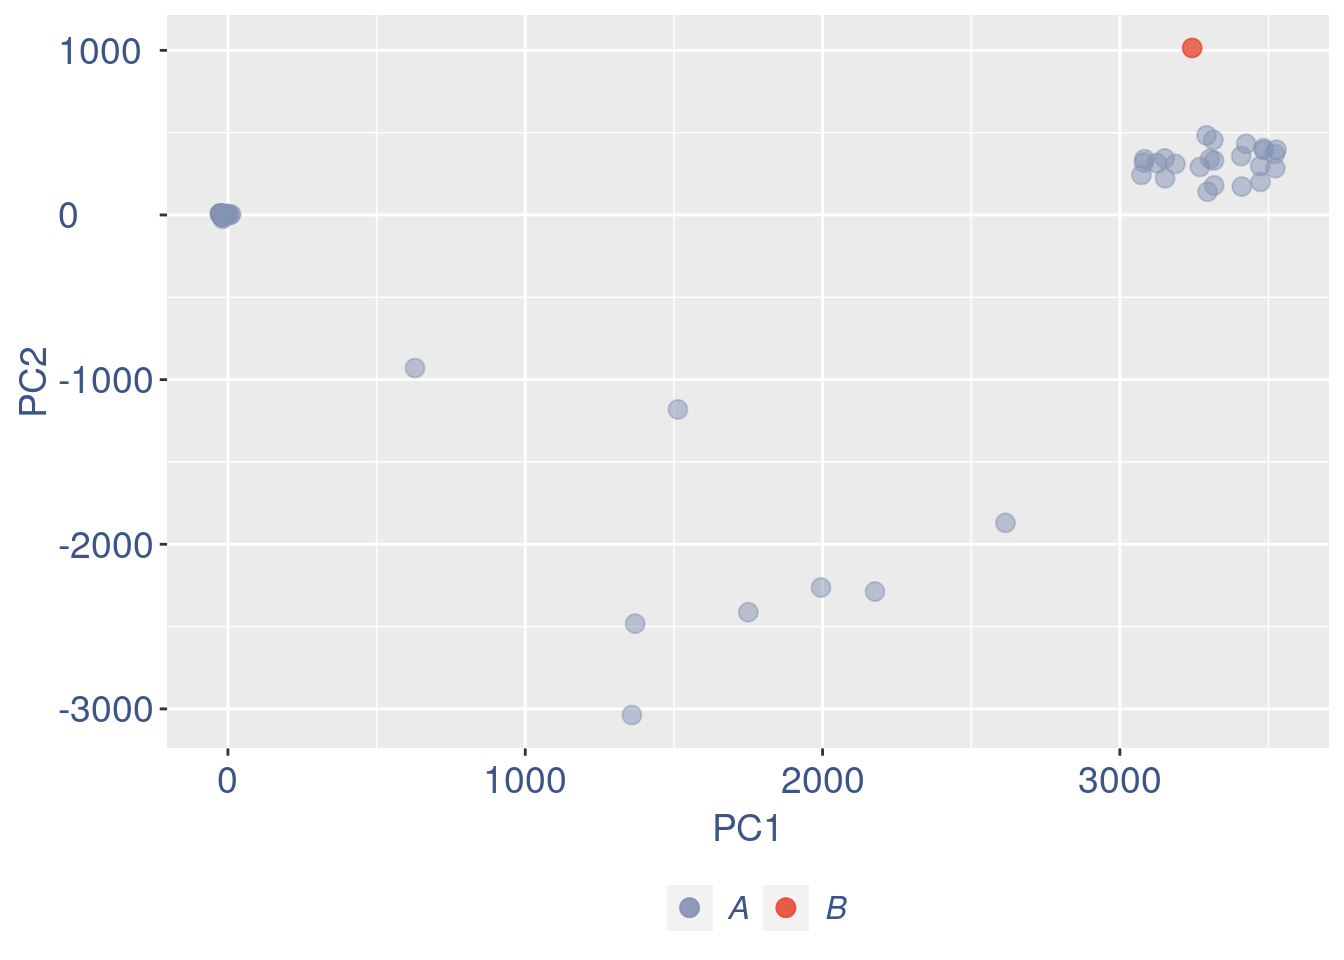
plot(genesPlot)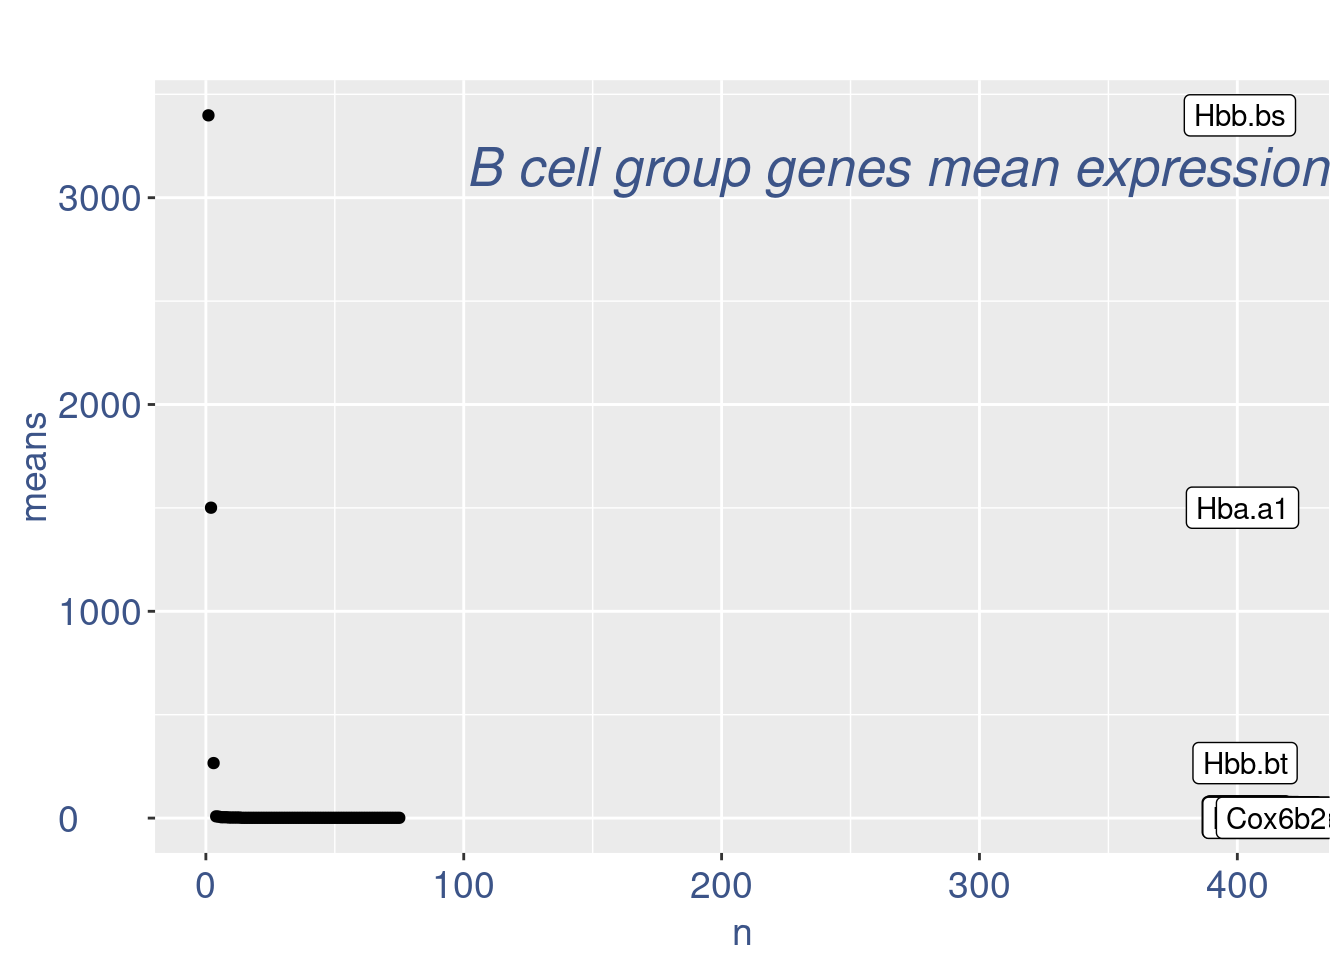
fb135Obj <- addElementToMetaDataset(fb135Obj, "Num drop B group", 0)B group contains high number of hemoglobin genes: so they are not interesting
cells_to_rem <- rownames(pcaCellsData)[pcaCellsData[["groups"]] == "B"]

fb135Obj <- dropGenesCells(fb135Obj, cells = cells_to_rem)
Clean: round 2
fb135Obj <- clean(fb135Obj)

c(pcaCellsPlot, pcaCellsData, genesPlot, UDEPlot, nuPlot) %<-% cleanPlots(fb135Obj)

plot(pcaCellsPlot)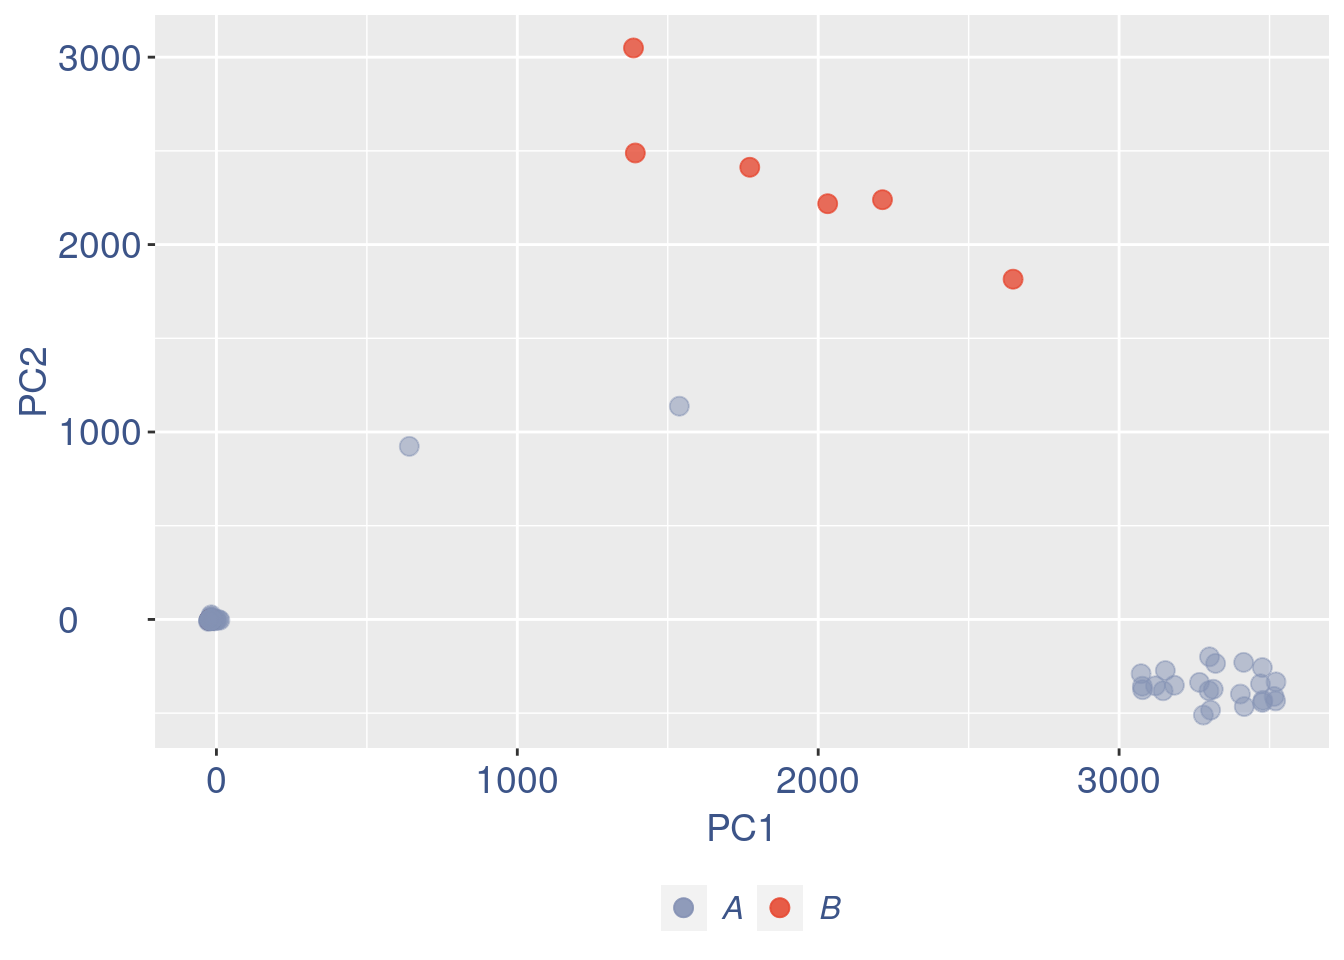
plot(genesPlot)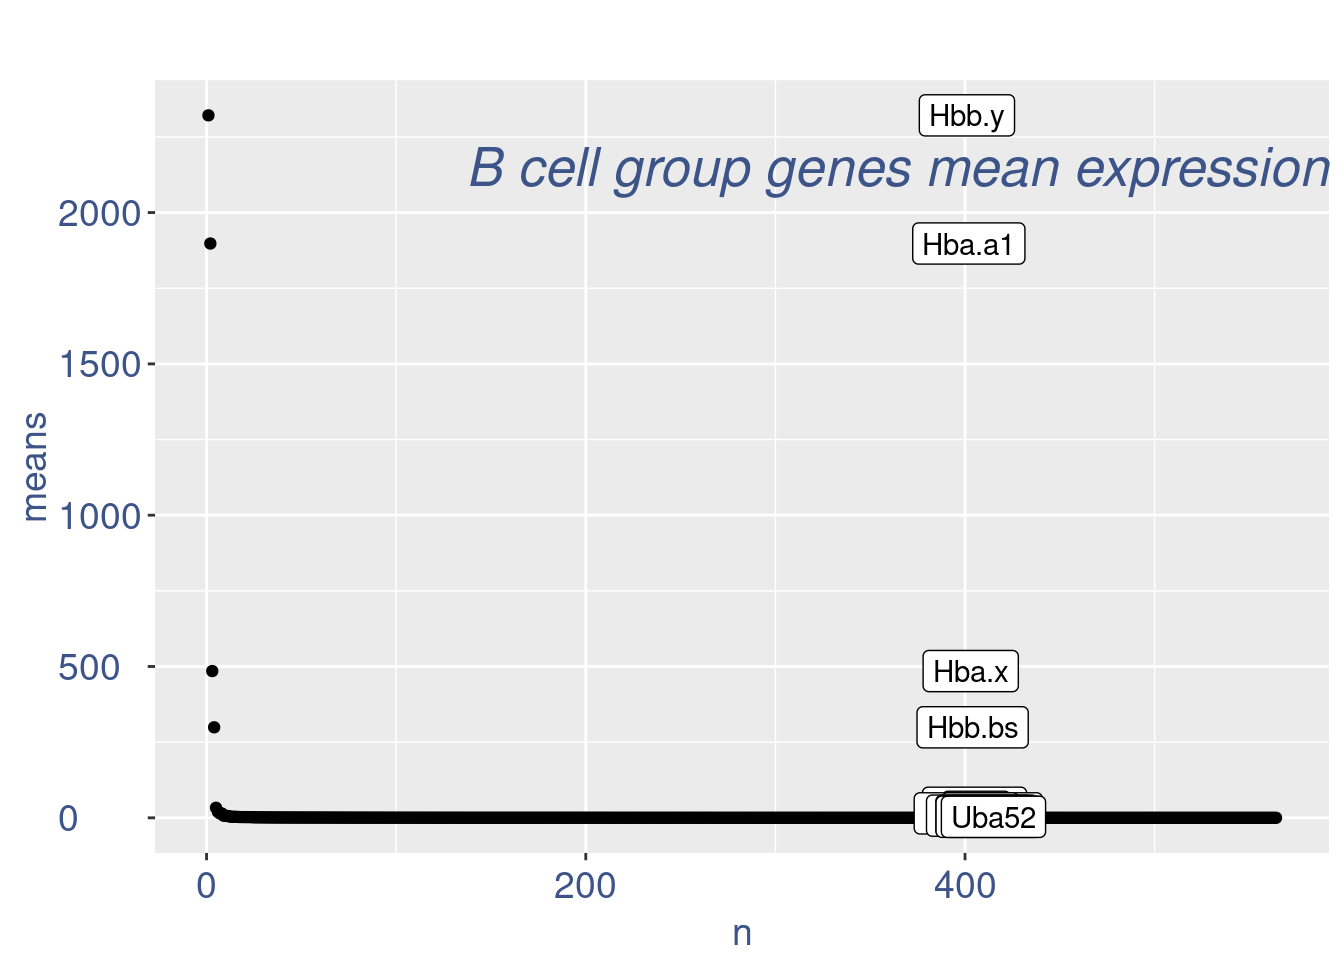
fb135Obj <- addElementToMetaDataset(fb135Obj, "Num drop B group", 1)B group contains high number of hemoglobin genes: so they are not interesting
cells_to_rem <- rownames(pcaCellsData)[pcaCellsData[["groups"]] == "B"]

fb135Obj <- dropGenesCells(fb135Obj, cells = cells_to_rem)
Clean: round 3
fb135Obj <- clean(fb135Obj)

c(pcaCellsPlot, pcaCellsData, genesPlot, UDEPlot, nuPlot) %<-% cleanPlots(fb135Obj)

plot(pcaCellsPlot)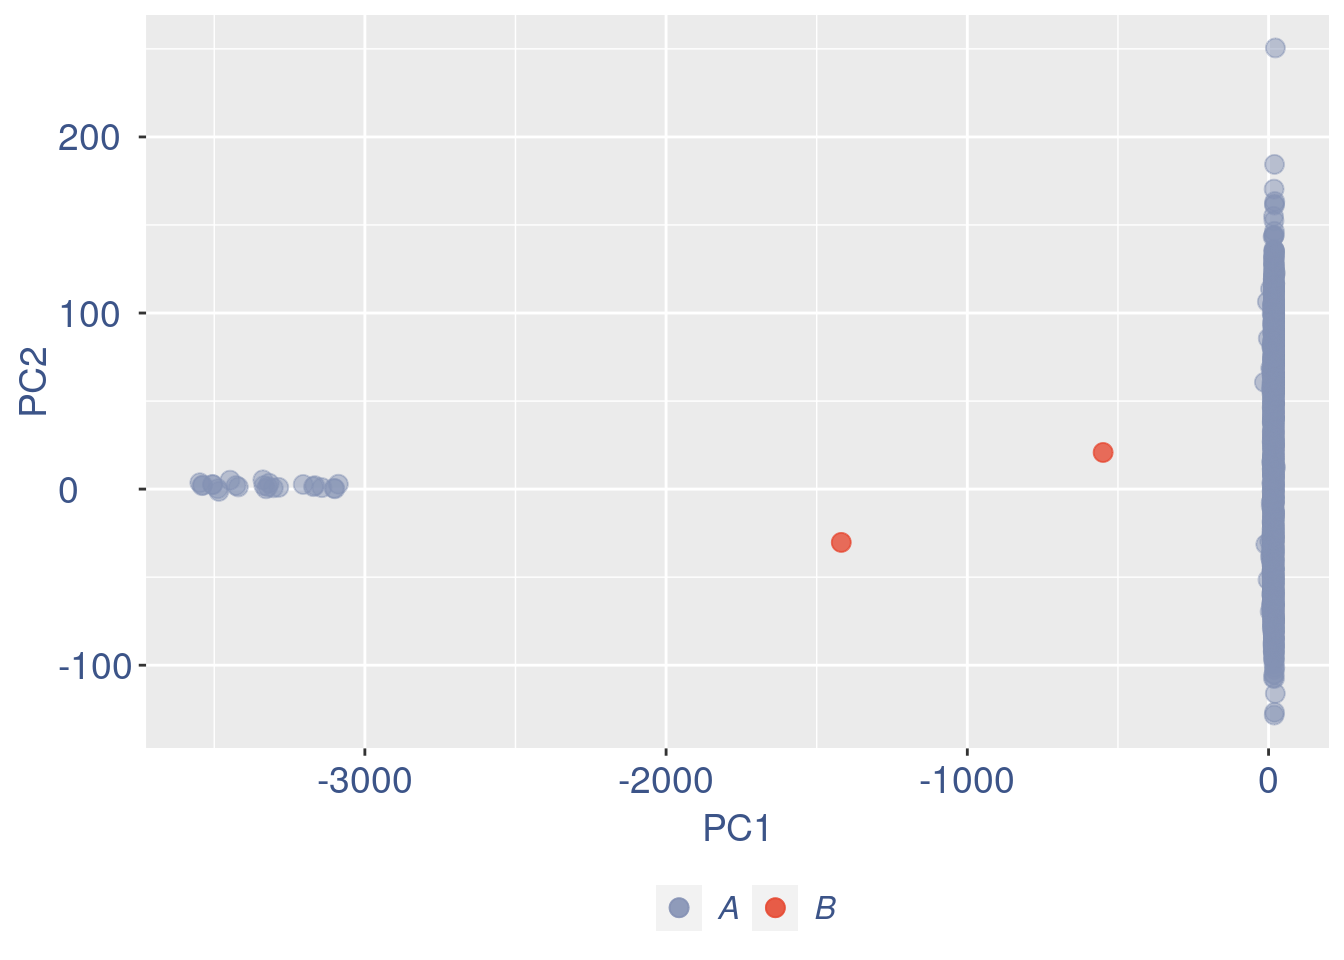
plot(genesPlot)
fb135Obj <- addElementToMetaDataset(fb135Obj, "Num drop B group", 2)Visualize if all is ok:
plot(UDEPlot)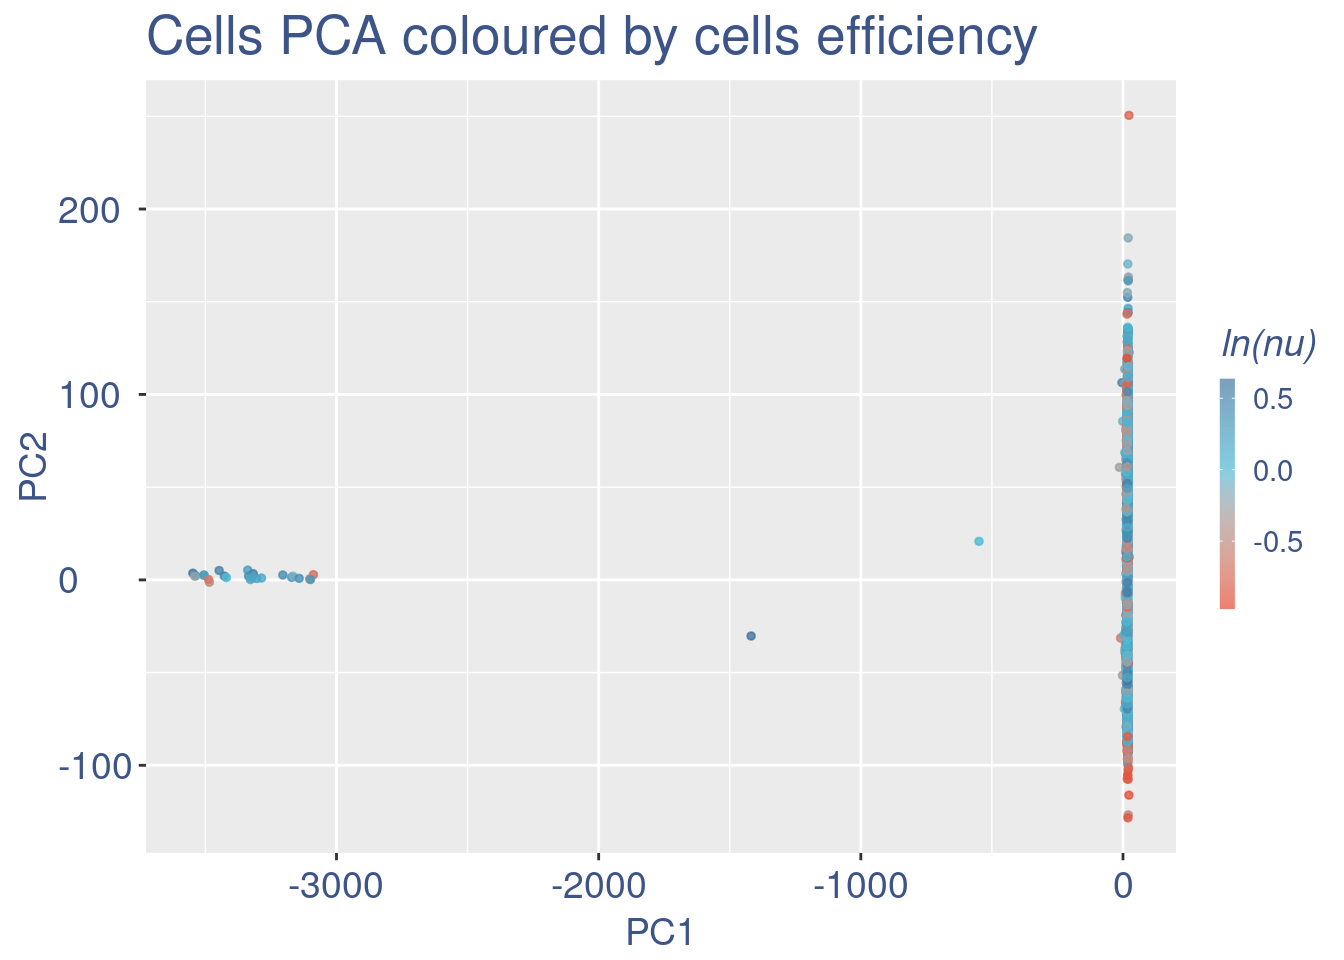
plot(nuPlot)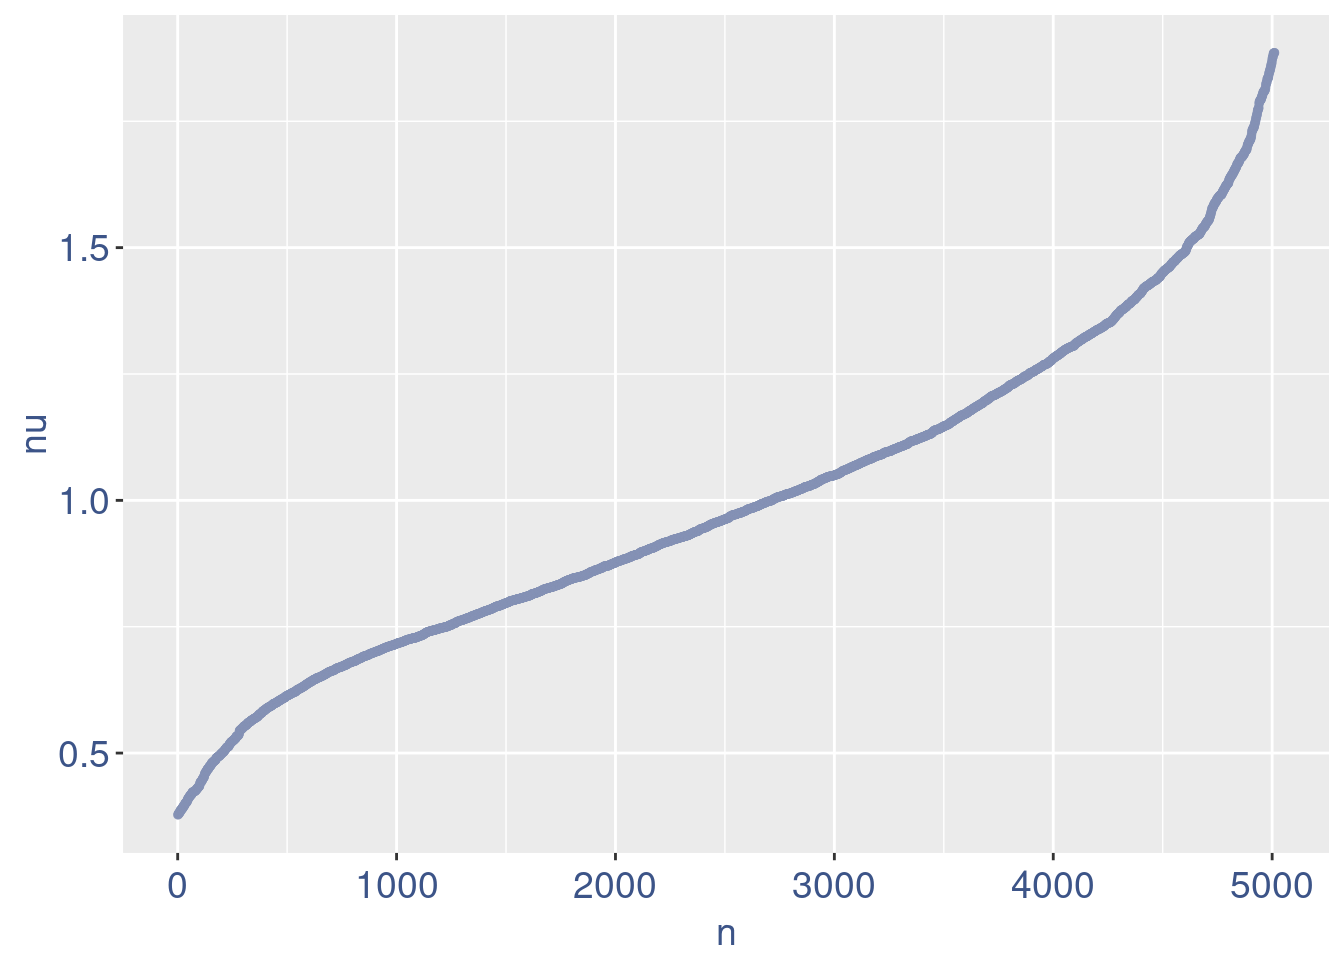
lowUDEThr <- 0.3 # the threshold to remove low UDE cells

nuDf <- data.frame("nu" = sort(getNu(fb135Obj)), "n" = seq_along(getNu(fb135Obj)))
UDEPlot_zoomed <- ggplot(nuDf, aes(x = n, y = nu)) +
            geom_point(colour = "#8491B4B2", size = 1.0) +
            xlim(0L, 400L) +
            ylim(0.0, 1.0) +
            geom_hline(yintercept = lowUDEThr, linetype = "dashed",
                       color = "darkred") +
            annotate(geom = "text", x = 200L, y = 0.25,
                     label = paste0("to remove cells with nu < ", lowUDEThr),
                     color = "darkred", size = 4.5)

plot(UDEPlot_zoomed)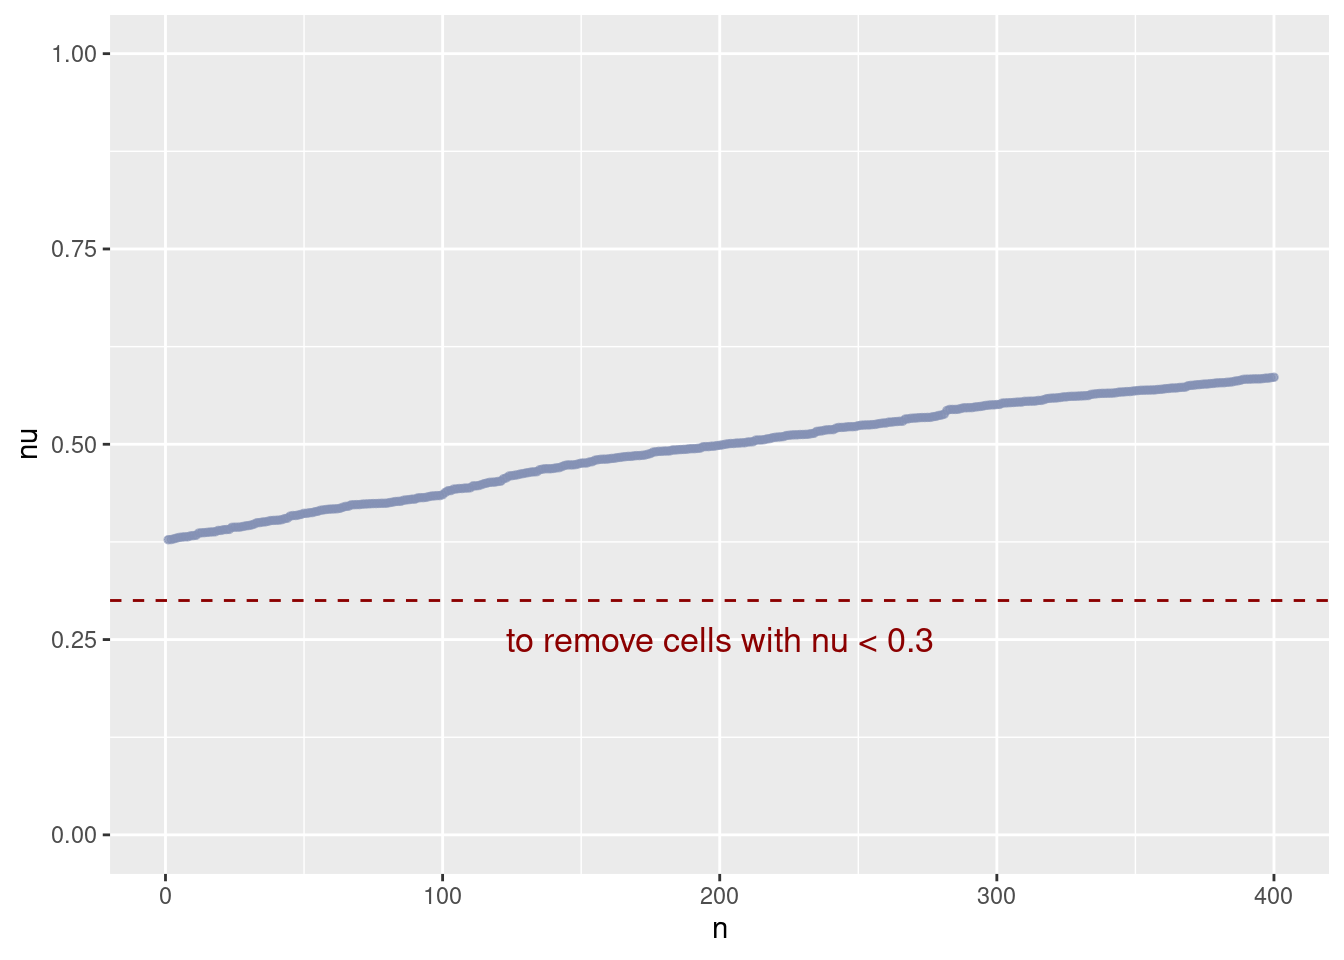
Final cleaning to check all is OK
fb135Obj <- clean(fb135Obj)

c(pcaCellsPlot, pcaCellsData, genesPlot, UDEPlot, nuPlot) %<-% cleanPlots(fb135Obj)

plot(pcaCellsPlot)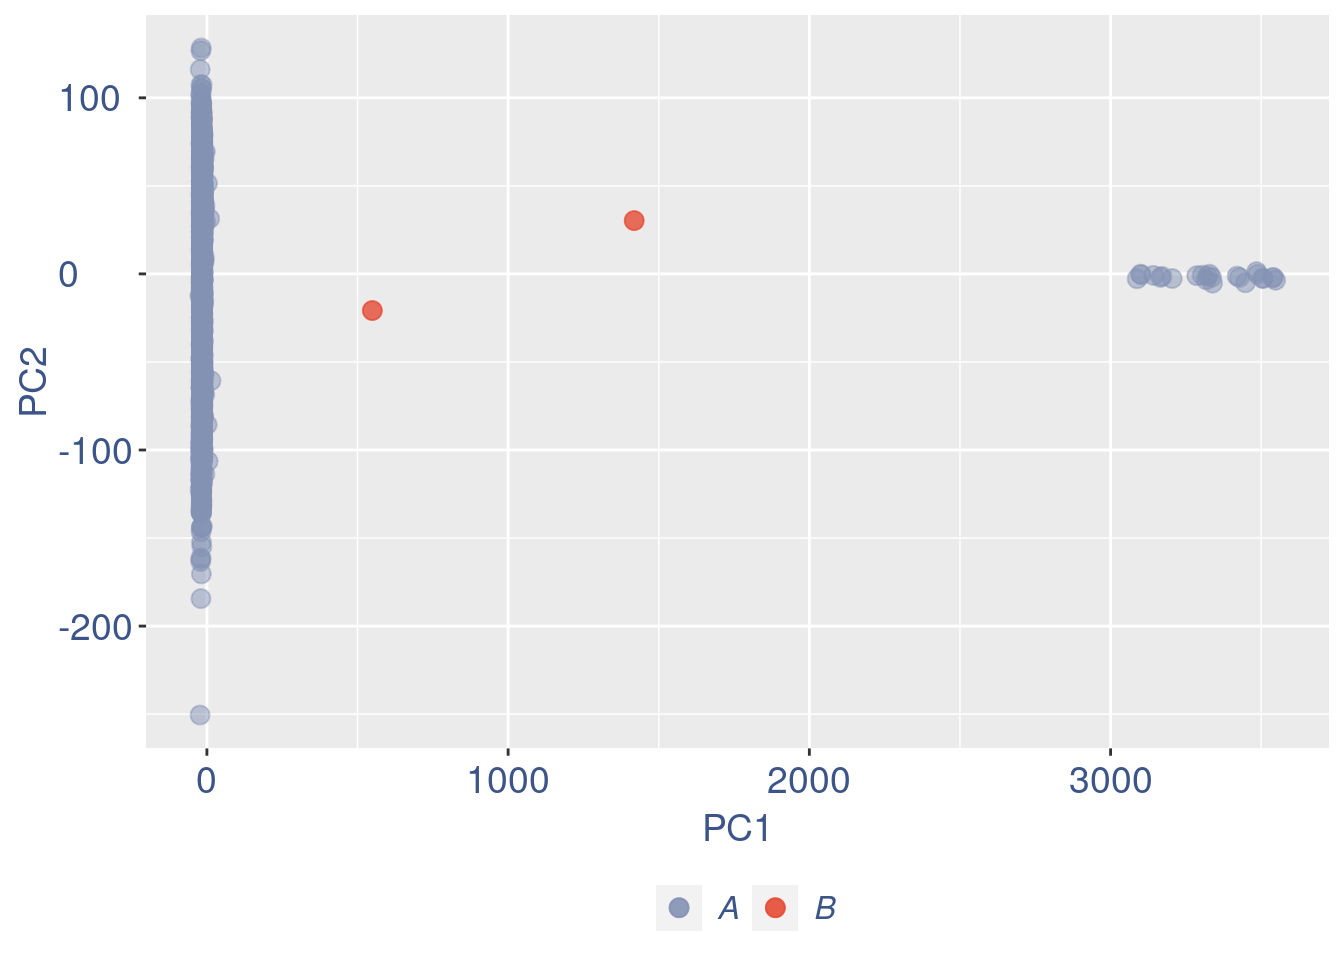
plot(genesPlot)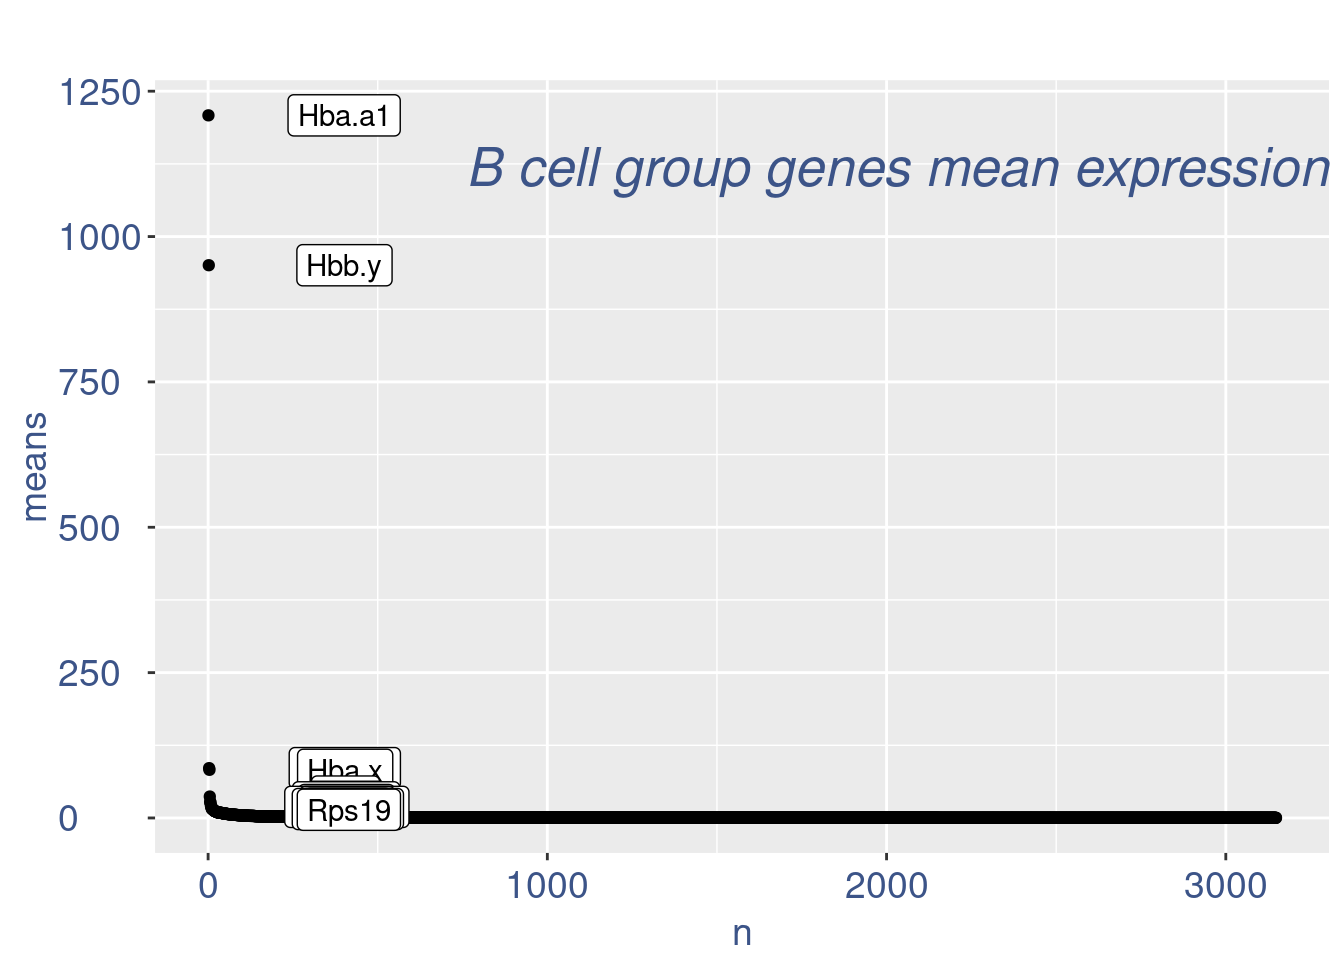
plot(UDEPlot)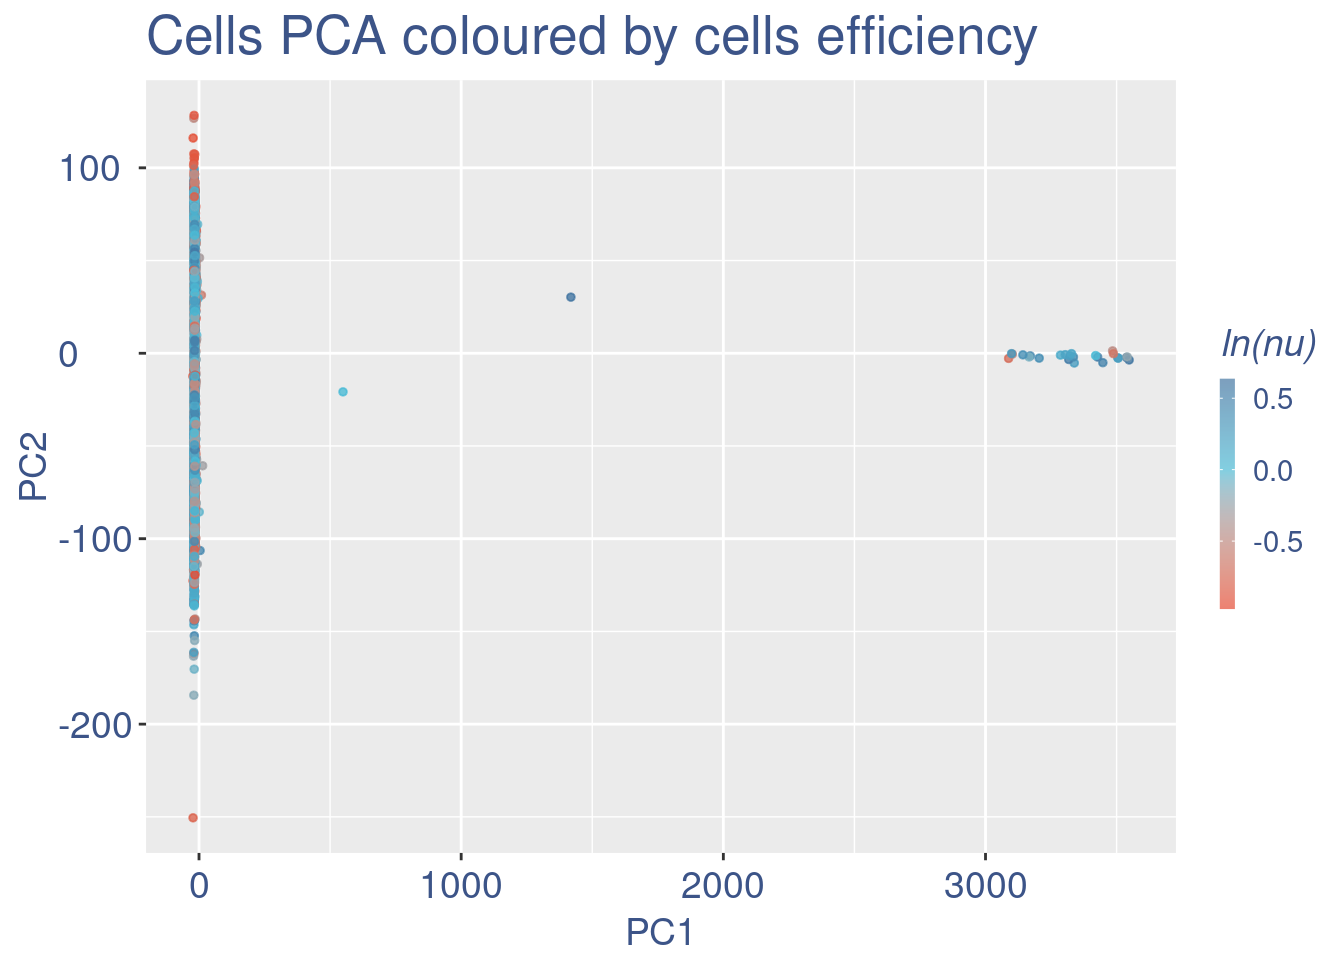
plot(nuPlot)
plot(cellSizePlot(fb135Obj, splitPattern = ":", numCol = 1))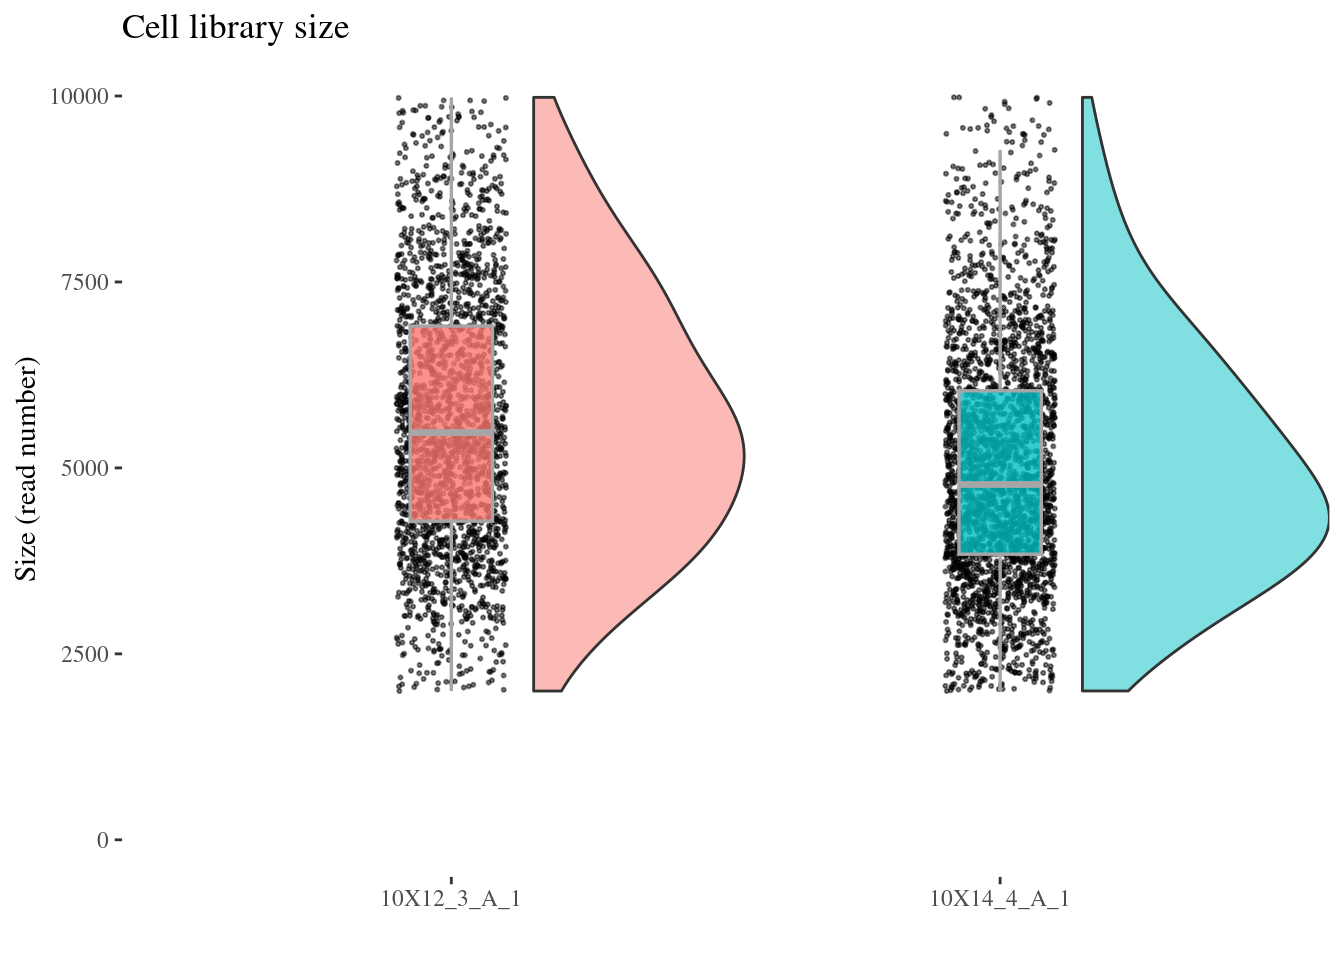
plot(genesSizePlot(fb135Obj, splitPattern = ":", numCol = 1))
Calculate genes’ COEX
fb135Obj <- proceedToCoex(fb135Obj, calcCoex = TRUE, cores = 12,
                          saveObj = TRUE, outDir = outDir)

gdiData <- calculateGDI(fb135Obj)

genesToLabel <- head(rownames(gdiData[order(gdiData[["GDI"]],
                                            decreasing = TRUE), ]), n = 10L)

genesToLabel
[1] "Myt1l" "Ccser1" "Hes1" "Neurod2" "Neurod6" "Aldoc" "Hes5"
[8] "Nsg2" "Rab3a" "Rbfox1" gdiPlot <- GDIPlot(fb135Obj, GDIIn = gdiData, GDIThreshold = 1.4,
genes = list("Top 10 GDI genes" = genesToLabel))
plot(gdiPlot)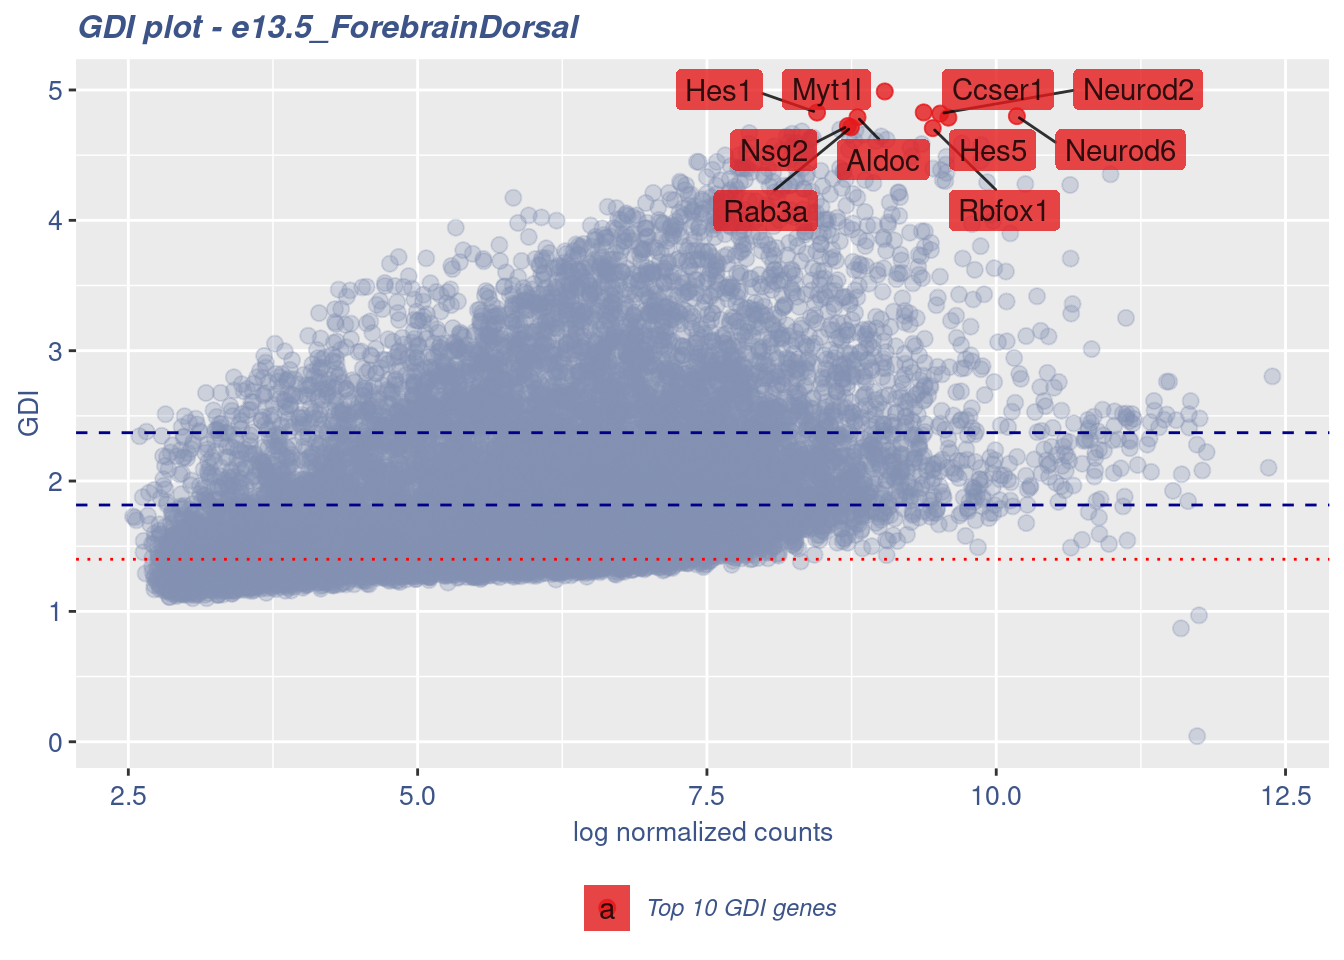
Save the COTAN object
saveRDS(fb135Obj, file = file.path(outDir, paste0(sampleCondition, ".cotan.RDS")))fb135Obj <- readRDS(file = file.path(outDir, paste0(sampleCondition, ".cotan.RDS")))splitClusters <- cellsUniformClustering(fb135Obj, GDIThreshold = 1.4, cores = 13,
saveObj = TRUE, outDir = outDir)
c(splitCoexDF, splitPValueDF) %<-% DEAOnClusters(fb135Obj, clusters = splitClusters)
fb135Obj <- addClusterization(fb135Obj, clName = "split",
clusters = splitClusters,
coexDF = splitCoexDF, override = TRUE)
table(splitClusters)saveRDS(fb135Obj, file = file.path(outDir, paste0(sampleCondition, ".cotan.RDS")))c(mergedClusters, mergedCoexDF, mergedPValueDF) %<-%
mergeUniformCellsClusters(fb135Obj, clusters = splitClusters,
GDIThreshold = 1.4, cores = 13,
saveObj = TRUE, outDir = outDir)
fb135Obj <- addClusterization(fb135Obj, clName = "merge",
clusters = mergedClusters,
coexDF = mergedCoexDF,
override = TRUE)
table(mergedClusters)saveRDS(fb135Obj, file = file.path(outDir, paste0(sampleCondition, ".cotan.RDS")))sessionInfo()R version 4.3.0 (2023-04-21)
Platform: x86_64-pc-linux-gnu (64-bit)
Running under: Ubuntu 20.04.6 LTS
Matrix products: default
BLAS: /usr/lib/x86_64-linux-gnu/blas/libblas.so.3.9.0
LAPACK: /usr/lib/x86_64-linux-gnu/lapack/liblapack.so.3.9.0
locale:
[1] LC_CTYPE=C.UTF-8 LC_NUMERIC=C LC_TIME=C.UTF-8
[4] LC_COLLATE=C.UTF-8 LC_MONETARY=C.UTF-8 LC_MESSAGES=C.UTF-8
[7] LC_PAPER=C.UTF-8 LC_NAME=C LC_ADDRESS=C
[10] LC_TELEPHONE=C LC_MEASUREMENT=C.UTF-8 LC_IDENTIFICATION=C
time zone: Europe/Berlin
tzcode source: system (glibc)
attached base packages:
[1] stats graphics grDevices utils datasets methods base
other attached packages:
[1] COTAN_2.1.5 zeallot_0.1.0 tibble_3.2.1 ggplot2_3.4.2
loaded via a namespace (and not attached):
[1] RColorBrewer_1.1-3 rstudioapi_0.14 jsonlite_1.8.4
[4] shape_1.4.6 umap_0.2.10.0 magrittr_2.0.3
[7] spatstat.utils_3.0-3 farver_2.1.1 rmarkdown_2.21
[10] GlobalOptions_0.1.2 vctrs_0.6.1 ROCR_1.0-11
[13] spatstat.explore_3.2-1 askpass_1.1 htmltools_0.5.5
[16] sctransform_0.3.5 parallelly_1.36.0 KernSmooth_2.23-20
[19] htmlwidgets_1.6.2 ica_1.0-3 plyr_1.8.8
[22] plotly_4.10.1 zoo_1.8-12 igraph_1.4.2
[25] mime_0.12 lifecycle_1.0.3 iterators_1.0.14
[28] pkgconfig_2.0.3 Matrix_1.5-4.1 R6_2.5.1
[31] fastmap_1.1.1 fitdistrplus_1.1-8 future_1.32.0
[34] shiny_1.7.4 clue_0.3-64 digest_0.6.31
[37] colorspace_2.1-0 patchwork_1.1.2 S4Vectors_0.38.0
[40] Seurat_4.3.0 tensor_1.5 RSpectra_0.16-1
[43] irlba_2.3.5.1 labeling_0.4.2 progressr_0.13.0
[46] RcppZiggurat_0.1.6 fansi_1.0.4 spatstat.sparse_3.0-1
[49] httr_1.4.5 polyclip_1.10-4 abind_1.4-5
[52] compiler_4.3.0 withr_2.5.0 doParallel_1.0.17
[55] viridis_0.6.2 dendextend_1.17.1 MASS_7.3-59
[58] openssl_2.0.6 rjson_0.2.21 tools_4.3.0
[61] lmtest_0.9-40 httpuv_1.6.9 future.apply_1.11.0
[64] goftest_1.2-3 glue_1.6.2 nlme_3.1-162
[67] promises_1.2.0.1 grid_4.3.0 Rtsne_0.16
[70] cluster_2.1.4 reshape2_1.4.4 generics_0.1.3
[73] gtable_0.3.3 spatstat.data_3.0-1 tidyr_1.3.0
[76] data.table_1.14.8 sp_1.6-0 utf8_1.2.3
[79] BiocGenerics_0.46.0 spatstat.geom_3.2-1 RcppAnnoy_0.0.20
[82] ggrepel_0.9.3 RANN_2.6.1 foreach_1.5.2
[85] pillar_1.9.0 stringr_1.5.0 later_1.3.0
[88] circlize_0.4.15 splines_4.3.0 dplyr_1.1.2
[91] lattice_0.21-8 survival_3.5-5 deldir_1.0-6
[94] tidyselect_1.2.0 ComplexHeatmap_2.16.0 miniUI_0.1.1.1
[97] pbapply_1.7-0 knitr_1.42 gridExtra_2.3
[100] IRanges_2.34.0 scattermore_1.1 stats4_4.3.0
[103] xfun_0.39 factoextra_1.0.7 matrixStats_1.0.0
[106] stringi_1.7.12 lazyeval_0.2.2 yaml_2.3.7
[109] evaluate_0.20 codetools_0.2-19 cli_3.6.1
[112] RcppParallel_5.1.7 uwot_0.1.14 xtable_1.8-4
[115] reticulate_1.28 munsell_0.5.0 Rcpp_1.0.10
[118] globals_0.16.2 spatstat.random_3.1-4 png_0.1-8
[121] parallel_4.3.0 Rfast_2.0.7 ellipsis_0.3.2
[124] assertthat_0.2.1 parallelDist_0.2.6 listenv_0.9.0
[127] ggthemes_4.2.4 viridisLite_0.4.1 scales_1.2.1
[130] ggridges_0.5.4 SeuratObject_4.1.3 leiden_0.4.3
[133] purrr_1.0.1 crayon_1.5.2 GetoptLong_1.0.5
[136] rlang_1.1.0 cowplot_1.1.1