library(COTAN)
library(pROC)
options(parallelly.fork.enable = TRUE)
library(Seurat)
library(monocle3)
library(reticulate)
library(stringr)
library(dplyr)
library(tidyr)
library(ggplot2)
library(ggpubr)

dirOut <- "Results/FDR/"
if (!dir.exists(dirOut)) {
  dir.create(dirOut)
}

dataSetDir <- "Data/MouseCortexFromLoom/FDR/MergedClusters_For_FDR/"FDR analysis - Results - thresholds true 5% 20%
Preamble
Dataset composition
datasets_csv <- read.csv(file.path(dataSetDir,"Cells_Usage_DataFrame.csv"),
                         row.names = 1
                        )

datasets_csv[1:3,]
Group Collection E13.5.432 E13.5.187 E13.5.434
1 2_Clusters_even_near E13.5-434_+_E15.0-428 0 0 318
2 2_Clusters_even_near E15.0-432_+_E13.5-432 536 0 0
3 2_Clusters_even_near E15.0-508_+_E15.0-509 0 0 0
E13.5.184 E13.5.437 E13.5.510 E15.0.432 E15.0.509 E15.0.510 E15.0.508
1 0 0 0 0 0 0 0
2 0 0 0 536 0 0 0
3 0 0 0 0 397 0 397
E15.0.428 E15.0.434 E15.0.437 E17.5.516 E17.5.505
1 318 0 0 0 0
2 0 0 0 0 0
3 0 0 0 0 0Define which genes are expressed
For each data set we need to define, independently from the DEA methods, which genes are specific for each cluster. So we need to define first which genes are expressed and which are not expressed. To do so we can take advantage from the fact that we have the original clusters from which the cells were sampled to create the artificial datasets. So looking to the original cluster we define as expressed all genes present in at least the 20% of cells and we define as not expressed the genes completely absent or expressed in less than 5% of cells.
Since these two thresholds can have a big influence on the tools performances we will test also others in other pages.
file.presence <- readRDS("Data/MouseCortexFromLoom/FDR/Results/GenePresence_PerCluster.RDS")

for (file in list.files("Data/MouseCortexFromLoom/SingleClusterRawData/")) {
#  print(file)
  Code <- str_split(file,pattern = "_",simplify = T)[1]
  Time <- str_split(Code,pattern = "e",simplify = T)[2]
  Cluster <- str_split(Code,pattern = "e",simplify = T)[1]
  Cluster <- str_remove(Cluster,pattern = "Cl")
  Cluster <- paste0("E",Time,"-",Cluster)
  file.presence[,Cluster] <- "Absent"
  dataset.cl <- readRDS(file.path("Data/MouseCortexFromLoom/SingleClusterRawData/",
                                         file))
  number.cell.expressing <- rowSums(dataset.cl > 0)
  AbsentThreshold <- round(0.05*dim(dataset.cl)[2],digits = 0)
  PresenceThreshold <- round(0.2*dim(dataset.cl)[2],digits = 0)
  file.presence[names(number.cell.expressing[number.cell.expressing > AbsentThreshold]),Cluster] <- "Uncertain"

  file.presence[names(number.cell.expressing[number.cell.expressing >= PresenceThreshold]),Cluster] <- "Present"
  print(Cluster)
  print(table(file.presence[,Cluster]))

  }
[1] "E13.5-184"
Absent Present Uncertain
6719 3476 4500
[1] "E13.5-187"
Absent Present Uncertain
5930 4609 4156
[1] "E15.0-428"
Absent Present Uncertain
7470 2864 4361
[1] "E13.5-432"
Absent Present Uncertain
6847 3640 4208
[1] "E15.0-432"
Absent Present Uncertain
6951 3514 4230
[1] "E13.5-434"
Absent Present Uncertain
7191 3185 4319
[1] "E15.0-434"
Absent Present Uncertain
7554 3028 4113
[1] "E13.5-437"
Absent Present Uncertain
7024 3430 4241
[1] "E15.0-437"
Absent Present Uncertain
7090 3419 4186
[1] "E17.5-505"
Absent Present Uncertain
7141 3154 4400
[1] "E15.0-508"
Absent Present Uncertain
6637 3892 4166
[1] "E15.0-509"
Absent Present Uncertain
6495 4039 4161
[1] "E13.5-510"
Absent Present Uncertain
5961 4541 4193
[1] "E15.0-510"
Absent Present Uncertain
6082 4480 4133
[1] "E17.5-516"
Absent Present Uncertain
6931 3496 4268 2 Clusters even
2_Clusters_even_near
True vector
subset.datasets_csv <-datasets_csv[datasets_csv$Group == "2_Clusters_even_near",]

ground_truth_tot <- NA

for (ind in 1:dim(subset.datasets_csv)[1]) {
  clusters <- str_split(subset.datasets_csv$Collection[ind],pattern = "_[+]_",simplify = T)

  file.presence.subset <- file.presence[,clusters]


  #file.presence.subset <- as.matrix(file.presence.subset)


  ground_truth <- as.data.frame(matrix(nrow = nrow(file.presence.subset),
                                       ncol = ncol(file.presence.subset)))
  rownames(ground_truth) <- rownames(file.presence.subset)
  colnames(ground_truth) <- colnames(file.presence.subset)

  ground_truth[file.presence.subset == "Absent"] <- 0
  ground_truth[file.presence.subset == "Present"] <- 1
  ground_truth[file.presence.subset == "Uncertain"] <- 0.6

  file.presence.subset <- ground_truth

  for (col in 1:ncol(ground_truth)) {
    ground_truth[,col] <- FALSE
    ground_truth[file.presence.subset[,col] == 1 & rowMeans(file.presence.subset[,-col,drop = FALSE]) < 0.555  ,col] <- TRUE
    }

  ground_truth$genes <- rownames(ground_truth)
  ground_truth <- pivot_longer(ground_truth,
                               cols = 1:(ncol(ground_truth)-1),
                               names_to = "clusters")
  ground_truth$data_set <- subset.datasets_csv[ind,1]
  ground_truth$set_number <- ind
  ground_truth_tot <- rbind(ground_truth_tot, ground_truth)

}
ground_truth_tot <- ground_truth_tot[2:nrow(ground_truth_tot),]

head(ground_truth_tot)
# A tibble: 6 × 5
genes clusters value data_set set_number
<chr> <chr> <lgl> <chr> <int>
1 Neil2 E13.5-434 FALSE 2_Clusters_even_near 1
2 Neil2 E15.0-428 FALSE 2_Clusters_even_near 1
3 Lamc1 E13.5-434 FALSE 2_Clusters_even_near 1
4 Lamc1 E15.0-428 FALSE 2_Clusters_even_near 1
5 Lama1 E13.5-434 FALSE 2_Clusters_even_near 1
6 Lama1 E15.0-428 FALSE 2_Clusters_even_near 1length(unique(ground_truth_tot$genes))[1] 14695sum(ground_truth_tot$value)[1] 8ROC for COTAN
onlyPositive.pVal.Cotan_tot <- NA

for (ind in 1:dim(subset.datasets_csv)[1]) {
  #print(ind)
  file.code <- paste0(subset.datasets_csv$Group[ind],"_",
                      subset.datasets_csv$Collection[ind])
  dataset <- readRDS(file = file.path(dataSetDir,paste0(file.code,".RDS")))
  deaCOTAN <- getClusterizationData(dataset,clName = "mergedClusters")[[2]]
  pvalCOTAN <- pValueFromDEA(deaCOTAN,
              numCells = getNumCells(dataset),adjustmentMethod = "none")

  clusterization <- getClusterizationData(dataset, clName = "mergedClusters")[[1]]
  cl.names <- NA

  for (cl.val in  unique(clusterization)) {
    #print(cl.val)
    cl.names <- c(cl.names,
                  str_split(names(clusterization[clusterization == cl.val])[1],
                            pattern = "_",simplify = T)[1])
    cl.names <- cl.names[!is.na(cl.names)]
  }
  colnames(deaCOTAN) <- cl.names
  colnames(pvalCOTAN) <- cl.names

  clusters <- str_split(datasets_csv$Collection[ind],pattern = "_[+]_",simplify = T)

  onlyPositive.pVal.Cotan <- pvalCOTAN

    for (cl in cl.names) {
    print(cl)
    #temp.DEA.CotanSign <- deaCOTAN[rownames(pvalCOTAN[pvalCOTAN[,cl] < 0.05,]) ,]
    onlyPositive.pVal.Cotan[rownames(deaCOTAN[deaCOTAN[,cl] < 0,]),cl] <-  1 #onlyPositive.pVal.Cotan[rownames(deaCOTAN[deaCOTAN[,cl] < 0,]),cl]+1
    }

    onlyPositive.pVal.Cotan$genes <- rownames(onlyPositive.pVal.Cotan)
    onlyPositive.pVal.Cotan <- pivot_longer(onlyPositive.pVal.Cotan,
                                            values_to = "p_values",
                               cols = 1:(ncol(onlyPositive.pVal.Cotan)-1),
                               names_to = "clusters")
  onlyPositive.pVal.Cotan$data_set <- subset.datasets_csv[ind,1]
  onlyPositive.pVal.Cotan$set_number <- ind
  onlyPositive.pVal.Cotan_tot <- rbind(onlyPositive.pVal.Cotan_tot, onlyPositive.pVal.Cotan)

  }
[1] "E13.5-434"
[1] "E15.0-428"
[1] "E15.0-432"
[1] "E13.5-432"
[1] "E15.0-509"
[1] "E15.0-508"onlyPositive.pVal.Cotan_tot <- onlyPositive.pVal.Cotan_tot[2:nrow(onlyPositive.pVal.Cotan_tot),]
onlyPositive.pVal.Cotan_tot <- merge.data.frame(onlyPositive.pVal.Cotan_tot,
ground_truth_tot,by = c("genes","clusters","data_set","set_number"),all.x = T,all.y = F)
#onlyPositive.pVal.Cotan_tot <- onlyPositive.pVal.Cotan_tot[order(onlyPositive.pVal.Cotan_tot$p_values,
# decreasing = F),]
# df <- as.data.frame(matrix(nrow = nrow(onlyPositive.pVal.Cotan_tot),ncol = 3))
# colnames(df) <- c("TPR","FPR","Method")
# df$Method <- "COTAN"
#
# Positive <- sum(onlyPositive.pVal.Cotan_tot$value)
# Negative <- sum(!onlyPositive.pVal.Cotan_tot$value)
#
# for (i in 1:nrow(onlyPositive.pVal.Cotan_tot)) {
# df[i,"TPR"] <- sum(onlyPositive.pVal.Cotan_tot[1:i,"value"])/Positive
# df[i,"FPR"] <- (i-sum(onlyPositive.pVal.Cotan_tot[1:i,"value"]))/Negative
# Convert TRUE/FALSE to 1/0
onlyPositive.pVal.Cotan_tot$value <- as.numeric(onlyPositive.pVal.Cotan_tot$value)
# Compute the ROC curve - note that we invert the p-values with 1 - p_values
roc_resultCOTAN <- roc(onlyPositive.pVal.Cotan_tot$value, 1 - onlyPositive.pVal.Cotan_tot$p_values)
# Plot the ROC curve
#plot(roc_resultCOTAN)ROC for Seurat
deaSeurat_tot <- NA

for (ind in 1:dim(subset.datasets_csv)[1]) {
  #print(ind)
  file.code <- paste0(subset.datasets_csv$Group[ind],"_",subset.datasets_csv$Collection[ind])

  dataset <- readRDS(file = file.path(dataSetDir,paste0(file.code,".RDS")))

  clusterization <- getClusterizationData(dataset, clName = "mergedClusters")[[1]]

  deaSeurat <- read.csv(file.path(dirOut,paste0(file.code,"Seurat_DEA_genes.csv")), row.names = 1)

  cl.names <- NA

  for (cl.val in  unique(clusterization)) {
    #print(cl.val)
    cl.name <- str_split(names(clusterization[clusterization == cl.val])[1],
                            pattern = "_",simplify = T)[1]
    cl.names <- c(cl.names,cl.name)
    cl.names <- cl.names[!is.na(cl.names)]

    deaSeurat[deaSeurat$cluster == cl.val,]$cluster <- cl.name

  }

  clusters <- str_split(datasets_csv$Collection[ind],pattern = "_[+]_",simplify = T)

  colnames(deaSeurat) <- str_replace(colnames(deaSeurat),
                                     pattern = "cluster",
                                     replacement = "clusters")
  colnames(deaSeurat) <- str_replace(colnames(deaSeurat),
                                     pattern = "gene",
                                     replacement = "genes")

  deaSeurat$data_set <- subset.datasets_csv[ind,1]
  deaSeurat$set_number <- ind
  deaSeurat_tot <- rbind(deaSeurat_tot, deaSeurat)


  }
 deaSeurat_tot <-  deaSeurat_tot[2:nrow(deaSeurat_tot),]

 deaSeurat_tot <- merge.data.frame(deaSeurat_tot,
                                   ground_truth_tot,
                                   by = c("genes","clusters","data_set","set_number"),
                                   all.x = T,all.y = F)

# Convert TRUE/FALSE to 1/0
deaSeurat_tot$value <- as.numeric(deaSeurat_tot$value)

# Compute the ROC curve - note that we invert the p-values with 1 - p_values
roc_resultSeurat <- roc(deaSeurat_tot$value, 1 - deaSeurat_tot$p_val)

# Plot the ROC curve
#plot(roc_resultSeurat)
ROC for Seurat scTransform
deaSeurat_tot <- NA

for (ind in 1:dim(subset.datasets_csv)[1]) {
  #print(ind)
  file.code <- paste0(subset.datasets_csv$Group[ind],"_",subset.datasets_csv$Collection[ind])

  dataset <- readRDS(file = file.path(dataSetDir,paste0(file.code,".RDS")))

  clusterization <- getClusterizationData(dataset, clName = "mergedClusters")[[1]]

  deaSeurat <- read.csv(file.path(dirOut,paste0(file.code,"Seurat_DEA_ScTransform_genes.csv")), row.names = 1)

  cl.names <- NA

  for (cl.val in  unique(clusterization)) {
    #print(cl.val)
    cl.name <- str_split(names(clusterization[clusterization == cl.val])[1],
                            pattern = "_",simplify = T)[1]
    cl.names <- c(cl.names,cl.name)
    cl.names <- cl.names[!is.na(cl.names)]

    deaSeurat[deaSeurat$cluster == cl.val,]$cluster <- cl.name

  }

  clusters <- str_split(datasets_csv$Collection[ind],pattern = "_[+]_",simplify = T)

  colnames(deaSeurat) <- str_replace(colnames(deaSeurat),
                                     pattern = "cluster",
                                     replacement = "clusters")
  colnames(deaSeurat) <- str_replace(colnames(deaSeurat),
                                     pattern = "gene",
                                     replacement = "genes")

  deaSeurat$data_set <- subset.datasets_csv[ind,1]
  deaSeurat$set_number <- ind
  deaSeurat_tot <- rbind(deaSeurat_tot, deaSeurat)


  }
 deaSeurat_tot <-  deaSeurat_tot[2:nrow(deaSeurat_tot),]

 deaSeurat_tot <- merge.data.frame(deaSeurat_tot,
                                   ground_truth_tot,
                                   by = c("genes","clusters","data_set","set_number"),
                                   all.x = T,all.y = F)

# Convert TRUE/FALSE to 1/0
deaSeurat_tot$value <- as.numeric(deaSeurat_tot$value)

# Compute the ROC curve - note that we invert the p-values with 1 - p_values
roc_resultSeurat_scTr <- roc(deaSeurat_tot$value, 1 - deaSeurat_tot$p_val)
ROC for Seurat Bimod
deaSeurat_tot <- NA

for (ind in 1:dim(subset.datasets_csv)[1]) {
  #print(ind)
  file.code <- paste0(subset.datasets_csv$Group[ind],"_",subset.datasets_csv$Collection[ind])

  dataset <- readRDS(file = file.path(dataSetDir,paste0(file.code,".RDS")))

  clusterization <- getClusterizationData(dataset, clName = "mergedClusters")[[1]]

  deaSeurat <- read.csv(file.path(dirOut,paste0(file.code,"Seurat_DEA_Bimod_genes.csv")), row.names = 1)

  cl.names <- NA

  for (cl.val in  unique(clusterization)) {
    #print(cl.val)
    cl.name <- str_split(names(clusterization[clusterization == cl.val])[1],
                            pattern = "_",simplify = T)[1]
    cl.names <- c(cl.names,cl.name)
    cl.names <- cl.names[!is.na(cl.names)]

    deaSeurat[deaSeurat$cluster == cl.val,]$cluster <- cl.name

  }

  clusters <- str_split(datasets_csv$Collection[ind],pattern = "_[+]_",simplify = T)

  colnames(deaSeurat) <- str_replace(colnames(deaSeurat),
                                     pattern = "cluster",
                                     replacement = "clusters")
  colnames(deaSeurat) <- str_replace(colnames(deaSeurat),
                                     pattern = "gene",
                                     replacement = "genes")

  deaSeurat$data_set <- subset.datasets_csv[ind,1]
  deaSeurat$set_number <- ind
  deaSeurat_tot <- rbind(deaSeurat_tot, deaSeurat)


  }
 deaSeurat_tot <-  deaSeurat_tot[2:nrow(deaSeurat_tot),]

 deaSeurat_tot <- merge.data.frame(deaSeurat_tot,
                                   ground_truth_tot,
                                   by = c("genes","clusters","data_set","set_number"),
                                   all.x = T,all.y = F)

# Convert TRUE/FALSE to 1/0
deaSeurat_tot$value <- as.numeric(deaSeurat_tot$value)

# Compute the ROC curve - note that we invert the p-values with 1 - p_values
roc_resultSeurat_Bimod <- roc(deaSeurat_tot$value, 1 - deaSeurat_tot$p_val)
ROC for Monocle
deaMonocle_tot <- NA
for (ind in 1:dim(subset.datasets_csv)[1]) {
  file.code <- paste0(subset.datasets_csv$Group[ind],"_",subset.datasets_csv$Collection[ind])
  dataset <- readRDS(file = file.path(dataSetDir,paste0(file.code,".RDS")))

  clusterization <- getClusterizationData(dataset, clName = "mergedClusters")[[1]]
  #print(file.code)

  deaMonocle <- read.csv(file.path(dirOut,paste0(file.code,"Monocle_DEA_genes.csv")),row.names = 1)

  cl.names <- NA

  for (cl.val in  unique(clusterization)) {
    #print(cl.val)
    cl.name <- str_split(names(clusterization[clusterization == cl.val])[1],
                            pattern = "_",simplify = T)[1]
    cl.names <- c(cl.names,cl.name)
    cl.names <- cl.names[!is.na(cl.names)]

    deaMonocle[deaMonocle$cell_group == cl.val,"cell_group"] <- cl.name

  }

  clusters <- str_split(datasets_csv$Collection[ind],pattern = "_[+]_",simplify = T)

  colnames(deaMonocle) <- str_replace(colnames(deaMonocle),
                                     pattern = "cell_group",
                                     replacement = "clusters")
  colnames(deaMonocle) <- str_replace(colnames(deaMonocle),
                                     pattern = "gene_id",
                                     replacement = "genes")

  deaMonocle$data_set <- subset.datasets_csv[ind,1]
  deaMonocle$set_number <- ind
  deaMonocle <- as.data.frame(deaMonocle)
  deaMonocle_tot <- rbind(deaMonocle_tot, deaMonocle)


  }
 deaMonocle_tot <-  deaMonocle_tot[2:nrow(deaMonocle_tot),]

 deaMonocle_tot <- merge.data.frame(deaMonocle_tot,
                                   ground_truth_tot,
                                   by = c("genes","clusters","data_set","set_number"),
                                   all.x = T,all.y = F)

# Convert TRUE/FALSE to 1/0
deaMonocle_tot$value <- as.numeric(deaMonocle_tot$value)

# Compute the ROC curve - note that we invert the p-values with 1 - p_values
roc_resultMonocle <- roc(deaMonocle_tot$value, 1 - deaMonocle_tot$marker_test_p_value)

# Plot the ROC curve
#plot(roc_resultMonocle)
ROC from ScamPy
deaScamPy_tot <- NA
for (ind in 1:dim(subset.datasets_csv)[1]) {
  file.code <- paste0(subset.datasets_csv$Group[ind],"_",subset.datasets_csv$Collection[ind])
  dataset <- readRDS(file = file.path(dataSetDir,paste0(file.code,".RDS")))

  clusterization <- getClusterizationData(dataset, clName = "mergedClusters")[[1]]
  #print(file.code)

  deaScamPy <- read.csv(file.path(dirOut,paste0(file.code,"ScanPy_DEA_genes.csv")),
                        row.names = 1)

  cl.names <- NA

  for (cl.val in  unique(clusterization)) {
    #print(cl.val)
    cl.name <- str_split(names(clusterization[clusterization == cl.val])[1],
                            pattern = "_",simplify = T)[1]
    cl.names <- c(cl.names,cl.name)
    cl.names <- cl.names[!is.na(cl.names)]

    deaScamPy[deaScamPy$clusters == paste0("cl",cl.val),"clusters"] <- cl.name

  }

  clusters <- str_split(datasets_csv$Collection[ind],pattern = "_[+]_",simplify = T)


  deaScamPy$data_set <- subset.datasets_csv[ind,1]
  deaScamPy$set_number <- ind
  deaScamPy_tot <- rbind(deaScamPy_tot, deaScamPy)


  }
 deaScamPy_tot <-  deaScamPy_tot[2:nrow(deaScamPy_tot),]

 deaScamPy_tot <- merge.data.frame(deaScamPy_tot,
                                   ground_truth_tot,
                                   by = c("genes","clusters","data_set","set_number"),
                                   all.x = T,all.y = F)

# Convert TRUE/FALSE to 1/0
deaScamPy_tot$value <- as.numeric(deaScamPy_tot$value)

# Compute the ROC curve - note that we invert the p-values with 1 - p_values
roc_resultScamPy <- roc(deaScamPy_tot$value, 1 - deaScamPy_tot$pval)

# Plot the ROC curve
#plot(roc_resultScamPy)
Summary ROC for all methods
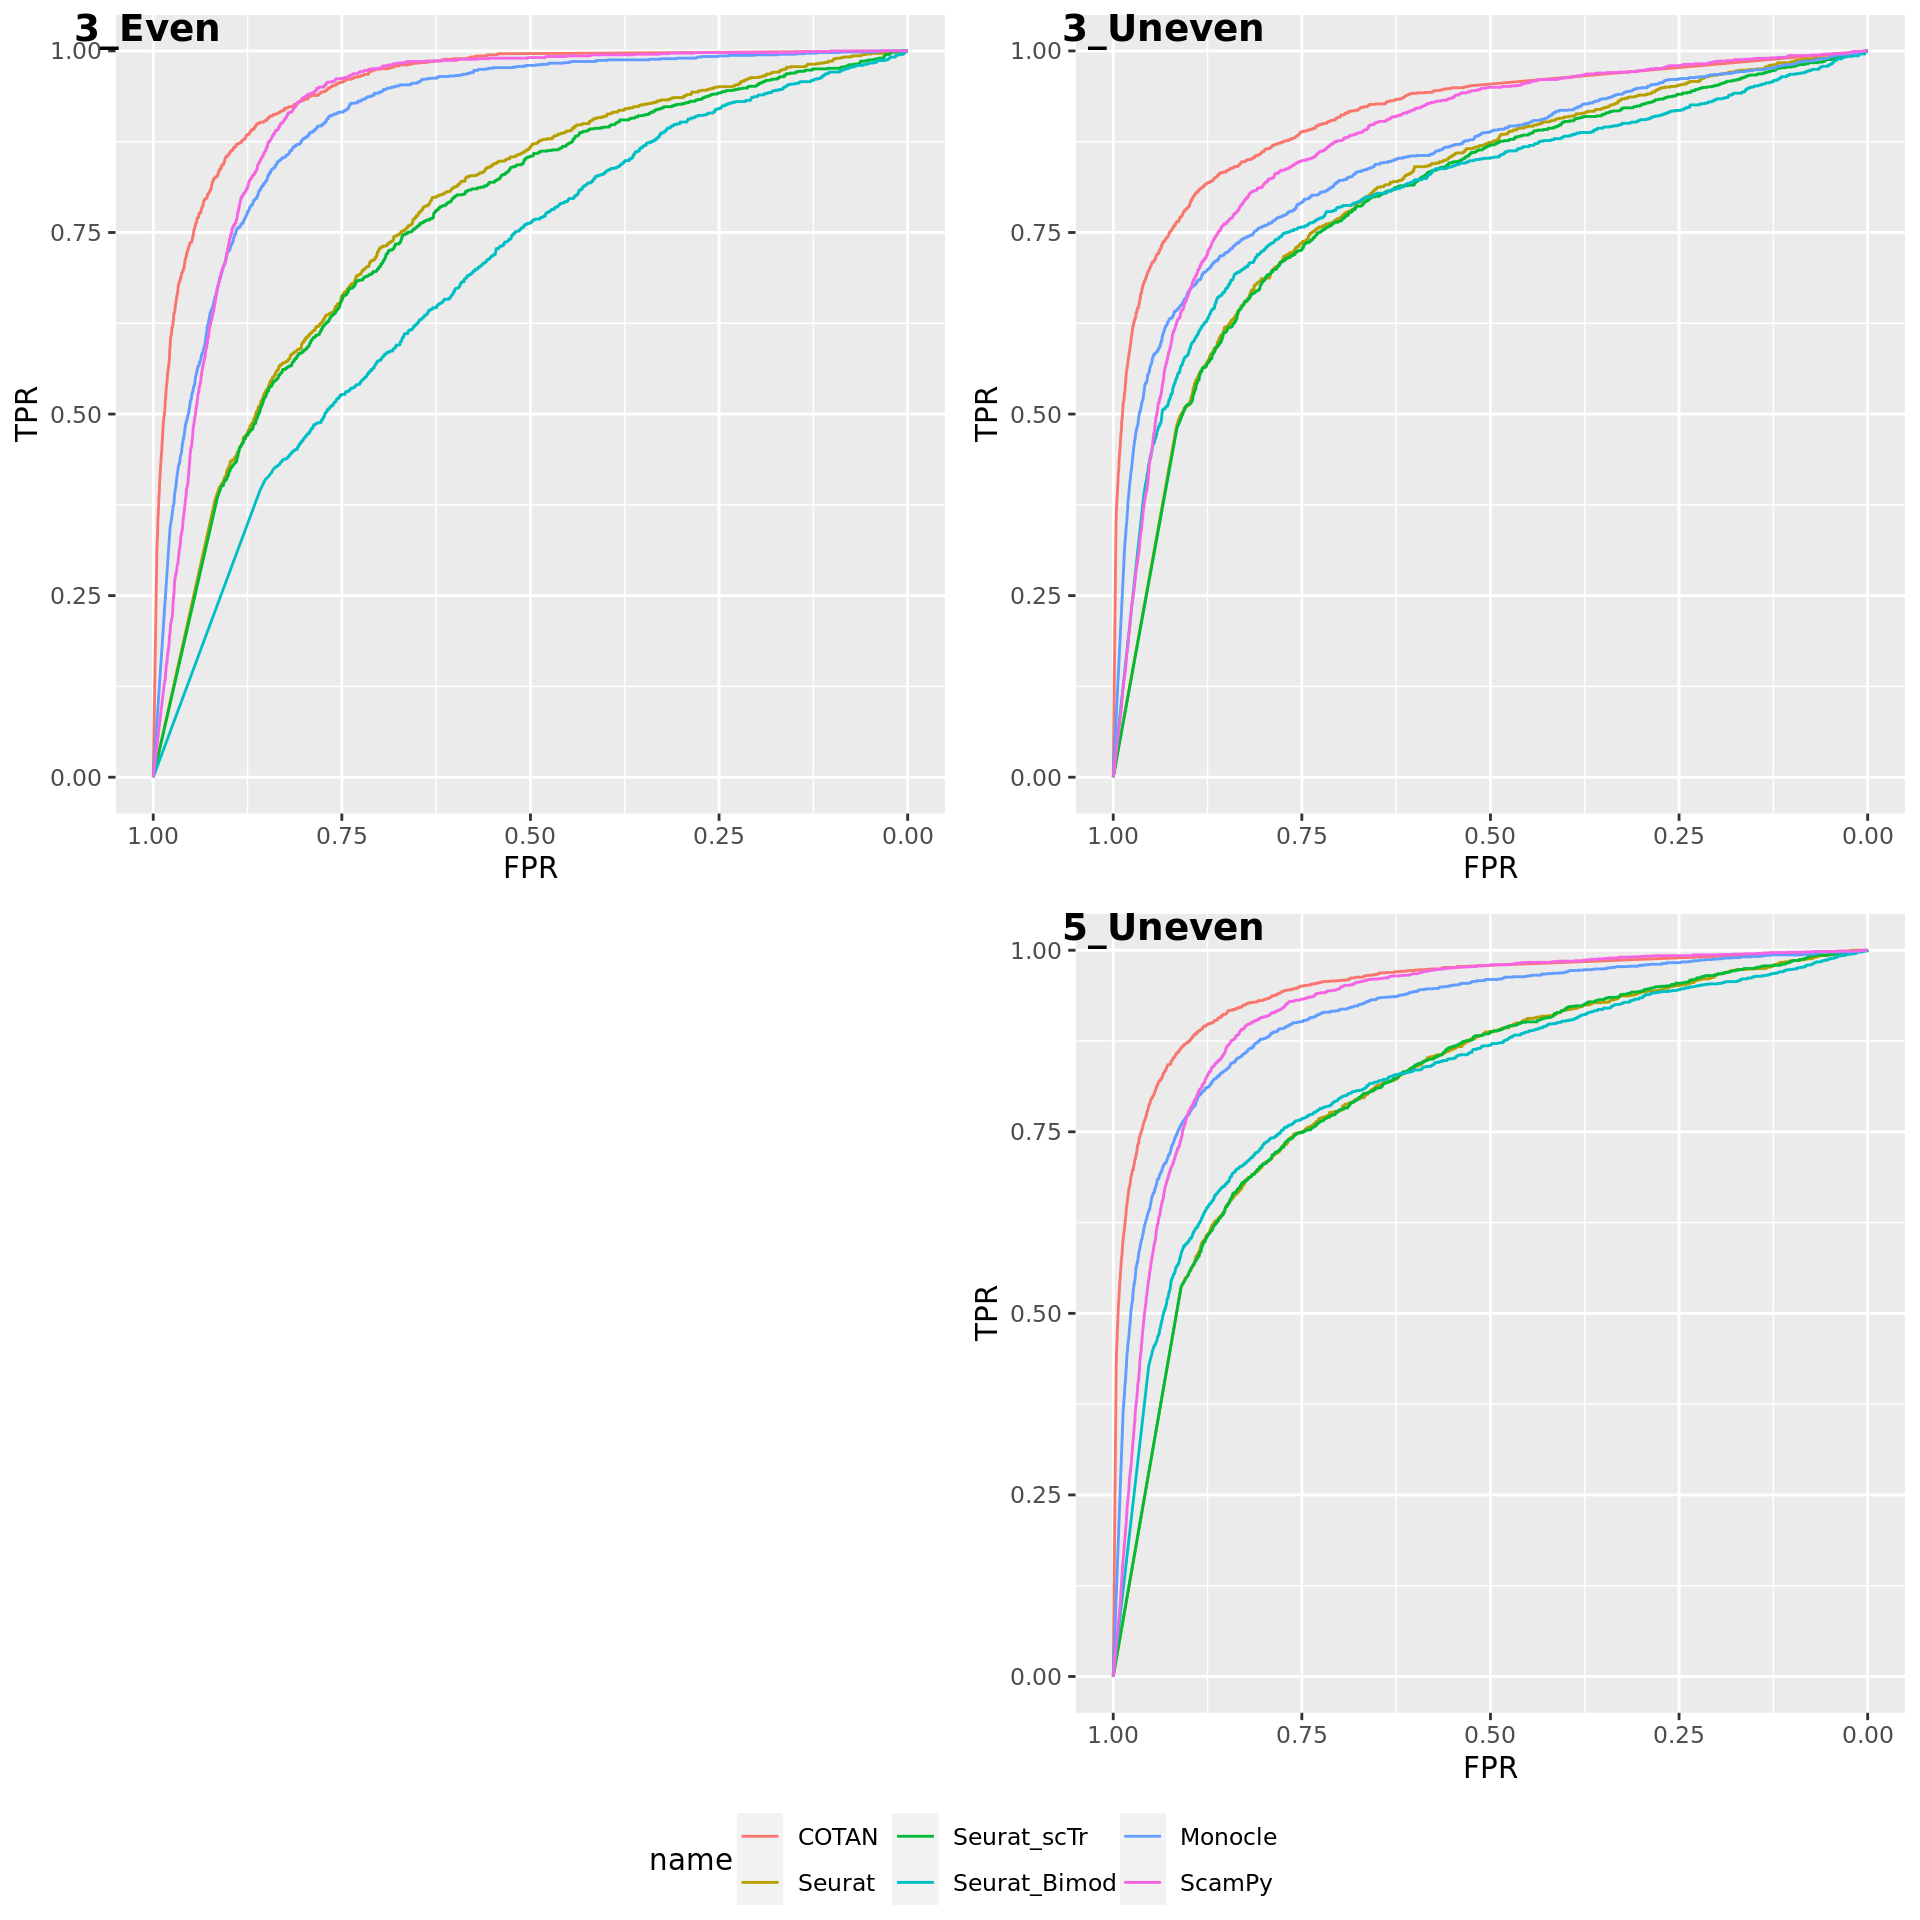
TwoClusters_even_near <- ggroc(list(COTAN=roc_resultCOTAN, Seurat=roc_resultSeurat,
                 Seurat_scTr = roc_resultSeurat_scTr, Seurat_Bimod = roc_resultSeurat_Bimod,
                 Monocle=roc_resultMonocle, ScamPy=roc_resultScamPy))

TwoClusters_even_nearPL <- TwoClusters_even_near + xlab("FPR") + ylab("TPR")
TwoClusters_even_nearPL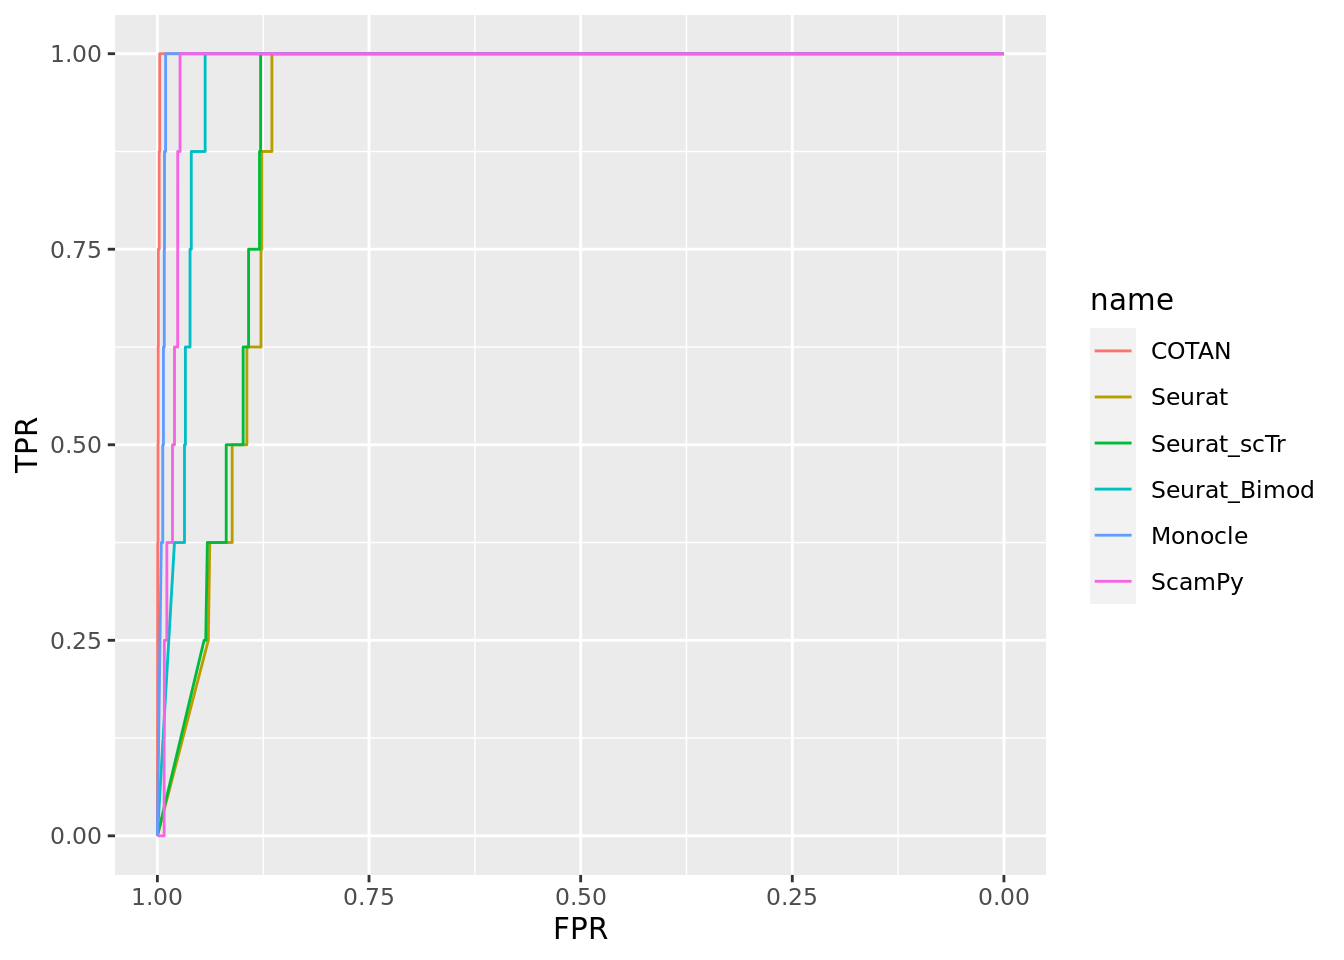
2_Clusters_even_medium
True vector
subset.datasets_csv <-datasets_csv[datasets_csv$Group == "2_Clusters_even_medium",]

ground_truth_tot <- NA

for (ind in 1:dim(subset.datasets_csv)[1]) {
  clusters <- str_split(subset.datasets_csv$Collection[ind],pattern = "_[+]_",simplify = T)

  file.presence.subset <- file.presence[,clusters]


  #file.presence.subset <- as.matrix(file.presence.subset)


  ground_truth <- as.data.frame(matrix(nrow = nrow(file.presence.subset),
                                       ncol = ncol(file.presence.subset)))
  rownames(ground_truth) <- rownames(file.presence.subset)
  colnames(ground_truth) <- colnames(file.presence.subset)

  ground_truth[file.presence.subset == "Absent"] <- 0
  ground_truth[file.presence.subset == "Present"] <- 1
  ground_truth[file.presence.subset == "Uncertain"] <- 0.6

  file.presence.subset <- ground_truth

  for (col in 1:ncol(ground_truth)) {
    ground_truth[,col] <- FALSE
    ground_truth[file.presence.subset[,col] == 1 & rowMeans(file.presence.subset[,-col,drop = FALSE]) < 0.555  ,col] <- TRUE
    }

  ground_truth$genes <- rownames(ground_truth)
  ground_truth <- pivot_longer(ground_truth,
                               cols = 1:(ncol(ground_truth)-1),
                               names_to = "clusters")
  ground_truth$data_set <- subset.datasets_csv[ind,1]
  ground_truth$set_number <- ind
  ground_truth_tot <- rbind(ground_truth_tot, ground_truth)

}
ground_truth_tot <- ground_truth_tot[2:nrow(ground_truth_tot),]

head(ground_truth_tot)
# A tibble: 6 × 5
genes clusters value data_set set_number
<chr> <chr> <lgl> <chr> <int>
1 Neil2 E13.5-187 FALSE 2_Clusters_even_medium 1
2 Neil2 E13.5-184 FALSE 2_Clusters_even_medium 1
3 Lamc1 E13.5-187 FALSE 2_Clusters_even_medium 1
4 Lamc1 E13.5-184 FALSE 2_Clusters_even_medium 1
5 Lama1 E13.5-187 FALSE 2_Clusters_even_medium 1
6 Lama1 E13.5-184 FALSE 2_Clusters_even_medium 1length(unique(ground_truth_tot$genes)) [1] 14695sum(ground_truth_tot$value)[1] 447ROC for COTAN
onlyPositive.pVal.Cotan_tot <- NA

for (ind in 1:dim(subset.datasets_csv)[1]) {
  #print(ind)
  file.code <- paste0(subset.datasets_csv$Group[ind],"_",
                      subset.datasets_csv$Collection[ind])
  dataset <- readRDS(file = file.path(dataSetDir,paste0(file.code,".RDS")))
  deaCOTAN <- getClusterizationData(dataset,clName = "mergedClusters")[[2]]
  pvalCOTAN <- pValueFromDEA(deaCOTAN,
              numCells = getNumCells(dataset),adjustmentMethod = "none")

  clusterization <- getClusterizationData(dataset, clName = "mergedClusters")[[1]]
  cl.names <- NA

  for (cl.val in  unique(clusterization)) {
    #print(cl.val)
    cl.names <- c(cl.names,
                  str_split(names(clusterization[clusterization == cl.val])[1],
                            pattern = "_",simplify = T)[1])
    cl.names <- cl.names[!is.na(cl.names)]
  }
  colnames(deaCOTAN) <- cl.names
  colnames(pvalCOTAN) <- cl.names

  clusters <- str_split(datasets_csv$Collection[ind],pattern = "_[+]_",simplify = T)

  onlyPositive.pVal.Cotan <- pvalCOTAN

    for (cl in cl.names) {
    print(cl)
    #temp.DEA.CotanSign <- deaCOTAN[rownames(pvalCOTAN[pvalCOTAN[,cl] < 0.05,]) ,]
    onlyPositive.pVal.Cotan[rownames(deaCOTAN[deaCOTAN[,cl] < 0,]),cl] <-  1 #onlyPositive.pVal.Cotan[rownames(deaCOTAN[deaCOTAN[,cl] < 0,]),cl]+1
    }

    onlyPositive.pVal.Cotan$genes <- rownames(onlyPositive.pVal.Cotan)
    onlyPositive.pVal.Cotan <- pivot_longer(onlyPositive.pVal.Cotan,
                                            values_to = "p_values",
                               cols = 1:(ncol(onlyPositive.pVal.Cotan)-1),
                               names_to = "clusters")
  onlyPositive.pVal.Cotan$data_set <- subset.datasets_csv[ind,1]
  onlyPositive.pVal.Cotan$set_number <- ind
  onlyPositive.pVal.Cotan_tot <- rbind(onlyPositive.pVal.Cotan_tot, onlyPositive.pVal.Cotan)

  }
[1] "E13.5-187"
[1] "E13.5-184"
[1] "E17.5-516"
[1] "E15.0-434"
[1] "E15.0-508"
[1] "E15.0-437"onlyPositive.pVal.Cotan_tot <- onlyPositive.pVal.Cotan_tot[2:nrow(onlyPositive.pVal.Cotan_tot),]
onlyPositive.pVal.Cotan_tot <- merge.data.frame(onlyPositive.pVal.Cotan_tot,
ground_truth_tot,by = c("genes","clusters","data_set","set_number"),all.x = T,all.y = F)
#onlyPositive.pVal.Cotan_tot <- onlyPositive.pVal.Cotan_tot[order(onlyPositive.pVal.Cotan_tot$p_values,
# decreasing = F),]
# df <- as.data.frame(matrix(nrow = nrow(onlyPositive.pVal.Cotan_tot),ncol = 3))
# colnames(df) <- c("TPR","FPR","Method")
# df$Method <- "COTAN"
#
# Positive <- sum(onlyPositive.pVal.Cotan_tot$value)
# Negative <- sum(!onlyPositive.pVal.Cotan_tot$value)
#
# for (i in 1:nrow(onlyPositive.pVal.Cotan_tot)) {
# df[i,"TPR"] <- sum(onlyPositive.pVal.Cotan_tot[1:i,"value"])/Positive
# df[i,"FPR"] <- (i-sum(onlyPositive.pVal.Cotan_tot[1:i,"value"]))/Negative
# Convert TRUE/FALSE to 1/0
onlyPositive.pVal.Cotan_tot$value <- as.numeric(onlyPositive.pVal.Cotan_tot$value)
# Compute the ROC curve - note that we invert the p-values with 1 - p_values
roc_resultCOTAN <- roc(onlyPositive.pVal.Cotan_tot$value, 1 - onlyPositive.pVal.Cotan_tot$p_values)
# Plot the ROC curve
#plot(roc_resultCOTAN)ROC for Seurat
deaSeurat_tot <- NA

for (ind in 1:dim(subset.datasets_csv)[1]) {
  #print(ind)
  file.code <- paste0(subset.datasets_csv$Group[ind],"_",subset.datasets_csv$Collection[ind])

  dataset <- readRDS(file = file.path(dataSetDir,paste0(file.code,".RDS")))

  clusterization <- getClusterizationData(dataset, clName = "mergedClusters")[[1]]

  deaSeurat <- read.csv(file.path(dirOut,paste0(file.code,"Seurat_DEA_genes.csv")), row.names = 1)

  cl.names <- NA

  for (cl.val in  unique(clusterization)) {
    #print(cl.val)
    cl.name <- str_split(names(clusterization[clusterization == cl.val])[1],
                            pattern = "_",simplify = T)[1]
    cl.names <- c(cl.names,cl.name)
    cl.names <- cl.names[!is.na(cl.names)]

    deaSeurat[deaSeurat$cluster == cl.val,]$cluster <- cl.name

  }

  clusters <- str_split(datasets_csv$Collection[ind],pattern = "_[+]_",simplify = T)

  colnames(deaSeurat) <- str_replace(colnames(deaSeurat),
                                     pattern = "cluster",
                                     replacement = "clusters")
  colnames(deaSeurat) <- str_replace(colnames(deaSeurat),
                                     pattern = "gene",
                                     replacement = "genes")

  deaSeurat$data_set <- subset.datasets_csv[ind,1]
  deaSeurat$set_number <- ind
  deaSeurat_tot <- rbind(deaSeurat_tot, deaSeurat)


  }
 deaSeurat_tot <-  deaSeurat_tot[2:nrow(deaSeurat_tot),]

 deaSeurat_tot <- merge.data.frame(deaSeurat_tot,
                                   ground_truth_tot,
                                   by = c("genes","clusters","data_set","set_number"),
                                   all.x = T,all.y = F)

# Convert TRUE/FALSE to 1/0
deaSeurat_tot$value <- as.numeric(deaSeurat_tot$value)

# Compute the ROC curve - note that we invert the p-values with 1 - p_values
roc_resultSeurat <- roc(deaSeurat_tot$value, 1 - deaSeurat_tot$p_val)

# Plot the ROC curve
#plot(roc_resultSeurat)
ROC for Seurat scTransform
deaSeurat_tot <- NA

for (ind in 1:dim(subset.datasets_csv)[1]) {
  #print(ind)
  file.code <- paste0(subset.datasets_csv$Group[ind],"_",subset.datasets_csv$Collection[ind])

  dataset <- readRDS(file = file.path(dataSetDir,paste0(file.code,".RDS")))

  clusterization <- getClusterizationData(dataset, clName = "mergedClusters")[[1]]

  deaSeurat <- read.csv(file.path(dirOut,paste0(file.code,"Seurat_DEA_ScTransform_genes.csv")), row.names = 1)

  cl.names <- NA

  for (cl.val in  unique(clusterization)) {
    #print(cl.val)
    cl.name <- str_split(names(clusterization[clusterization == cl.val])[1],
                            pattern = "_",simplify = T)[1]
    cl.names <- c(cl.names,cl.name)
    cl.names <- cl.names[!is.na(cl.names)]

    deaSeurat[deaSeurat$cluster == cl.val,]$cluster <- cl.name

  }

  clusters <- str_split(datasets_csv$Collection[ind],pattern = "_[+]_",simplify = T)

  colnames(deaSeurat) <- str_replace(colnames(deaSeurat),
                                     pattern = "cluster",
                                     replacement = "clusters")
  colnames(deaSeurat) <- str_replace(colnames(deaSeurat),
                                     pattern = "gene",
                                     replacement = "genes")

  deaSeurat$data_set <- subset.datasets_csv[ind,1]
  deaSeurat$set_number <- ind
  deaSeurat_tot <- rbind(deaSeurat_tot, deaSeurat)


  }
 deaSeurat_tot <-  deaSeurat_tot[2:nrow(deaSeurat_tot),]

 deaSeurat_tot <- merge.data.frame(deaSeurat_tot,
                                   ground_truth_tot,
                                   by = c("genes","clusters","data_set","set_number"),
                                   all.x = T,all.y = F)

# Convert TRUE/FALSE to 1/0
deaSeurat_tot$value <- as.numeric(deaSeurat_tot$value)

# Compute the ROC curve - note that we invert the p-values with 1 - p_values
roc_resultSeurat_scTr <- roc(deaSeurat_tot$value, 1 - deaSeurat_tot$p_val)
ROC for Seurat Bimod
deaSeurat_tot <- NA

for (ind in 1:dim(subset.datasets_csv)[1]) {
  #print(ind)
  file.code <- paste0(subset.datasets_csv$Group[ind],"_",subset.datasets_csv$Collection[ind])

  dataset <- readRDS(file = file.path(dataSetDir,paste0(file.code,".RDS")))

  clusterization <- getClusterizationData(dataset, clName = "mergedClusters")[[1]]

  deaSeurat <- read.csv(file.path(dirOut,paste0(file.code,"Seurat_DEA_Bimod_genes.csv")), row.names = 1)

  cl.names <- NA

  for (cl.val in  unique(clusterization)) {
    #print(cl.val)
    cl.name <- str_split(names(clusterization[clusterization == cl.val])[1],
                            pattern = "_",simplify = T)[1]
    cl.names <- c(cl.names,cl.name)
    cl.names <- cl.names[!is.na(cl.names)]

    deaSeurat[deaSeurat$cluster == cl.val,]$cluster <- cl.name

  }

  clusters <- str_split(datasets_csv$Collection[ind],pattern = "_[+]_",simplify = T)

  colnames(deaSeurat) <- str_replace(colnames(deaSeurat),
                                     pattern = "cluster",
                                     replacement = "clusters")
  colnames(deaSeurat) <- str_replace(colnames(deaSeurat),
                                     pattern = "gene",
                                     replacement = "genes")

  deaSeurat$data_set <- subset.datasets_csv[ind,1]
  deaSeurat$set_number <- ind
  deaSeurat_tot <- rbind(deaSeurat_tot, deaSeurat)


  }
 deaSeurat_tot <-  deaSeurat_tot[2:nrow(deaSeurat_tot),]

 deaSeurat_tot <- merge.data.frame(deaSeurat_tot,
                                   ground_truth_tot,
                                   by = c("genes","clusters","data_set","set_number"),
                                   all.x = T,all.y = F)

# Convert TRUE/FALSE to 1/0
deaSeurat_tot$value <- as.numeric(deaSeurat_tot$value)

# Compute the ROC curve - note that we invert the p-values with 1 - p_values
roc_resultSeurat_Bimod <- roc(deaSeurat_tot$value, 1 - deaSeurat_tot$p_val)
ROC for Monocle
deaMonocle_tot <- NA
for (ind in 1:dim(subset.datasets_csv)[1]) {
  file.code <- paste0(subset.datasets_csv$Group[ind],"_",subset.datasets_csv$Collection[ind])
  dataset <- readRDS(file = file.path(dataSetDir,paste0(file.code,".RDS")))

  clusterization <- getClusterizationData(dataset, clName = "mergedClusters")[[1]]
  #print(file.code)

  deaMonocle <- read.csv(file.path(dirOut,paste0(file.code,"Monocle_DEA_genes.csv")),row.names = 1)

  cl.names <- NA

  for (cl.val in  unique(clusterization)) {
    #print(cl.val)
    cl.name <- str_split(names(clusterization[clusterization == cl.val])[1],
                            pattern = "_",simplify = T)[1]
    cl.names <- c(cl.names,cl.name)
    cl.names <- cl.names[!is.na(cl.names)]

    deaMonocle[deaMonocle$cell_group == cl.val,"cell_group"] <- cl.name

  }

  clusters <- str_split(datasets_csv$Collection[ind],pattern = "_[+]_",simplify = T)

  colnames(deaMonocle) <- str_replace(colnames(deaMonocle),
                                     pattern = "cell_group",
                                     replacement = "clusters")
  colnames(deaMonocle) <- str_replace(colnames(deaMonocle),
                                     pattern = "gene_id",
                                     replacement = "genes")

  deaMonocle$data_set <- subset.datasets_csv[ind,1]
  deaMonocle$set_number <- ind
  deaMonocle <- as.data.frame(deaMonocle)
  deaMonocle_tot <- rbind(deaMonocle_tot, deaMonocle)


  }
 deaMonocle_tot <-  deaMonocle_tot[2:nrow(deaMonocle_tot),]

 deaMonocle_tot <- merge.data.frame(deaMonocle_tot,
                                   ground_truth_tot,
                                   by = c("genes","clusters","data_set","set_number"),
                                   all.x = T,all.y = F)

# Convert TRUE/FALSE to 1/0
deaMonocle_tot$value <- as.numeric(deaMonocle_tot$value)

# Compute the ROC curve - note that we invert the p-values with 1 - p_values
roc_resultMonocle <- roc(deaMonocle_tot$value, 1 - deaMonocle_tot$marker_test_p_value)

# Plot the ROC curve
#plot(roc_resultMonocle)
ROC from ScamPy
deaScamPy_tot <- NA
for (ind in 1:dim(subset.datasets_csv)[1]) {
  file.code <- paste0(subset.datasets_csv$Group[ind],"_",subset.datasets_csv$Collection[ind])
  dataset <- readRDS(file = file.path(dataSetDir,paste0(file.code,".RDS")))

  clusterization <- getClusterizationData(dataset, clName = "mergedClusters")[[1]]
  #print(file.code)

  deaScamPy <- read.csv(file.path(dirOut,paste0(file.code,"ScanPy_DEA_genes.csv")),
                        row.names = 1)

  cl.names <- NA

  for (cl.val in  unique(clusterization)) {
    #print(cl.val)
    cl.name <- str_split(names(clusterization[clusterization == cl.val])[1],
                            pattern = "_",simplify = T)[1]
    cl.names <- c(cl.names,cl.name)
    cl.names <- cl.names[!is.na(cl.names)]

    deaScamPy[deaScamPy$clusters == paste0("cl",cl.val),"clusters"] <- cl.name

  }

  clusters <- str_split(datasets_csv$Collection[ind],pattern = "_[+]_",simplify = T)


  deaScamPy$data_set <- subset.datasets_csv[ind,1]
  deaScamPy$set_number <- ind
  deaScamPy_tot <- rbind(deaScamPy_tot, deaScamPy)


  }
 deaScamPy_tot <-  deaScamPy_tot[2:nrow(deaScamPy_tot),]

 deaScamPy_tot <- merge.data.frame(deaScamPy_tot,
                                   ground_truth_tot,
                                   by = c("genes","clusters","data_set","set_number"),
                                   all.x = T,all.y = F)

# Convert TRUE/FALSE to 1/0
deaScamPy_tot$value <- as.numeric(deaScamPy_tot$value)

# Compute the ROC curve - note that we invert the p-values with 1 - p_values
roc_resultScamPy <- roc(deaScamPy_tot$value, 1 - deaScamPy_tot$pval)

# Plot the ROC curve
#plot(roc_resultScamPy)
Summary ROC for all methods
Two_Clusters_even_medium <- ggroc(list(COTAN=roc_resultCOTAN, Seurat=roc_resultSeurat,                  Seurat_scTr = roc_resultSeurat_scTr, Seurat_Bimod = roc_resultSeurat_Bimod,
                 Monocle=roc_resultMonocle, ScamPy=roc_resultScamPy))

Two_Clusters_even_mediumPL <- Two_Clusters_even_medium + xlab("FPR") + ylab("TPR")
Two_Clusters_even_mediumPL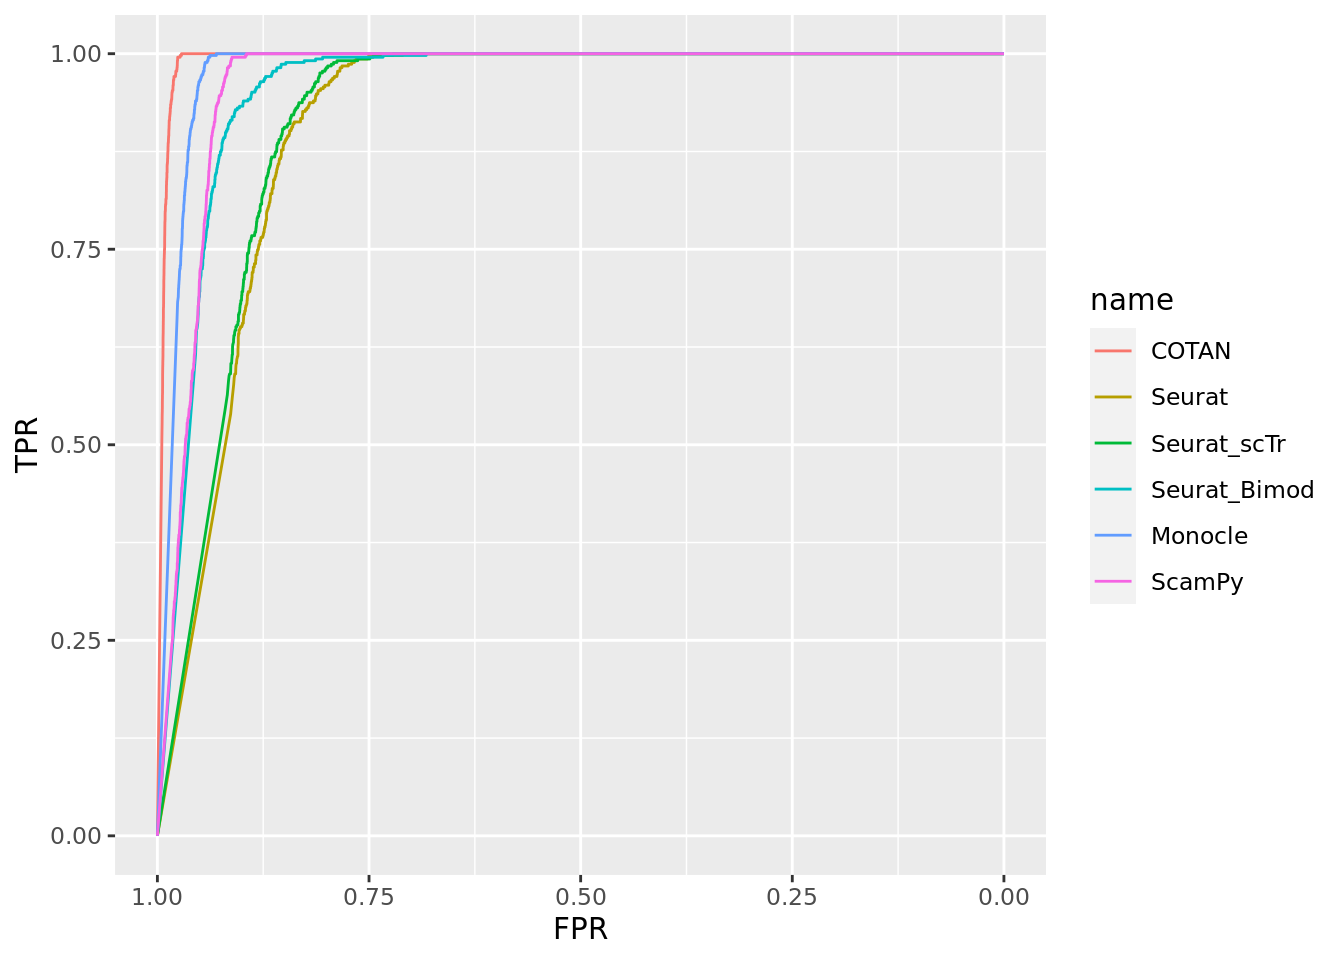
2_Clusters_even_far
True vector
subset.datasets_csv <-datasets_csv[datasets_csv$Group == "2_Clusters_even_far",]

ground_truth_tot <- NA

for (ind in 1:dim(subset.datasets_csv)[1]) {
  clusters <- str_split(subset.datasets_csv$Collection[ind],pattern = "_[+]_",simplify = T)

  file.presence.subset <- file.presence[,clusters]


  #file.presence.subset <- as.matrix(file.presence.subset)


  ground_truth <- as.data.frame(matrix(nrow = nrow(file.presence.subset),
                                       ncol = ncol(file.presence.subset)))
  rownames(ground_truth) <- rownames(file.presence.subset)
  colnames(ground_truth) <- colnames(file.presence.subset)

  ground_truth[file.presence.subset == "Absent"] <- 0
  ground_truth[file.presence.subset == "Present"] <- 1
  ground_truth[file.presence.subset == "Uncertain"] <- 0.6

  file.presence.subset <- ground_truth

  for (col in 1:ncol(ground_truth)) {
    ground_truth[,col] <- FALSE
    ground_truth[file.presence.subset[,col] == 1 & rowMeans(file.presence.subset[,-col,drop = FALSE]) < 0.555  ,col] <- TRUE
    }

  ground_truth$genes <- rownames(ground_truth)
  ground_truth <- pivot_longer(ground_truth,
                               cols = 1:(ncol(ground_truth)-1),
                               names_to = "clusters")
  ground_truth$data_set <- subset.datasets_csv[ind,1]
  ground_truth$set_number <- ind
  ground_truth_tot <- rbind(ground_truth_tot, ground_truth)

}
ground_truth_tot <- ground_truth_tot[2:nrow(ground_truth_tot),]

head(ground_truth_tot)
# A tibble: 6 × 5
genes clusters value data_set set_number
<chr> <chr> <lgl> <chr> <int>
1 Neil2 E17.5-516 FALSE 2_Clusters_even_far 1
2 Neil2 E13.5-187 FALSE 2_Clusters_even_far 1
3 Lamc1 E17.5-516 FALSE 2_Clusters_even_far 1
4 Lamc1 E13.5-187 FALSE 2_Clusters_even_far 1
5 Lama1 E17.5-516 FALSE 2_Clusters_even_far 1
6 Lama1 E13.5-187 FALSE 2_Clusters_even_far 1length(unique(ground_truth_tot$genes)) [1] 14695sum(ground_truth_tot$value)[1] 1359ROC for COTAN
onlyPositive.pVal.Cotan_tot <- NA

for (ind in 1:dim(subset.datasets_csv)[1]) {
  #print(ind)
  file.code <- paste0(subset.datasets_csv$Group[ind],"_",
                      subset.datasets_csv$Collection[ind])
  dataset <- readRDS(file = file.path(dataSetDir,paste0(file.code,".RDS")))
  deaCOTAN <- getClusterizationData(dataset,clName = "mergedClusters")[[2]]
  pvalCOTAN <- pValueFromDEA(deaCOTAN,
              numCells = getNumCells(dataset),adjustmentMethod = "none")

  clusterization <- getClusterizationData(dataset, clName = "mergedClusters")[[1]]
  cl.names <- NA

  for (cl.val in  unique(clusterization)) {
    #print(cl.val)
    cl.names <- c(cl.names,
                  str_split(names(clusterization[clusterization == cl.val])[1],
                            pattern = "_",simplify = T)[1])
    cl.names <- cl.names[!is.na(cl.names)]
  }
  colnames(deaCOTAN) <- cl.names
  colnames(pvalCOTAN) <- cl.names

  clusters <- str_split(datasets_csv$Collection[ind],pattern = "_[+]_",simplify = T)

  onlyPositive.pVal.Cotan <- pvalCOTAN

    for (cl in cl.names) {
    print(cl)
    #temp.DEA.CotanSign <- deaCOTAN[rownames(pvalCOTAN[pvalCOTAN[,cl] < 0.05,]) ,]
    onlyPositive.pVal.Cotan[rownames(deaCOTAN[deaCOTAN[,cl] < 0,]),cl] <-  1 #onlyPositive.pVal.Cotan[rownames(deaCOTAN[deaCOTAN[,cl] < 0,]),cl]+1
    }

    onlyPositive.pVal.Cotan$genes <- rownames(onlyPositive.pVal.Cotan)
    onlyPositive.pVal.Cotan <- pivot_longer(onlyPositive.pVal.Cotan,
                                            values_to = "p_values",
                               cols = 1:(ncol(onlyPositive.pVal.Cotan)-1),
                               names_to = "clusters")
  onlyPositive.pVal.Cotan$data_set <- subset.datasets_csv[ind,1]
  onlyPositive.pVal.Cotan$set_number <- ind
  onlyPositive.pVal.Cotan_tot <- rbind(onlyPositive.pVal.Cotan_tot, onlyPositive.pVal.Cotan)

  }
[1] "E13.5-187"
[1] "E17.5-516"
[1] "E15.0-510"
[1] "E13.5-437"
[1] "E15.0-509"
[1] "E13.5-184"onlyPositive.pVal.Cotan_tot <- onlyPositive.pVal.Cotan_tot[2:nrow(onlyPositive.pVal.Cotan_tot),]
onlyPositive.pVal.Cotan_tot <- merge.data.frame(onlyPositive.pVal.Cotan_tot,
ground_truth_tot,by = c("genes","clusters","data_set","set_number"),all.x = T,all.y = F)
#onlyPositive.pVal.Cotan_tot <- onlyPositive.pVal.Cotan_tot[order(onlyPositive.pVal.Cotan_tot$p_values,
# decreasing = F),]
# df <- as.data.frame(matrix(nrow = nrow(onlyPositive.pVal.Cotan_tot),ncol = 3))
# colnames(df) <- c("TPR","FPR","Method")
# df$Method <- "COTAN"
#
# Positive <- sum(onlyPositive.pVal.Cotan_tot$value)
# Negative <- sum(!onlyPositive.pVal.Cotan_tot$value)
#
# for (i in 1:nrow(onlyPositive.pVal.Cotan_tot)) {
# df[i,"TPR"] <- sum(onlyPositive.pVal.Cotan_tot[1:i,"value"])/Positive
# df[i,"FPR"] <- (i-sum(onlyPositive.pVal.Cotan_tot[1:i,"value"]))/Negative
# Convert TRUE/FALSE to 1/0
onlyPositive.pVal.Cotan_tot$value <- as.numeric(onlyPositive.pVal.Cotan_tot$value)
# Compute the ROC curve - note that we invert the p-values with 1 - p_values
roc_resultCOTAN <- roc(onlyPositive.pVal.Cotan_tot$value, 1 - onlyPositive.pVal.Cotan_tot$p_values)
# Plot the ROC curve
#plot(roc_resultCOTAN)ROC for Seurat
deaSeurat_tot <- NA

for (ind in 1:dim(subset.datasets_csv)[1]) {
  #print(ind)
  file.code <- paste0(subset.datasets_csv$Group[ind],"_",subset.datasets_csv$Collection[ind])

  dataset <- readRDS(file = file.path(dataSetDir,paste0(file.code,".RDS")))

  clusterization <- getClusterizationData(dataset, clName = "mergedClusters")[[1]]

  deaSeurat <- read.csv(file.path(dirOut,paste0(file.code,"Seurat_DEA_genes.csv")), row.names = 1)

  cl.names <- NA

  for (cl.val in  unique(clusterization)) {
    #print(cl.val)
    cl.name <- str_split(names(clusterization[clusterization == cl.val])[1],
                            pattern = "_",simplify = T)[1]
    cl.names <- c(cl.names,cl.name)
    cl.names <- cl.names[!is.na(cl.names)]

    deaSeurat[deaSeurat$cluster == cl.val,]$cluster <- cl.name

  }

  clusters <- str_split(datasets_csv$Collection[ind],pattern = "_[+]_",simplify = T)

  colnames(deaSeurat) <- str_replace(colnames(deaSeurat),
                                     pattern = "cluster",
                                     replacement = "clusters")
  colnames(deaSeurat) <- str_replace(colnames(deaSeurat),
                                     pattern = "gene",
                                     replacement = "genes")

  deaSeurat$data_set <- subset.datasets_csv[ind,1]
  deaSeurat$set_number <- ind
  deaSeurat_tot <- rbind(deaSeurat_tot, deaSeurat)


  }
 deaSeurat_tot <-  deaSeurat_tot[2:nrow(deaSeurat_tot),]

 deaSeurat_tot <- merge.data.frame(deaSeurat_tot,
                                   ground_truth_tot,
                                   by = c("genes","clusters","data_set","set_number"),
                                   all.x = T,all.y = F)

# Convert TRUE/FALSE to 1/0
deaSeurat_tot$value <- as.numeric(deaSeurat_tot$value)

# Compute the ROC curve - note that we invert the p-values with 1 - p_values
roc_resultSeurat <- roc(deaSeurat_tot$value, 1 - deaSeurat_tot$p_val)

# Plot the ROC curve
#plot(roc_resultSeurat)
ROC for Seurat scTransform
deaSeurat_tot <- NA

for (ind in 1:dim(subset.datasets_csv)[1]) {
  #print(ind)
  file.code <- paste0(subset.datasets_csv$Group[ind],"_",subset.datasets_csv$Collection[ind])

  dataset <- readRDS(file = file.path(dataSetDir,paste0(file.code,".RDS")))

  clusterization <- getClusterizationData(dataset, clName = "mergedClusters")[[1]]

  deaSeurat <- read.csv(file.path(dirOut,paste0(file.code,"Seurat_DEA_ScTransform_genes.csv")), row.names = 1)

  cl.names <- NA

  for (cl.val in  unique(clusterization)) {
    #print(cl.val)
    cl.name <- str_split(names(clusterization[clusterization == cl.val])[1],
                            pattern = "_",simplify = T)[1]
    cl.names <- c(cl.names,cl.name)
    cl.names <- cl.names[!is.na(cl.names)]

    deaSeurat[deaSeurat$cluster == cl.val,]$cluster <- cl.name

  }

  clusters <- str_split(datasets_csv$Collection[ind],pattern = "_[+]_",simplify = T)

  colnames(deaSeurat) <- str_replace(colnames(deaSeurat),
                                     pattern = "cluster",
                                     replacement = "clusters")
  colnames(deaSeurat) <- str_replace(colnames(deaSeurat),
                                     pattern = "gene",
                                     replacement = "genes")

  deaSeurat$data_set <- subset.datasets_csv[ind,1]
  deaSeurat$set_number <- ind
  deaSeurat_tot <- rbind(deaSeurat_tot, deaSeurat)


  }
 deaSeurat_tot <-  deaSeurat_tot[2:nrow(deaSeurat_tot),]

 deaSeurat_tot <- merge.data.frame(deaSeurat_tot,
                                   ground_truth_tot,
                                   by = c("genes","clusters","data_set","set_number"),
                                   all.x = T,all.y = F)

# Convert TRUE/FALSE to 1/0
deaSeurat_tot$value <- as.numeric(deaSeurat_tot$value)

# Compute the ROC curve - note that we invert the p-values with 1 - p_values
roc_resultSeurat_scTr <- roc(deaSeurat_tot$value, 1 - deaSeurat_tot$p_val)
ROC for Seurat Bimod
deaSeurat_tot <- NA

for (ind in 1:dim(subset.datasets_csv)[1]) {
  #print(ind)
  file.code <- paste0(subset.datasets_csv$Group[ind],"_",subset.datasets_csv$Collection[ind])

  dataset <- readRDS(file = file.path(dataSetDir,paste0(file.code,".RDS")))

  clusterization <- getClusterizationData(dataset, clName = "mergedClusters")[[1]]

  deaSeurat <- read.csv(file.path(dirOut,paste0(file.code,"Seurat_DEA_Bimod_genes.csv")), row.names = 1)

  cl.names <- NA

  for (cl.val in  unique(clusterization)) {
    #print(cl.val)
    cl.name <- str_split(names(clusterization[clusterization == cl.val])[1],
                            pattern = "_",simplify = T)[1]
    cl.names <- c(cl.names,cl.name)
    cl.names <- cl.names[!is.na(cl.names)]

    deaSeurat[deaSeurat$cluster == cl.val,]$cluster <- cl.name

  }

  clusters <- str_split(datasets_csv$Collection[ind],pattern = "_[+]_",simplify = T)

  colnames(deaSeurat) <- str_replace(colnames(deaSeurat),
                                     pattern = "cluster",
                                     replacement = "clusters")
  colnames(deaSeurat) <- str_replace(colnames(deaSeurat),
                                     pattern = "gene",
                                     replacement = "genes")

  deaSeurat$data_set <- subset.datasets_csv[ind,1]
  deaSeurat$set_number <- ind
  deaSeurat_tot <- rbind(deaSeurat_tot, deaSeurat)


  }
 deaSeurat_tot <-  deaSeurat_tot[2:nrow(deaSeurat_tot),]

 deaSeurat_tot <- merge.data.frame(deaSeurat_tot,
                                   ground_truth_tot,
                                   by = c("genes","clusters","data_set","set_number"),
                                   all.x = T,all.y = F)

# Convert TRUE/FALSE to 1/0
deaSeurat_tot$value <- as.numeric(deaSeurat_tot$value)

# Compute the ROC curve - note that we invert the p-values with 1 - p_values
roc_resultSeurat_Bimod <- roc(deaSeurat_tot$value, 1 - deaSeurat_tot$p_val)
ROC for Monocle
deaMonocle_tot <- NA
for (ind in 1:dim(subset.datasets_csv)[1]) {
  file.code <- paste0(subset.datasets_csv$Group[ind],"_",subset.datasets_csv$Collection[ind])
  dataset <- readRDS(file = file.path(dataSetDir,paste0(file.code,".RDS")))

  clusterization <- getClusterizationData(dataset, clName = "mergedClusters")[[1]]
  #print(file.code)

  deaMonocle <- read.csv(file.path(dirOut,paste0(file.code,"Monocle_DEA_genes.csv")),row.names = 1)

  cl.names <- NA

  for (cl.val in  unique(clusterization)) {
    #print(cl.val)
    cl.name <- str_split(names(clusterization[clusterization == cl.val])[1],
                            pattern = "_",simplify = T)[1]
    cl.names <- c(cl.names,cl.name)
    cl.names <- cl.names[!is.na(cl.names)]

    deaMonocle[deaMonocle$cell_group == cl.val,"cell_group"] <- cl.name

  }

  clusters <- str_split(datasets_csv$Collection[ind],pattern = "_[+]_",simplify = T)

  colnames(deaMonocle) <- str_replace(colnames(deaMonocle),
                                     pattern = "cell_group",
                                     replacement = "clusters")
  colnames(deaMonocle) <- str_replace(colnames(deaMonocle),
                                     pattern = "gene_id",
                                     replacement = "genes")

  deaMonocle$data_set <- subset.datasets_csv[ind,1]
  deaMonocle$set_number <- ind
  deaMonocle <- as.data.frame(deaMonocle)
  deaMonocle_tot <- rbind(deaMonocle_tot, deaMonocle)


  }
 deaMonocle_tot <-  deaMonocle_tot[2:nrow(deaMonocle_tot),]

 deaMonocle_tot <- merge.data.frame(deaMonocle_tot,
                                   ground_truth_tot,
                                   by = c("genes","clusters","data_set","set_number"),
                                   all.x = T,all.y = F)

# Convert TRUE/FALSE to 1/0
deaMonocle_tot$value <- as.numeric(deaMonocle_tot$value)

# Compute the ROC curve - note that we invert the p-values with 1 - p_values
roc_resultMonocle <- roc(deaMonocle_tot$value, 1 - deaMonocle_tot$marker_test_p_value)

# Plot the ROC curve
#plot(roc_resultMonocle)
ROC from ScamPy
deaScamPy_tot <- NA
for (ind in 1:dim(subset.datasets_csv)[1]) {
  file.code <- paste0(subset.datasets_csv$Group[ind],"_",subset.datasets_csv$Collection[ind])
  dataset <- readRDS(file = file.path(dataSetDir,paste0(file.code,".RDS")))

  clusterization <- getClusterizationData(dataset, clName = "mergedClusters")[[1]]
  #print(file.code)

  deaScamPy <- read.csv(file.path(dirOut,paste0(file.code,"ScanPy_DEA_genes.csv")),
                        row.names = 1)

  cl.names <- NA

  for (cl.val in  unique(clusterization)) {
    #print(cl.val)
    cl.name <- str_split(names(clusterization[clusterization == cl.val])[1],
                            pattern = "_",simplify = T)[1]
    cl.names <- c(cl.names,cl.name)
    cl.names <- cl.names[!is.na(cl.names)]

    deaScamPy[deaScamPy$clusters == paste0("cl",cl.val),"clusters"] <- cl.name

  }

  clusters <- str_split(datasets_csv$Collection[ind],pattern = "_[+]_",simplify = T)


  deaScamPy$data_set <- subset.datasets_csv[ind,1]
  deaScamPy$set_number <- ind
  deaScamPy_tot <- rbind(deaScamPy_tot, deaScamPy)


  }
 deaScamPy_tot <-  deaScamPy_tot[2:nrow(deaScamPy_tot),]

 deaScamPy_tot <- merge.data.frame(deaScamPy_tot,
                                   ground_truth_tot,
                                   by = c("genes","clusters","data_set","set_number"),
                                   all.x = T,all.y = F)

# Convert TRUE/FALSE to 1/0
deaScamPy_tot$value <- as.numeric(deaScamPy_tot$value)

# Compute the ROC curve - note that we invert the p-values with 1 - p_values
roc_resultScamPy <- roc(deaScamPy_tot$value, 1 - deaScamPy_tot$pval)

# Plot the ROC curve
#plot(roc_resultScamPy)
Summary ROC for all methods
Two_Clusters_even_far <- ggroc(list(COTAN=roc_resultCOTAN, Seurat=roc_resultSeurat,                  Seurat_scTr = roc_resultSeurat_scTr, Seurat_Bimod = roc_resultSeurat_Bimod,
                 Monocle=roc_resultMonocle, ScamPy=roc_resultScamPy))

Two_Clusters_even_farPL <- Two_Clusters_even_far + xlab("FPR") + ylab("TPR")
Two_Clusters_even_farPL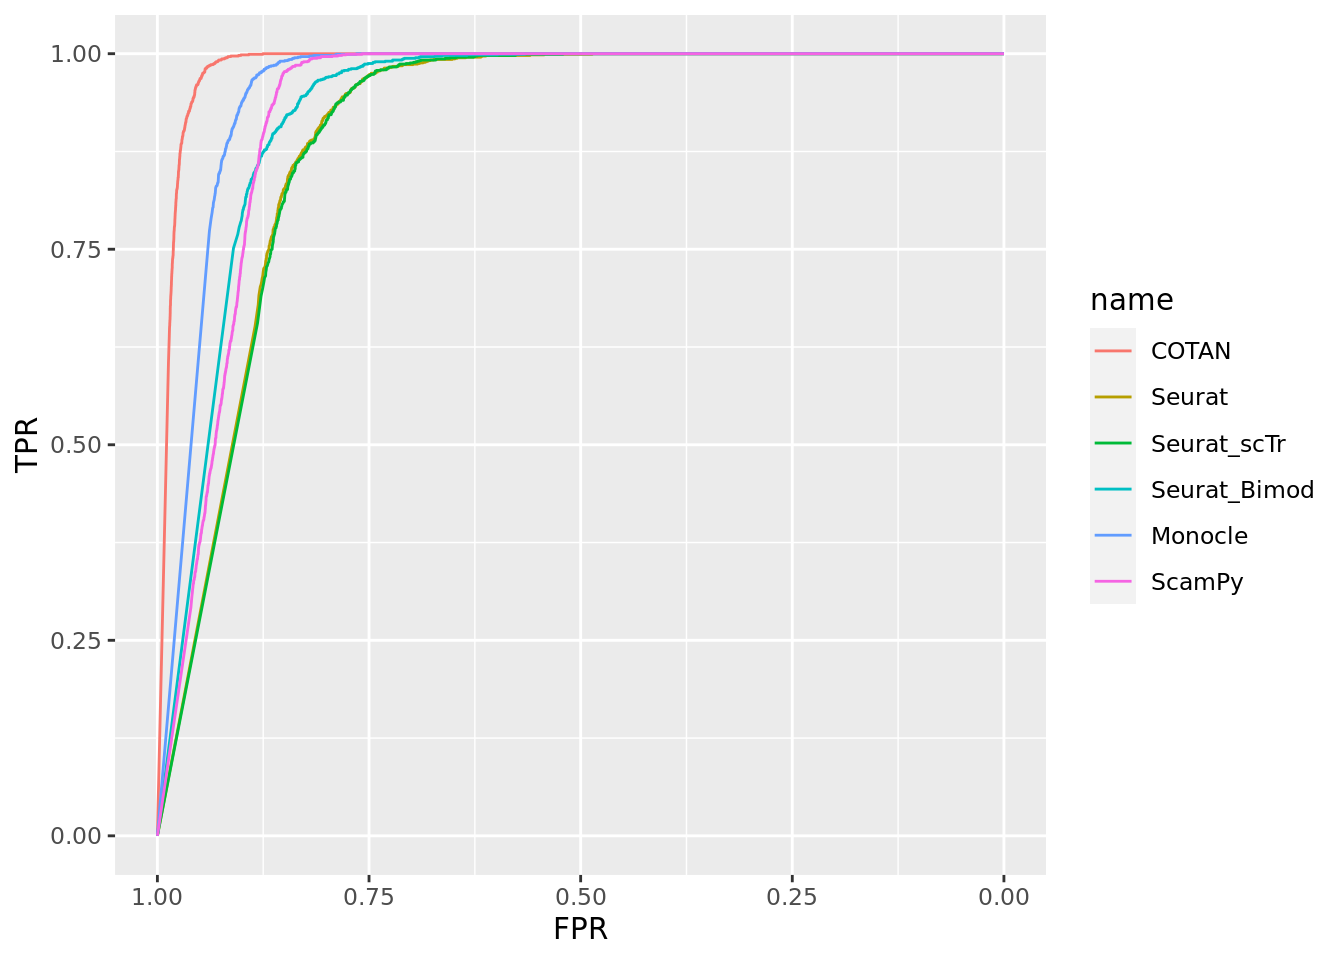
2 clusters uneven
2_Clusters_uneven_near
True vector
subset.datasets_csv <-datasets_csv[datasets_csv$Group == "2_Clusters_uneven_near",]

ground_truth_tot <- NA

for (ind in 1:dim(subset.datasets_csv)[1]) {
  clusters <- str_split(subset.datasets_csv$Collection[ind],pattern = "_[+]_",simplify = T)

  file.presence.subset <- file.presence[,clusters]


  #file.presence.subset <- as.matrix(file.presence.subset)


  ground_truth <- as.data.frame(matrix(nrow = nrow(file.presence.subset),
                                       ncol = ncol(file.presence.subset)))
  rownames(ground_truth) <- rownames(file.presence.subset)
  colnames(ground_truth) <- colnames(file.presence.subset)

  ground_truth[file.presence.subset == "Absent"] <- 0
  ground_truth[file.presence.subset == "Present"] <- 1
  ground_truth[file.presence.subset == "Uncertain"] <- 0.6

  file.presence.subset <- ground_truth

  for (col in 1:ncol(ground_truth)) {
    ground_truth[,col] <- FALSE
    ground_truth[file.presence.subset[,col] == 1 & rowMeans(file.presence.subset[,-col,drop = FALSE]) < 0.555  ,col] <- TRUE
    }

  ground_truth$genes <- rownames(ground_truth)
  ground_truth <- pivot_longer(ground_truth,
                               cols = 1:(ncol(ground_truth)-1),
                               names_to = "clusters")
  ground_truth$data_set <- subset.datasets_csv[ind,1]
  ground_truth$set_number <- ind
  ground_truth_tot <- rbind(ground_truth_tot, ground_truth)

}
ground_truth_tot <- ground_truth_tot[2:nrow(ground_truth_tot),]

head(ground_truth_tot)
# A tibble: 6 × 5
genes clusters value data_set set_number
<chr> <chr> <lgl> <chr> <int>
1 Neil2 E13.5-434 FALSE 2_Clusters_uneven_near 1
2 Neil2 E15.0-428 FALSE 2_Clusters_uneven_near 1
3 Lamc1 E13.5-434 FALSE 2_Clusters_uneven_near 1
4 Lamc1 E15.0-428 FALSE 2_Clusters_uneven_near 1
5 Lama1 E13.5-434 FALSE 2_Clusters_uneven_near 1
6 Lama1 E15.0-428 FALSE 2_Clusters_uneven_near 1length(unique(ground_truth_tot$genes)) [1] 14695sum(ground_truth_tot$value)[1] 8ROC for COTAN
onlyPositive.pVal.Cotan_tot <- NA

for (ind in 1:dim(subset.datasets_csv)[1]) {
  #print(ind)
  file.code <- paste0(subset.datasets_csv$Group[ind],"_",
                      subset.datasets_csv$Collection[ind])
  dataset <- readRDS(file = file.path(dataSetDir,paste0(file.code,".RDS")))
  deaCOTAN <- getClusterizationData(dataset,clName = "mergedClusters")[[2]]
  pvalCOTAN <- pValueFromDEA(deaCOTAN,
              numCells = getNumCells(dataset),adjustmentMethod = "none")

  clusterization <- getClusterizationData(dataset, clName = "mergedClusters")[[1]]
  cl.names <- NA

  for (cl.val in  unique(clusterization)) {
    #print(cl.val)
    cl.names <- c(cl.names,
                  str_split(names(clusterization[clusterization == cl.val])[1],
                            pattern = "_",simplify = T)[1])
    cl.names <- cl.names[!is.na(cl.names)]
  }
  colnames(deaCOTAN) <- cl.names
  colnames(pvalCOTAN) <- cl.names

  clusters <- str_split(datasets_csv$Collection[ind],pattern = "_[+]_",simplify = T)

  onlyPositive.pVal.Cotan <- pvalCOTAN

    for (cl in cl.names) {
    print(cl)
    #temp.DEA.CotanSign <- deaCOTAN[rownames(pvalCOTAN[pvalCOTAN[,cl] < 0.05,]) ,]
    onlyPositive.pVal.Cotan[rownames(deaCOTAN[deaCOTAN[,cl] < 0,]),cl] <-  1 #onlyPositive.pVal.Cotan[rownames(deaCOTAN[deaCOTAN[,cl] < 0,]),cl]+1
    }

    onlyPositive.pVal.Cotan$genes <- rownames(onlyPositive.pVal.Cotan)
    onlyPositive.pVal.Cotan <- pivot_longer(onlyPositive.pVal.Cotan,
                                            values_to = "p_values",
                               cols = 1:(ncol(onlyPositive.pVal.Cotan)-1),
                               names_to = "clusters")
  onlyPositive.pVal.Cotan$data_set <- subset.datasets_csv[ind,1]
  onlyPositive.pVal.Cotan$set_number <- ind
  onlyPositive.pVal.Cotan_tot <- rbind(onlyPositive.pVal.Cotan_tot, onlyPositive.pVal.Cotan)

  }
[1] "E13.5-434"
[1] "E15.0-428"
[1] "E15.0-432"
[1] "E13.5-432"
[1] "E15.0-509"
[1] "E15.0-508"onlyPositive.pVal.Cotan_tot <- onlyPositive.pVal.Cotan_tot[2:nrow(onlyPositive.pVal.Cotan_tot),]
onlyPositive.pVal.Cotan_tot <- merge.data.frame(onlyPositive.pVal.Cotan_tot,
ground_truth_tot,by = c("genes","clusters","data_set","set_number"),all.x = T,all.y = F)
#onlyPositive.pVal.Cotan_tot <- onlyPositive.pVal.Cotan_tot[order(onlyPositive.pVal.Cotan_tot$p_values,
# decreasing = F),]
# df <- as.data.frame(matrix(nrow = nrow(onlyPositive.pVal.Cotan_tot),ncol = 3))
# colnames(df) <- c("TPR","FPR","Method")
# df$Method <- "COTAN"
#
# Positive <- sum(onlyPositive.pVal.Cotan_tot$value)
# Negative <- sum(!onlyPositive.pVal.Cotan_tot$value)
#
# for (i in 1:nrow(onlyPositive.pVal.Cotan_tot)) {
# df[i,"TPR"] <- sum(onlyPositive.pVal.Cotan_tot[1:i,"value"])/Positive
# df[i,"FPR"] <- (i-sum(onlyPositive.pVal.Cotan_tot[1:i,"value"]))/Negative
# Convert TRUE/FALSE to 1/0
onlyPositive.pVal.Cotan_tot$value <- as.numeric(onlyPositive.pVal.Cotan_tot$value)
# Compute the ROC curve - note that we invert the p-values with 1 - p_values
roc_resultCOTAN <- roc(onlyPositive.pVal.Cotan_tot$value, 1 - onlyPositive.pVal.Cotan_tot$p_values)
# Plot the ROC curve
#plot(roc_resultCOTAN)ROC for Seurat
deaSeurat_tot <- NA

for (ind in 1:dim(subset.datasets_csv)[1]) {
  #print(ind)
  file.code <- paste0(subset.datasets_csv$Group[ind],"_",subset.datasets_csv$Collection[ind])

  dataset <- readRDS(file = file.path(dataSetDir,paste0(file.code,".RDS")))

  clusterization <- getClusterizationData(dataset, clName = "mergedClusters")[[1]]

  deaSeurat <- read.csv(file.path(dirOut,paste0(file.code,"Seurat_DEA_genes.csv")), row.names = 1)

  cl.names <- NA

  for (cl.val in  unique(clusterization)) {
    #print(cl.val)
    cl.name <- str_split(names(clusterization[clusterization == cl.val])[1],
                            pattern = "_",simplify = T)[1]
    cl.names <- c(cl.names,cl.name)
    cl.names <- cl.names[!is.na(cl.names)]

    deaSeurat[deaSeurat$cluster == cl.val,]$cluster <- cl.name

  }

  clusters <- str_split(datasets_csv$Collection[ind],pattern = "_[+]_",simplify = T)

  colnames(deaSeurat) <- str_replace(colnames(deaSeurat),
                                     pattern = "cluster",
                                     replacement = "clusters")
  colnames(deaSeurat) <- str_replace(colnames(deaSeurat),
                                     pattern = "gene",
                                     replacement = "genes")

  deaSeurat$data_set <- subset.datasets_csv[ind,1]
  deaSeurat$set_number <- ind
  deaSeurat_tot <- rbind(deaSeurat_tot, deaSeurat)


  }
 deaSeurat_tot <-  deaSeurat_tot[2:nrow(deaSeurat_tot),]

 deaSeurat_tot <- merge.data.frame(deaSeurat_tot,
                                   ground_truth_tot,
                                   by = c("genes","clusters","data_set","set_number"),
                                   all.x = T,all.y = F)

# Convert TRUE/FALSE to 1/0
deaSeurat_tot$value <- as.numeric(deaSeurat_tot$value)

# Compute the ROC curve - note that we invert the p-values with 1 - p_values
roc_resultSeurat <- roc(deaSeurat_tot$value, 1 - deaSeurat_tot$p_val)

# Plot the ROC curve
plot(roc_resultSeurat)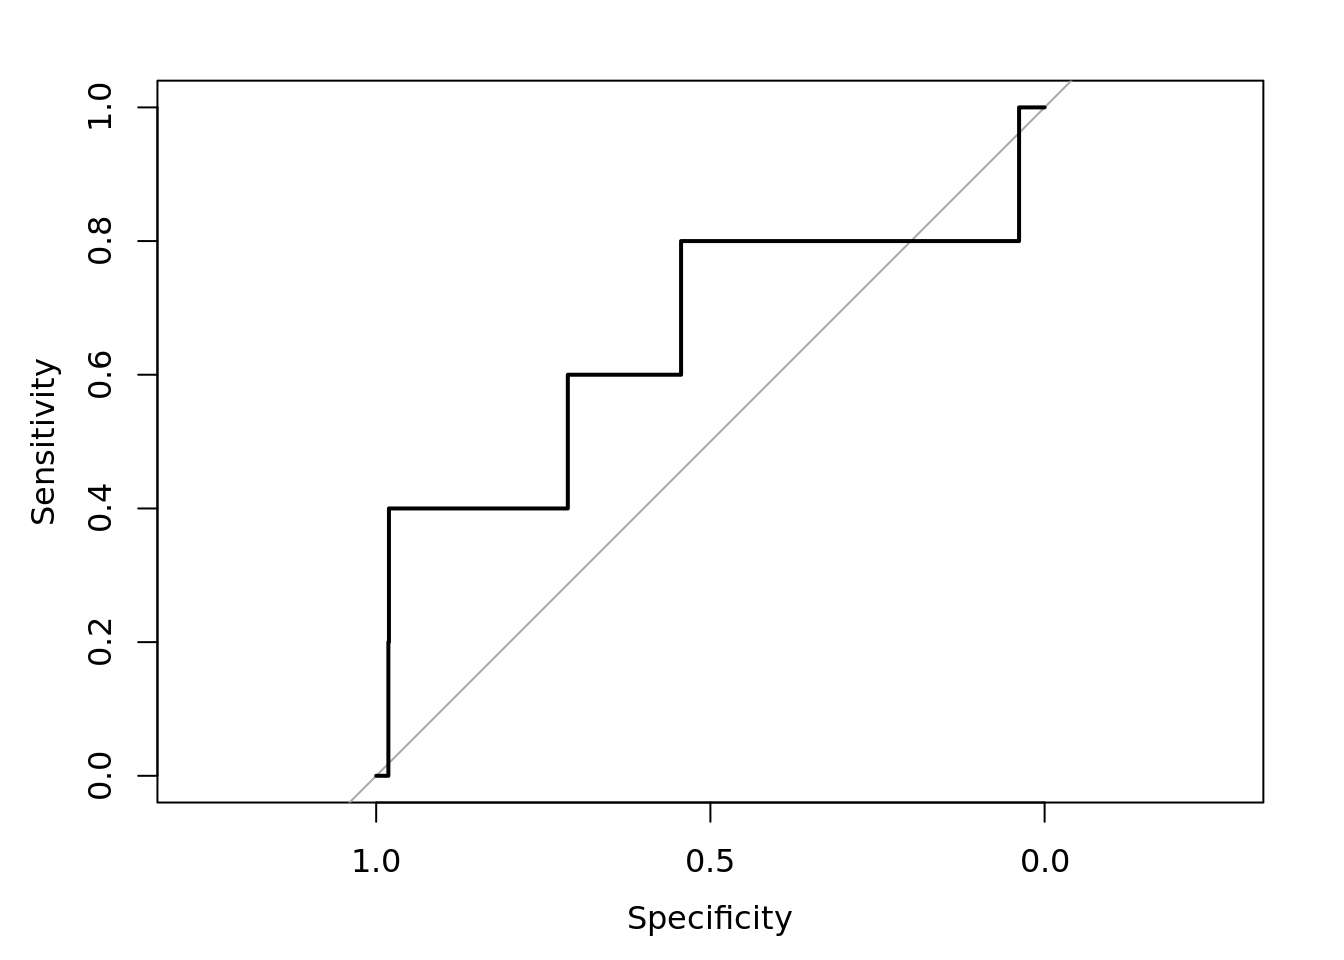
ROC for Seurat scTransform
deaSeurat_tot <- NA

for (ind in 1:dim(subset.datasets_csv)[1]) {
  #print(ind)
  file.code <- paste0(subset.datasets_csv$Group[ind],"_",subset.datasets_csv$Collection[ind])

  dataset <- readRDS(file = file.path(dataSetDir,paste0(file.code,".RDS")))

  clusterization <- getClusterizationData(dataset, clName = "mergedClusters")[[1]]

  deaSeurat <- read.csv(file.path(dirOut,paste0(file.code,"Seurat_DEA_ScTransform_genes.csv")), row.names = 1)

  cl.names <- NA

  for (cl.val in  unique(clusterization)) {
    #print(cl.val)
    cl.name <- str_split(names(clusterization[clusterization == cl.val])[1],
                            pattern = "_",simplify = T)[1]
    cl.names <- c(cl.names,cl.name)
    cl.names <- cl.names[!is.na(cl.names)]

    deaSeurat[deaSeurat$cluster == cl.val,]$cluster <- cl.name

  }

  clusters <- str_split(datasets_csv$Collection[ind],pattern = "_[+]_",simplify = T)

  colnames(deaSeurat) <- str_replace(colnames(deaSeurat),
                                     pattern = "cluster",
                                     replacement = "clusters")
  colnames(deaSeurat) <- str_replace(colnames(deaSeurat),
                                     pattern = "gene",
                                     replacement = "genes")

  deaSeurat$data_set <- subset.datasets_csv[ind,1]
  deaSeurat$set_number <- ind
  deaSeurat_tot <- rbind(deaSeurat_tot, deaSeurat)


  }
 deaSeurat_tot <-  deaSeurat_tot[2:nrow(deaSeurat_tot),]

 deaSeurat_tot <- merge.data.frame(deaSeurat_tot,
                                   ground_truth_tot,
                                   by = c("genes","clusters","data_set","set_number"),
                                   all.x = T,all.y = F)

# Convert TRUE/FALSE to 1/0
deaSeurat_tot$value <- as.numeric(deaSeurat_tot$value)

# Compute the ROC curve - note that we invert the p-values with 1 - p_values
roc_resultSeurat_scTr <- roc(deaSeurat_tot$value, 1 - deaSeurat_tot$p_val)
ROC for Seurat Bimod
deaSeurat_tot <- NA

for (ind in 1:dim(subset.datasets_csv)[1]) {
  #print(ind)
  file.code <- paste0(subset.datasets_csv$Group[ind],"_",subset.datasets_csv$Collection[ind])

  dataset <- readRDS(file = file.path(dataSetDir,paste0(file.code,".RDS")))

  clusterization <- getClusterizationData(dataset, clName = "mergedClusters")[[1]]

  deaSeurat <- read.csv(file.path(dirOut,paste0(file.code,"Seurat_DEA_Bimod_genes.csv")), row.names = 1)

  cl.names <- NA

  for (cl.val in  unique(clusterization)) {
    #print(cl.val)
    cl.name <- str_split(names(clusterization[clusterization == cl.val])[1],
                            pattern = "_",simplify = T)[1]
    cl.names <- c(cl.names,cl.name)
    cl.names <- cl.names[!is.na(cl.names)]

    deaSeurat[deaSeurat$cluster == cl.val,]$cluster <- cl.name

  }

  clusters <- str_split(datasets_csv$Collection[ind],pattern = "_[+]_",simplify = T)

  colnames(deaSeurat) <- str_replace(colnames(deaSeurat),
                                     pattern = "cluster",
                                     replacement = "clusters")
  colnames(deaSeurat) <- str_replace(colnames(deaSeurat),
                                     pattern = "gene",
                                     replacement = "genes")

  deaSeurat$data_set <- subset.datasets_csv[ind,1]
  deaSeurat$set_number <- ind
  deaSeurat_tot <- rbind(deaSeurat_tot, deaSeurat)


  }
 deaSeurat_tot <-  deaSeurat_tot[2:nrow(deaSeurat_tot),]

 deaSeurat_tot <- merge.data.frame(deaSeurat_tot,
                                   ground_truth_tot,
                                   by = c("genes","clusters","data_set","set_number"),
                                   all.x = T,all.y = F)

# Convert TRUE/FALSE to 1/0
deaSeurat_tot$value <- as.numeric(deaSeurat_tot$value)

# Compute the ROC curve - note that we invert the p-values with 1 - p_values
roc_resultSeurat_Bimod <- roc(deaSeurat_tot$value, 1 - deaSeurat_tot$p_val)
ROC for Monocle
deaMonocle_tot <- NA
for (ind in 1:dim(subset.datasets_csv)[1]) {
  file.code <- paste0(subset.datasets_csv$Group[ind],"_",subset.datasets_csv$Collection[ind])
  dataset <- readRDS(file = file.path(dataSetDir,paste0(file.code,".RDS")))

  clusterization <- getClusterizationData(dataset, clName = "mergedClusters")[[1]]
  #print(file.code)

  deaMonocle <- read.csv(file.path(dirOut,paste0(file.code,"Monocle_DEA_genes.csv")),row.names = 1)

  cl.names <- NA

  for (cl.val in  unique(clusterization)) {
    #print(cl.val)
    cl.name <- str_split(names(clusterization[clusterization == cl.val])[1],
                            pattern = "_",simplify = T)[1]
    cl.names <- c(cl.names,cl.name)
    cl.names <- cl.names[!is.na(cl.names)]

    deaMonocle[deaMonocle$cell_group == cl.val,"cell_group"] <- cl.name

  }

  clusters <- str_split(datasets_csv$Collection[ind],pattern = "_[+]_",simplify = T)

  colnames(deaMonocle) <- str_replace(colnames(deaMonocle),
                                     pattern = "cell_group",
                                     replacement = "clusters")
  colnames(deaMonocle) <- str_replace(colnames(deaMonocle),
                                     pattern = "gene_id",
                                     replacement = "genes")

  deaMonocle$data_set <- subset.datasets_csv[ind,1]
  deaMonocle$set_number <- ind
  deaMonocle <- as.data.frame(deaMonocle)
  deaMonocle_tot <- rbind(deaMonocle_tot, deaMonocle)


  }
 deaMonocle_tot <-  deaMonocle_tot[2:nrow(deaMonocle_tot),]

 deaMonocle_tot <- merge.data.frame(deaMonocle_tot,
                                   ground_truth_tot,
                                   by = c("genes","clusters","data_set","set_number"),
                                   all.x = T,all.y = F)

# Convert TRUE/FALSE to 1/0
deaMonocle_tot$value <- as.numeric(deaMonocle_tot$value)

# Compute the ROC curve - note that we invert the p-values with 1 - p_values
roc_resultMonocle <- roc(deaMonocle_tot$value, 1 - deaMonocle_tot$marker_test_p_value)

# Plot the ROC curve
#plot(roc_resultMonocle)
ROC from ScamPy
deaScamPy_tot <- NA
for (ind in 1:dim(subset.datasets_csv)[1]) {
  file.code <- paste0(subset.datasets_csv$Group[ind],"_",subset.datasets_csv$Collection[ind])
  dataset <- readRDS(file = file.path(dataSetDir,paste0(file.code,".RDS")))

  clusterization <- getClusterizationData(dataset, clName = "mergedClusters")[[1]]
  #print(file.code)

  deaScamPy <- read.csv(file.path(dirOut,paste0(file.code,"ScanPy_DEA_genes.csv")),
                        row.names = 1)

  cl.names <- NA

  for (cl.val in  unique(clusterization)) {
    #print(cl.val)
    cl.name <- str_split(names(clusterization[clusterization == cl.val])[1],
                            pattern = "_",simplify = T)[1]
    cl.names <- c(cl.names,cl.name)
    cl.names <- cl.names[!is.na(cl.names)]

    deaScamPy[deaScamPy$clusters == paste0("cl",cl.val),"clusters"] <- cl.name

  }

  clusters <- str_split(datasets_csv$Collection[ind],pattern = "_[+]_",simplify = T)


  deaScamPy$data_set <- subset.datasets_csv[ind,1]
  deaScamPy$set_number <- ind
  deaScamPy_tot <- rbind(deaScamPy_tot, deaScamPy)


  }
 deaScamPy_tot <-  deaScamPy_tot[2:nrow(deaScamPy_tot),]

 deaScamPy_tot <- merge.data.frame(deaScamPy_tot,
                                   ground_truth_tot,
                                   by = c("genes","clusters","data_set","set_number"),
                                   all.x = T,all.y = F)

# Convert TRUE/FALSE to 1/0
deaScamPy_tot$value <- as.numeric(deaScamPy_tot$value)

# Compute the ROC curve - note that we invert the p-values with 1 - p_values
roc_resultScamPy <- roc(deaScamPy_tot$value, 1 - deaScamPy_tot$pval)

# Plot the ROC curve
#plot(roc_resultScamPy)
Summary ROC for all methods
Two_Clusters_uneven_near <- ggroc(list(COTAN=roc_resultCOTAN, Seurat=roc_resultSeurat,                  Seurat_scTr = roc_resultSeurat_scTr, Seurat_Bimod = roc_resultSeurat_Bimod,
                 Monocle=roc_resultMonocle, ScamPy=roc_resultScamPy))

Two_Clusters_uneven_nearPL <- Two_Clusters_uneven_near + xlab("FPR") + ylab("TPR")
Two_Clusters_uneven_nearPL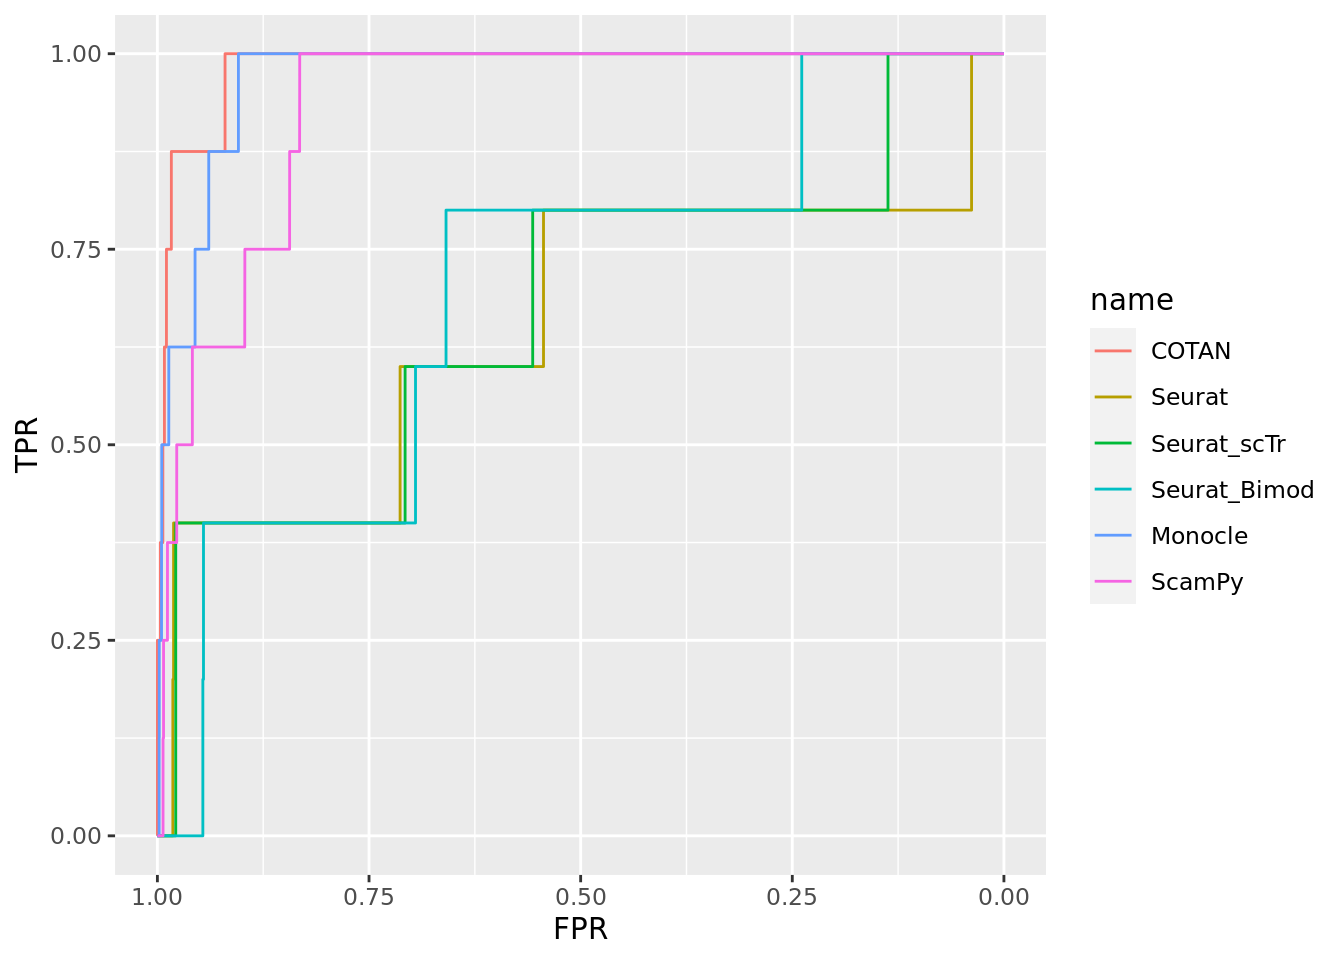
2_Clusters_uneven_medium
True vector
subset.datasets_csv <-datasets_csv[datasets_csv$Group == "2_Clusters_uneven_medium",]

ground_truth_tot <- NA

for (ind in 1:dim(subset.datasets_csv)[1]) {
  clusters <- str_split(subset.datasets_csv$Collection[ind],pattern = "_[+]_",simplify = T)

  file.presence.subset <- file.presence[,clusters]


  #file.presence.subset <- as.matrix(file.presence.subset)


  ground_truth <- as.data.frame(matrix(nrow = nrow(file.presence.subset),
                                       ncol = ncol(file.presence.subset)))
  rownames(ground_truth) <- rownames(file.presence.subset)
  colnames(ground_truth) <- colnames(file.presence.subset)

  ground_truth[file.presence.subset == "Absent"] <- 0
  ground_truth[file.presence.subset == "Present"] <- 1
  ground_truth[file.presence.subset == "Uncertain"] <- 0.6

  file.presence.subset <- ground_truth

  for (col in 1:ncol(ground_truth)) {
    ground_truth[,col] <- FALSE
    ground_truth[file.presence.subset[,col] == 1 & rowMeans(file.presence.subset[,-col,drop = FALSE]) < 0.555  ,col] <- TRUE
    }

  ground_truth$genes <- rownames(ground_truth)
  ground_truth <- pivot_longer(ground_truth,
                               cols = 1:(ncol(ground_truth)-1),
                               names_to = "clusters")
  ground_truth$data_set <- subset.datasets_csv[ind,1]
  ground_truth$set_number <- ind
  ground_truth_tot <- rbind(ground_truth_tot, ground_truth)

}
ground_truth_tot <- ground_truth_tot[2:nrow(ground_truth_tot),]

head(ground_truth_tot)
# A tibble: 6 × 5
genes clusters value data_set set_number
<chr> <chr> <lgl> <chr> <int>
1 Neil2 E13.5-187 FALSE 2_Clusters_uneven_medium 1
2 Neil2 E13.5-184 FALSE 2_Clusters_uneven_medium 1
3 Lamc1 E13.5-187 FALSE 2_Clusters_uneven_medium 1
4 Lamc1 E13.5-184 FALSE 2_Clusters_uneven_medium 1
5 Lama1 E13.5-187 FALSE 2_Clusters_uneven_medium 1
6 Lama1 E13.5-184 FALSE 2_Clusters_uneven_medium 1length(unique(ground_truth_tot$genes)) [1] 14695sum(ground_truth_tot$value)[1] 447ROC for COTAN
onlyPositive.pVal.Cotan_tot <- NA

for (ind in 1:dim(subset.datasets_csv)[1]) {
  #print(ind)
  file.code <- paste0(subset.datasets_csv$Group[ind],"_",
                      subset.datasets_csv$Collection[ind])
  dataset <- readRDS(file = file.path(dataSetDir,paste0(file.code,".RDS")))
  deaCOTAN <- getClusterizationData(dataset,clName = "mergedClusters")[[2]]
  pvalCOTAN <- pValueFromDEA(deaCOTAN,
              numCells = getNumCells(dataset),adjustmentMethod = "none")

  clusterization <- getClusterizationData(dataset, clName = "mergedClusters")[[1]]
  cl.names <- NA

  for (cl.val in  unique(clusterization)) {
    #print(cl.val)
    cl.names <- c(cl.names,
                  str_split(names(clusterization[clusterization == cl.val])[1],
                            pattern = "_",simplify = T)[1])
    cl.names <- cl.names[!is.na(cl.names)]
  }
  colnames(deaCOTAN) <- cl.names
  colnames(pvalCOTAN) <- cl.names

  clusters <- str_split(datasets_csv$Collection[ind],pattern = "_[+]_",simplify = T)

  onlyPositive.pVal.Cotan <- pvalCOTAN

    for (cl in cl.names) {
    print(cl)
    #temp.DEA.CotanSign <- deaCOTAN[rownames(pvalCOTAN[pvalCOTAN[,cl] < 0.05,]) ,]
    onlyPositive.pVal.Cotan[rownames(deaCOTAN[deaCOTAN[,cl] < 0,]),cl] <-  1 #onlyPositive.pVal.Cotan[rownames(deaCOTAN[deaCOTAN[,cl] < 0,]),cl]+1
    }

    onlyPositive.pVal.Cotan$genes <- rownames(onlyPositive.pVal.Cotan)
    onlyPositive.pVal.Cotan <- pivot_longer(onlyPositive.pVal.Cotan,
                                            values_to = "p_values",
                               cols = 1:(ncol(onlyPositive.pVal.Cotan)-1),
                               names_to = "clusters")
  onlyPositive.pVal.Cotan$data_set <- subset.datasets_csv[ind,1]
  onlyPositive.pVal.Cotan$set_number <- ind
  onlyPositive.pVal.Cotan_tot <- rbind(onlyPositive.pVal.Cotan_tot, onlyPositive.pVal.Cotan)

  }
[1] "E13.5-187"
[1] "E13.5-184"
[1] "E17.5-516"
[1] "E15.0-434"
[1] "E15.0-508"
[1] "E15.0-437"onlyPositive.pVal.Cotan_tot <- onlyPositive.pVal.Cotan_tot[2:nrow(onlyPositive.pVal.Cotan_tot),]
onlyPositive.pVal.Cotan_tot <- merge.data.frame(onlyPositive.pVal.Cotan_tot,
ground_truth_tot,by = c("genes","clusters","data_set","set_number"),all.x = T,all.y = F)
#onlyPositive.pVal.Cotan_tot <- onlyPositive.pVal.Cotan_tot[order(onlyPositive.pVal.Cotan_tot$p_values,
# decreasing = F),]
# df <- as.data.frame(matrix(nrow = nrow(onlyPositive.pVal.Cotan_tot),ncol = 3))
# colnames(df) <- c("TPR","FPR","Method")
# df$Method <- "COTAN"
#
# Positive <- sum(onlyPositive.pVal.Cotan_tot$value)
# Negative <- sum(!onlyPositive.pVal.Cotan_tot$value)
#
# for (i in 1:nrow(onlyPositive.pVal.Cotan_tot)) {
# df[i,"TPR"] <- sum(onlyPositive.pVal.Cotan_tot[1:i,"value"])/Positive
# df[i,"FPR"] <- (i-sum(onlyPositive.pVal.Cotan_tot[1:i,"value"]))/Negative
# Convert TRUE/FALSE to 1/0
onlyPositive.pVal.Cotan_tot$value <- as.numeric(onlyPositive.pVal.Cotan_tot$value)
# Compute the ROC curve - note that we invert the p-values with 1 - p_values
roc_resultCOTAN <- roc(onlyPositive.pVal.Cotan_tot$value, 1 - onlyPositive.pVal.Cotan_tot$p_values)
# Plot the ROC curve
#plot(roc_resultCOTAN)ROC for Seurat
deaSeurat_tot <- NA

for (ind in 1:dim(subset.datasets_csv)[1]) {
  #print(ind)
  file.code <- paste0(subset.datasets_csv$Group[ind],"_",subset.datasets_csv$Collection[ind])

  dataset <- readRDS(file = file.path(dataSetDir,paste0(file.code,".RDS")))

  clusterization <- getClusterizationData(dataset, clName = "mergedClusters")[[1]]

  deaSeurat <- read.csv(file.path(dirOut,paste0(file.code,"Seurat_DEA_genes.csv")), row.names = 1)

  cl.names <- NA

  for (cl.val in  unique(clusterization)) {
    #print(cl.val)
    cl.name <- str_split(names(clusterization[clusterization == cl.val])[1],
                            pattern = "_",simplify = T)[1]
    cl.names <- c(cl.names,cl.name)
    cl.names <- cl.names[!is.na(cl.names)]

    deaSeurat[deaSeurat$cluster == cl.val,]$cluster <- cl.name

  }

  clusters <- str_split(datasets_csv$Collection[ind],pattern = "_[+]_",simplify = T)

  colnames(deaSeurat) <- str_replace(colnames(deaSeurat),
                                     pattern = "cluster",
                                     replacement = "clusters")
  colnames(deaSeurat) <- str_replace(colnames(deaSeurat),
                                     pattern = "gene",
                                     replacement = "genes")

  deaSeurat$data_set <- subset.datasets_csv[ind,1]
  deaSeurat$set_number <- ind
  deaSeurat_tot <- rbind(deaSeurat_tot, deaSeurat)


  }
 deaSeurat_tot <-  deaSeurat_tot[2:nrow(deaSeurat_tot),]

 deaSeurat_tot <- merge.data.frame(deaSeurat_tot,
                                   ground_truth_tot,
                                   by = c("genes","clusters","data_set","set_number"),
                                   all.x = T,all.y = F)

# Convert TRUE/FALSE to 1/0
deaSeurat_tot$value <- as.numeric(deaSeurat_tot$value)

# Compute the ROC curve - note that we invert the p-values with 1 - p_values
roc_resultSeurat <- roc(deaSeurat_tot$value, 1 - deaSeurat_tot$p_val)

# Plot the ROC curve
#plot(roc_resultSeurat)
ROC for Seurat scTransform
deaSeurat_tot <- NA

for (ind in 1:dim(subset.datasets_csv)[1]) {
  #print(ind)
  file.code <- paste0(subset.datasets_csv$Group[ind],"_",subset.datasets_csv$Collection[ind])

  dataset <- readRDS(file = file.path(dataSetDir,paste0(file.code,".RDS")))

  clusterization <- getClusterizationData(dataset, clName = "mergedClusters")[[1]]

  deaSeurat <- read.csv(file.path(dirOut,paste0(file.code,"Seurat_DEA_ScTransform_genes.csv")), row.names = 1)

  cl.names <- NA

  for (cl.val in  unique(clusterization)) {
    #print(cl.val)
    cl.name <- str_split(names(clusterization[clusterization == cl.val])[1],
                            pattern = "_",simplify = T)[1]
    cl.names <- c(cl.names,cl.name)
    cl.names <- cl.names[!is.na(cl.names)]

    deaSeurat[deaSeurat$cluster == cl.val,]$cluster <- cl.name

  }

  clusters <- str_split(datasets_csv$Collection[ind],pattern = "_[+]_",simplify = T)

  colnames(deaSeurat) <- str_replace(colnames(deaSeurat),
                                     pattern = "cluster",
                                     replacement = "clusters")
  colnames(deaSeurat) <- str_replace(colnames(deaSeurat),
                                     pattern = "gene",
                                     replacement = "genes")

  deaSeurat$data_set <- subset.datasets_csv[ind,1]
  deaSeurat$set_number <- ind
  deaSeurat_tot <- rbind(deaSeurat_tot, deaSeurat)


  }
 deaSeurat_tot <-  deaSeurat_tot[2:nrow(deaSeurat_tot),]

 deaSeurat_tot <- merge.data.frame(deaSeurat_tot,
                                   ground_truth_tot,
                                   by = c("genes","clusters","data_set","set_number"),
                                   all.x = T,all.y = F)

# Convert TRUE/FALSE to 1/0
deaSeurat_tot$value <- as.numeric(deaSeurat_tot$value)

# Compute the ROC curve - note that we invert the p-values with 1 - p_values
roc_resultSeurat_scTr <- roc(deaSeurat_tot$value, 1 - deaSeurat_tot$p_val)
ROC for Seurat Bimod
deaSeurat_tot <- NA

for (ind in 1:dim(subset.datasets_csv)[1]) {
  #print(ind)
  file.code <- paste0(subset.datasets_csv$Group[ind],"_",subset.datasets_csv$Collection[ind])

  dataset <- readRDS(file = file.path(dataSetDir,paste0(file.code,".RDS")))

  clusterization <- getClusterizationData(dataset, clName = "mergedClusters")[[1]]

  deaSeurat <- read.csv(file.path(dirOut,paste0(file.code,"Seurat_DEA_Bimod_genes.csv")), row.names = 1)

  cl.names <- NA

  for (cl.val in  unique(clusterization)) {
    #print(cl.val)
    cl.name <- str_split(names(clusterization[clusterization == cl.val])[1],
                            pattern = "_",simplify = T)[1]
    cl.names <- c(cl.names,cl.name)
    cl.names <- cl.names[!is.na(cl.names)]

    deaSeurat[deaSeurat$cluster == cl.val,]$cluster <- cl.name

  }

  clusters <- str_split(datasets_csv$Collection[ind],pattern = "_[+]_",simplify = T)

  colnames(deaSeurat) <- str_replace(colnames(deaSeurat),
                                     pattern = "cluster",
                                     replacement = "clusters")
  colnames(deaSeurat) <- str_replace(colnames(deaSeurat),
                                     pattern = "gene",
                                     replacement = "genes")

  deaSeurat$data_set <- subset.datasets_csv[ind,1]
  deaSeurat$set_number <- ind
  deaSeurat_tot <- rbind(deaSeurat_tot, deaSeurat)


  }
 deaSeurat_tot <-  deaSeurat_tot[2:nrow(deaSeurat_tot),]

 deaSeurat_tot <- merge.data.frame(deaSeurat_tot,
                                   ground_truth_tot,
                                   by = c("genes","clusters","data_set","set_number"),
                                   all.x = T,all.y = F)

# Convert TRUE/FALSE to 1/0
deaSeurat_tot$value <- as.numeric(deaSeurat_tot$value)

# Compute the ROC curve - note that we invert the p-values with 1 - p_values
roc_resultSeurat_Bimod <- roc(deaSeurat_tot$value, 1 - deaSeurat_tot$p_val)
ROC for Monocle
deaMonocle_tot <- NA
for (ind in 1:dim(subset.datasets_csv)[1]) {
  file.code <- paste0(subset.datasets_csv$Group[ind],"_",subset.datasets_csv$Collection[ind])
  dataset <- readRDS(file = file.path(dataSetDir,paste0(file.code,".RDS")))

  clusterization <- getClusterizationData(dataset, clName = "mergedClusters")[[1]]
  #print(file.code)

  deaMonocle <- read.csv(file.path(dirOut,paste0(file.code,"Monocle_DEA_genes.csv")),row.names = 1)

  cl.names <- NA

  for (cl.val in  unique(clusterization)) {
    #print(cl.val)
    cl.name <- str_split(names(clusterization[clusterization == cl.val])[1],
                            pattern = "_",simplify = T)[1]
    cl.names <- c(cl.names,cl.name)
    cl.names <- cl.names[!is.na(cl.names)]

    deaMonocle[deaMonocle$cell_group == cl.val,"cell_group"] <- cl.name

  }

  clusters <- str_split(datasets_csv$Collection[ind],pattern = "_[+]_",simplify = T)

  colnames(deaMonocle) <- str_replace(colnames(deaMonocle),
                                     pattern = "cell_group",
                                     replacement = "clusters")
  colnames(deaMonocle) <- str_replace(colnames(deaMonocle),
                                     pattern = "gene_id",
                                     replacement = "genes")

  deaMonocle$data_set <- subset.datasets_csv[ind,1]
  deaMonocle$set_number <- ind
  deaMonocle <- as.data.frame(deaMonocle)
  deaMonocle_tot <- rbind(deaMonocle_tot, deaMonocle)


  }
 deaMonocle_tot <-  deaMonocle_tot[2:nrow(deaMonocle_tot),]

 deaMonocle_tot <- merge.data.frame(deaMonocle_tot,
                                   ground_truth_tot,
                                   by = c("genes","clusters","data_set","set_number"),
                                   all.x = T,all.y = F)

# Convert TRUE/FALSE to 1/0
deaMonocle_tot$value <- as.numeric(deaMonocle_tot$value)

# Compute the ROC curve - note that we invert the p-values with 1 - p_values
roc_resultMonocle <- roc(deaMonocle_tot$value, 1 - deaMonocle_tot$marker_test_p_value)

# Plot the ROC curve
#plot(roc_resultMonocle)
ROC from ScamPy
deaScamPy_tot <- NA
for (ind in 1:dim(subset.datasets_csv)[1]) {
  file.code <- paste0(subset.datasets_csv$Group[ind],"_",subset.datasets_csv$Collection[ind])
  dataset <- readRDS(file = file.path(dataSetDir,paste0(file.code,".RDS")))

  clusterization <- getClusterizationData(dataset, clName = "mergedClusters")[[1]]
  #print(file.code)

  deaScamPy <- read.csv(file.path(dirOut,paste0(file.code,"ScanPy_DEA_genes.csv")),
                        row.names = 1)

  cl.names <- NA

  for (cl.val in  unique(clusterization)) {
    #print(cl.val)
    cl.name <- str_split(names(clusterization[clusterization == cl.val])[1],
                            pattern = "_",simplify = T)[1]
    cl.names <- c(cl.names,cl.name)
    cl.names <- cl.names[!is.na(cl.names)]

    deaScamPy[deaScamPy$clusters == paste0("cl",cl.val),"clusters"] <- cl.name

  }

  clusters <- str_split(datasets_csv$Collection[ind],pattern = "_[+]_",simplify = T)


  deaScamPy$data_set <- subset.datasets_csv[ind,1]
  deaScamPy$set_number <- ind
  deaScamPy_tot <- rbind(deaScamPy_tot, deaScamPy)


  }
 deaScamPy_tot <-  deaScamPy_tot[2:nrow(deaScamPy_tot),]

 deaScamPy_tot <- merge.data.frame(deaScamPy_tot,
                                   ground_truth_tot,
                                   by = c("genes","clusters","data_set","set_number"),
                                   all.x = T,all.y = F)

# Convert TRUE/FALSE to 1/0
deaScamPy_tot$value <- as.numeric(deaScamPy_tot$value)

# Compute the ROC curve - note that we invert the p-values with 1 - p_values
roc_resultScamPy <- roc(deaScamPy_tot$value, 1 - deaScamPy_tot$pval)

# Plot the ROC curve
#plot(roc_resultScamPy)
Summary ROC for all methods
Two_Clusters_uneven_medium <- ggroc(list(COTAN=roc_resultCOTAN, Seurat=roc_resultSeurat,                  Seurat_scTr = roc_resultSeurat_scTr, Seurat_Bimod = roc_resultSeurat_Bimod,
                 Monocle=roc_resultMonocle, ScamPy=roc_resultScamPy))

Two_Clusters_uneven_mediumPL <- Two_Clusters_uneven_medium + xlab("FPR") + ylab("TPR")

Two_Clusters_uneven_mediumPL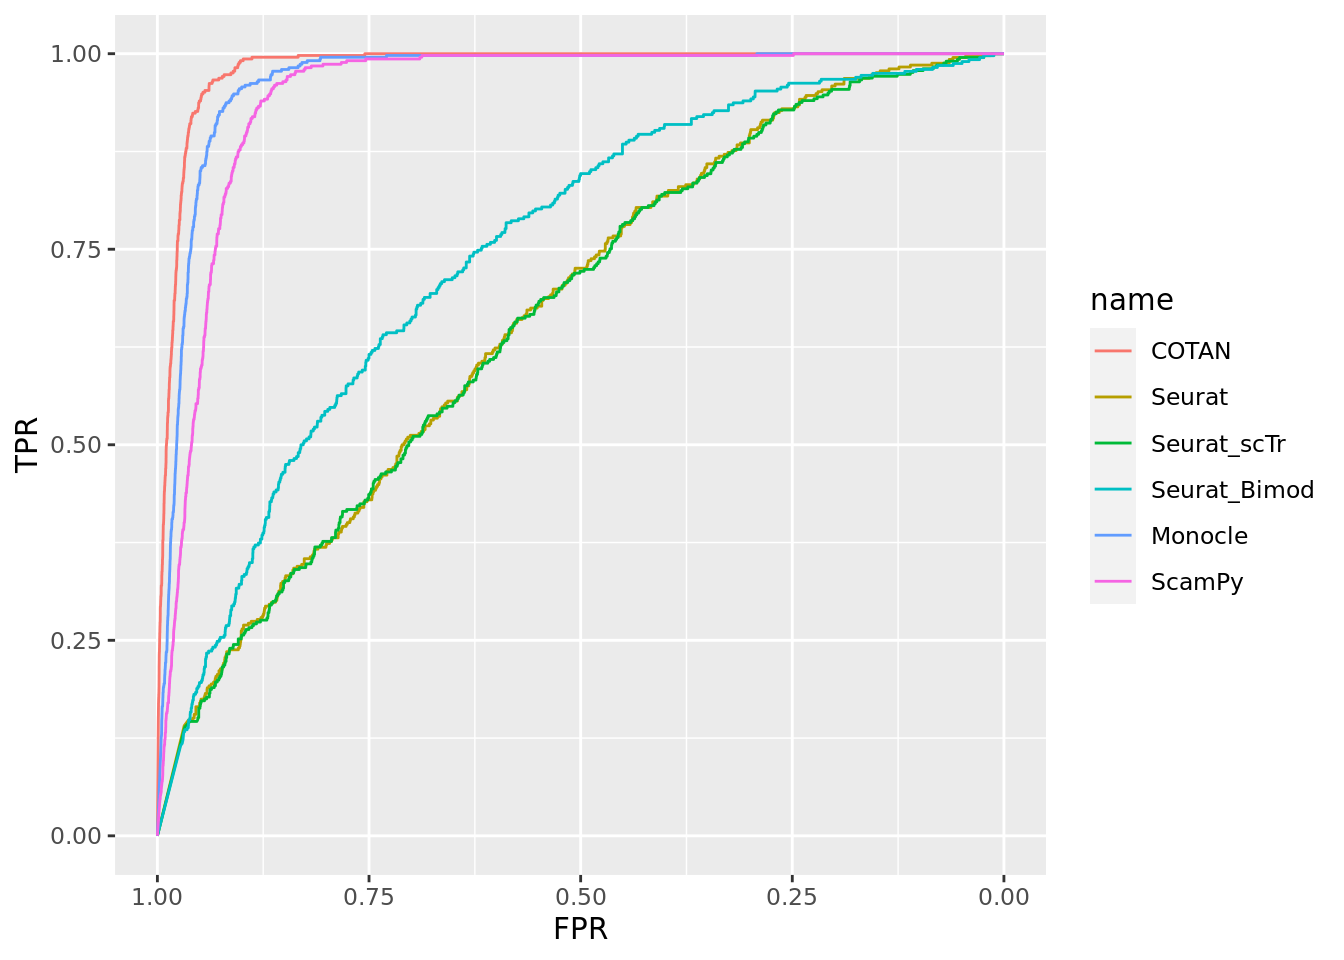
2_Clusters_uneven_far
True vector
subset.datasets_csv <-datasets_csv[datasets_csv$Group == "2_Clusters_uneven_far",]

ground_truth_tot <- NA

for (ind in 1:dim(subset.datasets_csv)[1]) {
  clusters <- str_split(subset.datasets_csv$Collection[ind],pattern = "_[+]_",simplify = T)

  file.presence.subset <- file.presence[,clusters]


  #file.presence.subset <- as.matrix(file.presence.subset)


  ground_truth <- as.data.frame(matrix(nrow = nrow(file.presence.subset),
                                       ncol = ncol(file.presence.subset)))
  rownames(ground_truth) <- rownames(file.presence.subset)
  colnames(ground_truth) <- colnames(file.presence.subset)

  ground_truth[file.presence.subset == "Absent"] <- 0
  ground_truth[file.presence.subset == "Present"] <- 1
  ground_truth[file.presence.subset == "Uncertain"] <- 0.6

  file.presence.subset <- ground_truth

  for (col in 1:ncol(ground_truth)) {
    ground_truth[,col] <- FALSE
    ground_truth[file.presence.subset[,col] == 1 & rowMeans(file.presence.subset[,-col,drop = FALSE]) < 0.555  ,col] <- TRUE
    }

  ground_truth$genes <- rownames(ground_truth)
  ground_truth <- pivot_longer(ground_truth,
                               cols = 1:(ncol(ground_truth)-1),
                               names_to = "clusters")
  ground_truth$data_set <- subset.datasets_csv[ind,1]
  ground_truth$set_number <- ind
  ground_truth_tot <- rbind(ground_truth_tot, ground_truth)

}
ground_truth_tot <- ground_truth_tot[2:nrow(ground_truth_tot),]

head(ground_truth_tot)
# A tibble: 6 × 5
genes clusters value data_set set_number
<chr> <chr> <lgl> <chr> <int>
1 Neil2 E17.5-516 FALSE 2_Clusters_uneven_far 1
2 Neil2 E13.5-187 FALSE 2_Clusters_uneven_far 1
3 Lamc1 E17.5-516 FALSE 2_Clusters_uneven_far 1
4 Lamc1 E13.5-187 FALSE 2_Clusters_uneven_far 1
5 Lama1 E17.5-516 FALSE 2_Clusters_uneven_far 1
6 Lama1 E13.5-187 FALSE 2_Clusters_uneven_far 1length(unique(ground_truth_tot$genes)) [1] 14695sum(ground_truth_tot$value)[1] 1359ROC for COTAN
onlyPositive.pVal.Cotan_tot <- NA

for (ind in 1:dim(subset.datasets_csv)[1]) {
  #print(ind)
  file.code <- paste0(subset.datasets_csv$Group[ind],"_",
                      subset.datasets_csv$Collection[ind])
  dataset <- readRDS(file = file.path(dataSetDir,paste0(file.code,".RDS")))
  deaCOTAN <- getClusterizationData(dataset,clName = "mergedClusters")[[2]]
  pvalCOTAN <- pValueFromDEA(deaCOTAN,
              numCells = getNumCells(dataset),adjustmentMethod = "none")

  clusterization <- getClusterizationData(dataset, clName = "mergedClusters")[[1]]
  cl.names <- NA

  for (cl.val in  unique(clusterization)) {
    #print(cl.val)
    cl.names <- c(cl.names,
                  str_split(names(clusterization[clusterization == cl.val])[1],
                            pattern = "_",simplify = T)[1])
    cl.names <- cl.names[!is.na(cl.names)]
  }
  colnames(deaCOTAN) <- cl.names
  colnames(pvalCOTAN) <- cl.names

  clusters <- str_split(datasets_csv$Collection[ind],pattern = "_[+]_",simplify = T)

  onlyPositive.pVal.Cotan <- pvalCOTAN

    for (cl in cl.names) {
    print(cl)
    #temp.DEA.CotanSign <- deaCOTAN[rownames(pvalCOTAN[pvalCOTAN[,cl] < 0.05,]) ,]
    onlyPositive.pVal.Cotan[rownames(deaCOTAN[deaCOTAN[,cl] < 0,]),cl] <-  1 #onlyPositive.pVal.Cotan[rownames(deaCOTAN[deaCOTAN[,cl] < 0,]),cl]+1
    }

    onlyPositive.pVal.Cotan$genes <- rownames(onlyPositive.pVal.Cotan)
    onlyPositive.pVal.Cotan <- pivot_longer(onlyPositive.pVal.Cotan,
                                            values_to = "p_values",
                               cols = 1:(ncol(onlyPositive.pVal.Cotan)-1),
                               names_to = "clusters")
  onlyPositive.pVal.Cotan$data_set <- subset.datasets_csv[ind,1]
  onlyPositive.pVal.Cotan$set_number <- ind
  onlyPositive.pVal.Cotan_tot <- rbind(onlyPositive.pVal.Cotan_tot, onlyPositive.pVal.Cotan)

  }
[1] "E13.5-187"
[1] "E17.5-516"
[1] "E15.0-510"
[1] "E13.5-437"
[1] "E15.0-509"
[1] "E13.5-184"onlyPositive.pVal.Cotan_tot <- onlyPositive.pVal.Cotan_tot[2:nrow(onlyPositive.pVal.Cotan_tot),]
onlyPositive.pVal.Cotan_tot <- merge.data.frame(onlyPositive.pVal.Cotan_tot,
ground_truth_tot,by = c("genes","clusters","data_set","set_number"),all.x = T,all.y = F)
#onlyPositive.pVal.Cotan_tot <- onlyPositive.pVal.Cotan_tot[order(onlyPositive.pVal.Cotan_tot$p_values,
# decreasing = F),]
# df <- as.data.frame(matrix(nrow = nrow(onlyPositive.pVal.Cotan_tot),ncol = 3))
# colnames(df) <- c("TPR","FPR","Method")
# df$Method <- "COTAN"
#
# Positive <- sum(onlyPositive.pVal.Cotan_tot$value)
# Negative <- sum(!onlyPositive.pVal.Cotan_tot$value)
#
# for (i in 1:nrow(onlyPositive.pVal.Cotan_tot)) {
# df[i,"TPR"] <- sum(onlyPositive.pVal.Cotan_tot[1:i,"value"])/Positive
# df[i,"FPR"] <- (i-sum(onlyPositive.pVal.Cotan_tot[1:i,"value"]))/Negative
# Convert TRUE/FALSE to 1/0
onlyPositive.pVal.Cotan_tot$value <- as.numeric(onlyPositive.pVal.Cotan_tot$value)
# Compute the ROC curve - note that we invert the p-values with 1 - p_values
roc_resultCOTAN <- roc(onlyPositive.pVal.Cotan_tot$value, 1 - onlyPositive.pVal.Cotan_tot$p_values)
# Plot the ROC curve
#plot(roc_resultCOTAN)ROC for Seurat
deaSeurat_tot <- NA

for (ind in 1:dim(subset.datasets_csv)[1]) {
  #print(ind)
  file.code <- paste0(subset.datasets_csv$Group[ind],"_",subset.datasets_csv$Collection[ind])

  dataset <- readRDS(file = file.path(dataSetDir,paste0(file.code,".RDS")))

  clusterization <- getClusterizationData(dataset, clName = "mergedClusters")[[1]]

  deaSeurat <- read.csv(file.path(dirOut,paste0(file.code,"Seurat_DEA_genes.csv")), row.names = 1)

  cl.names <- NA

  for (cl.val in  unique(clusterization)) {
    #print(cl.val)
    cl.name <- str_split(names(clusterization[clusterization == cl.val])[1],
                            pattern = "_",simplify = T)[1]
    cl.names <- c(cl.names,cl.name)
    cl.names <- cl.names[!is.na(cl.names)]

    deaSeurat[deaSeurat$cluster == cl.val,]$cluster <- cl.name

  }

  clusters <- str_split(datasets_csv$Collection[ind],pattern = "_[+]_",simplify = T)

  colnames(deaSeurat) <- str_replace(colnames(deaSeurat),
                                     pattern = "cluster",
                                     replacement = "clusters")
  colnames(deaSeurat) <- str_replace(colnames(deaSeurat),
                                     pattern = "gene",
                                     replacement = "genes")

  deaSeurat$data_set <- subset.datasets_csv[ind,1]
  deaSeurat$set_number <- ind
  deaSeurat_tot <- rbind(deaSeurat_tot, deaSeurat)


  }
 deaSeurat_tot <-  deaSeurat_tot[2:nrow(deaSeurat_tot),]

 deaSeurat_tot <- merge.data.frame(deaSeurat_tot,
                                   ground_truth_tot,
                                   by = c("genes","clusters","data_set","set_number"),
                                   all.x = T,all.y = F)

# Convert TRUE/FALSE to 1/0
deaSeurat_tot$value <- as.numeric(deaSeurat_tot$value)

# Compute the ROC curve - note that we invert the p-values with 1 - p_values
roc_resultSeurat <- roc(deaSeurat_tot$value, 1 - deaSeurat_tot$p_val)

# Plot the ROC curve
#plot(roc_resultSeurat)
ROC for Seurat scTransform
deaSeurat_tot <- NA

for (ind in 1:dim(subset.datasets_csv)[1]) {
  #print(ind)
  file.code <- paste0(subset.datasets_csv$Group[ind],"_",subset.datasets_csv$Collection[ind])

  dataset <- readRDS(file = file.path(dataSetDir,paste0(file.code,".RDS")))

  clusterization <- getClusterizationData(dataset, clName = "mergedClusters")[[1]]

  deaSeurat <- read.csv(file.path(dirOut,paste0(file.code,"Seurat_DEA_ScTransform_genes.csv")), row.names = 1)

  cl.names <- NA

  for (cl.val in  unique(clusterization)) {
    #print(cl.val)
    cl.name <- str_split(names(clusterization[clusterization == cl.val])[1],
                            pattern = "_",simplify = T)[1]
    cl.names <- c(cl.names,cl.name)
    cl.names <- cl.names[!is.na(cl.names)]

    deaSeurat[deaSeurat$cluster == cl.val,]$cluster <- cl.name

  }

  clusters <- str_split(datasets_csv$Collection[ind],pattern = "_[+]_",simplify = T)

  colnames(deaSeurat) <- str_replace(colnames(deaSeurat),
                                     pattern = "cluster",
                                     replacement = "clusters")
  colnames(deaSeurat) <- str_replace(colnames(deaSeurat),
                                     pattern = "gene",
                                     replacement = "genes")

  deaSeurat$data_set <- subset.datasets_csv[ind,1]
  deaSeurat$set_number <- ind
  deaSeurat_tot <- rbind(deaSeurat_tot, deaSeurat)


  }
 deaSeurat_tot <-  deaSeurat_tot[2:nrow(deaSeurat_tot),]

 deaSeurat_tot <- merge.data.frame(deaSeurat_tot,
                                   ground_truth_tot,
                                   by = c("genes","clusters","data_set","set_number"),
                                   all.x = T,all.y = F)

# Convert TRUE/FALSE to 1/0
deaSeurat_tot$value <- as.numeric(deaSeurat_tot$value)

# Compute the ROC curve - note that we invert the p-values with 1 - p_values
roc_resultSeurat_scTr <- roc(deaSeurat_tot$value, 1 - deaSeurat_tot$p_val)
ROC for Seurat Bimod
deaSeurat_tot <- NA

for (ind in 1:dim(subset.datasets_csv)[1]) {
  #print(ind)
  file.code <- paste0(subset.datasets_csv$Group[ind],"_",subset.datasets_csv$Collection[ind])

  dataset <- readRDS(file = file.path(dataSetDir,paste0(file.code,".RDS")))

  clusterization <- getClusterizationData(dataset, clName = "mergedClusters")[[1]]

  deaSeurat <- read.csv(file.path(dirOut,paste0(file.code,"Seurat_DEA_Bimod_genes.csv")), row.names = 1)

  cl.names <- NA

  for (cl.val in  unique(clusterization)) {
    #print(cl.val)
    cl.name <- str_split(names(clusterization[clusterization == cl.val])[1],
                            pattern = "_",simplify = T)[1]
    cl.names <- c(cl.names,cl.name)
    cl.names <- cl.names[!is.na(cl.names)]

    deaSeurat[deaSeurat$cluster == cl.val,]$cluster <- cl.name

  }

  clusters <- str_split(datasets_csv$Collection[ind],pattern = "_[+]_",simplify = T)

  colnames(deaSeurat) <- str_replace(colnames(deaSeurat),
                                     pattern = "cluster",
                                     replacement = "clusters")
  colnames(deaSeurat) <- str_replace(colnames(deaSeurat),
                                     pattern = "gene",
                                     replacement = "genes")

  deaSeurat$data_set <- subset.datasets_csv[ind,1]
  deaSeurat$set_number <- ind
  deaSeurat_tot <- rbind(deaSeurat_tot, deaSeurat)


  }
 deaSeurat_tot <-  deaSeurat_tot[2:nrow(deaSeurat_tot),]

 deaSeurat_tot <- merge.data.frame(deaSeurat_tot,
                                   ground_truth_tot,
                                   by = c("genes","clusters","data_set","set_number"),
                                   all.x = T,all.y = F)

# Convert TRUE/FALSE to 1/0
deaSeurat_tot$value <- as.numeric(deaSeurat_tot$value)

# Compute the ROC curve - note that we invert the p-values with 1 - p_values
roc_resultSeurat_Bimod <- roc(deaSeurat_tot$value, 1 - deaSeurat_tot$p_val)
ROC for Monocle
deaMonocle_tot <- NA
for (ind in 1:dim(subset.datasets_csv)[1]) {
  file.code <- paste0(subset.datasets_csv$Group[ind],"_",subset.datasets_csv$Collection[ind])
  dataset <- readRDS(file = file.path(dataSetDir,paste0(file.code,".RDS")))

  clusterization <- getClusterizationData(dataset, clName = "mergedClusters")[[1]]
  #print(file.code)

  deaMonocle <- read.csv(file.path(dirOut,paste0(file.code,"Monocle_DEA_genes.csv")),row.names = 1)

  cl.names <- NA

  for (cl.val in  unique(clusterization)) {
    #print(cl.val)
    cl.name <- str_split(names(clusterization[clusterization == cl.val])[1],
                            pattern = "_",simplify = T)[1]
    cl.names <- c(cl.names,cl.name)
    cl.names <- cl.names[!is.na(cl.names)]

    deaMonocle[deaMonocle$cell_group == cl.val,"cell_group"] <- cl.name

  }

  clusters <- str_split(datasets_csv$Collection[ind],pattern = "_[+]_",simplify = T)

  colnames(deaMonocle) <- str_replace(colnames(deaMonocle),
                                     pattern = "cell_group",
                                     replacement = "clusters")
  colnames(deaMonocle) <- str_replace(colnames(deaMonocle),
                                     pattern = "gene_id",
                                     replacement = "genes")

  deaMonocle$data_set <- subset.datasets_csv[ind,1]
  deaMonocle$set_number <- ind
  deaMonocle <- as.data.frame(deaMonocle)
  deaMonocle_tot <- rbind(deaMonocle_tot, deaMonocle)


  }
 deaMonocle_tot <-  deaMonocle_tot[2:nrow(deaMonocle_tot),]

 deaMonocle_tot <- merge.data.frame(deaMonocle_tot,
                                   ground_truth_tot,
                                   by = c("genes","clusters","data_set","set_number"),
                                   all.x = T,all.y = F)

# Convert TRUE/FALSE to 1/0
deaMonocle_tot$value <- as.numeric(deaMonocle_tot$value)

# Compute the ROC curve - note that we invert the p-values with 1 - p_values
roc_resultMonocle <- roc(deaMonocle_tot$value, 1 - deaMonocle_tot$marker_test_p_value)

# Plot the ROC curve
#plot(roc_resultMonocle)
ROC from ScamPy
deaScamPy_tot <- NA
for (ind in 1:dim(subset.datasets_csv)[1]) {
  file.code <- paste0(subset.datasets_csv$Group[ind],"_",subset.datasets_csv$Collection[ind])
  dataset <- readRDS(file = file.path(dataSetDir,paste0(file.code,".RDS")))

  clusterization <- getClusterizationData(dataset, clName = "mergedClusters")[[1]]
  #print(file.code)

  deaScamPy <- read.csv(file.path(dirOut,paste0(file.code,"ScanPy_DEA_genes.csv")),
                        row.names = 1)

  cl.names <- NA

  for (cl.val in  unique(clusterization)) {
    #print(cl.val)
    cl.name <- str_split(names(clusterization[clusterization == cl.val])[1],
                            pattern = "_",simplify = T)[1]
    cl.names <- c(cl.names,cl.name)
    cl.names <- cl.names[!is.na(cl.names)]

    deaScamPy[deaScamPy$clusters == paste0("cl",cl.val),"clusters"] <- cl.name

  }

  clusters <- str_split(datasets_csv$Collection[ind],pattern = "_[+]_",simplify = T)


  deaScamPy$data_set <- subset.datasets_csv[ind,1]
  deaScamPy$set_number <- ind
  deaScamPy_tot <- rbind(deaScamPy_tot, deaScamPy)


  }
 deaScamPy_tot <-  deaScamPy_tot[2:nrow(deaScamPy_tot),]

 deaScamPy_tot <- merge.data.frame(deaScamPy_tot,
                                   ground_truth_tot,
                                   by = c("genes","clusters","data_set","set_number"),
                                   all.x = T,all.y = F)

# Convert TRUE/FALSE to 1/0
deaScamPy_tot$value <- as.numeric(deaScamPy_tot$value)

# Compute the ROC curve - note that we invert the p-values with 1 - p_values
roc_resultScamPy <- roc(deaScamPy_tot$value, 1 - deaScamPy_tot$pval)

# Plot the ROC curve
#plot(roc_resultScamPy)
Summary ROC for all methods
Two_Clusters_uneven_far <- ggroc(list(COTAN=roc_resultCOTAN, Seurat=roc_resultSeurat,                  Seurat_scTr = roc_resultSeurat_scTr, Seurat_Bimod = roc_resultSeurat_Bimod,
                 Monocle=roc_resultMonocle, ScamPy=roc_resultScamPy))

Two_Clusters_uneven_farPL <- Two_Clusters_uneven_far + xlab("FPR") + ylab("TPR")

Two_Clusters_uneven_farPL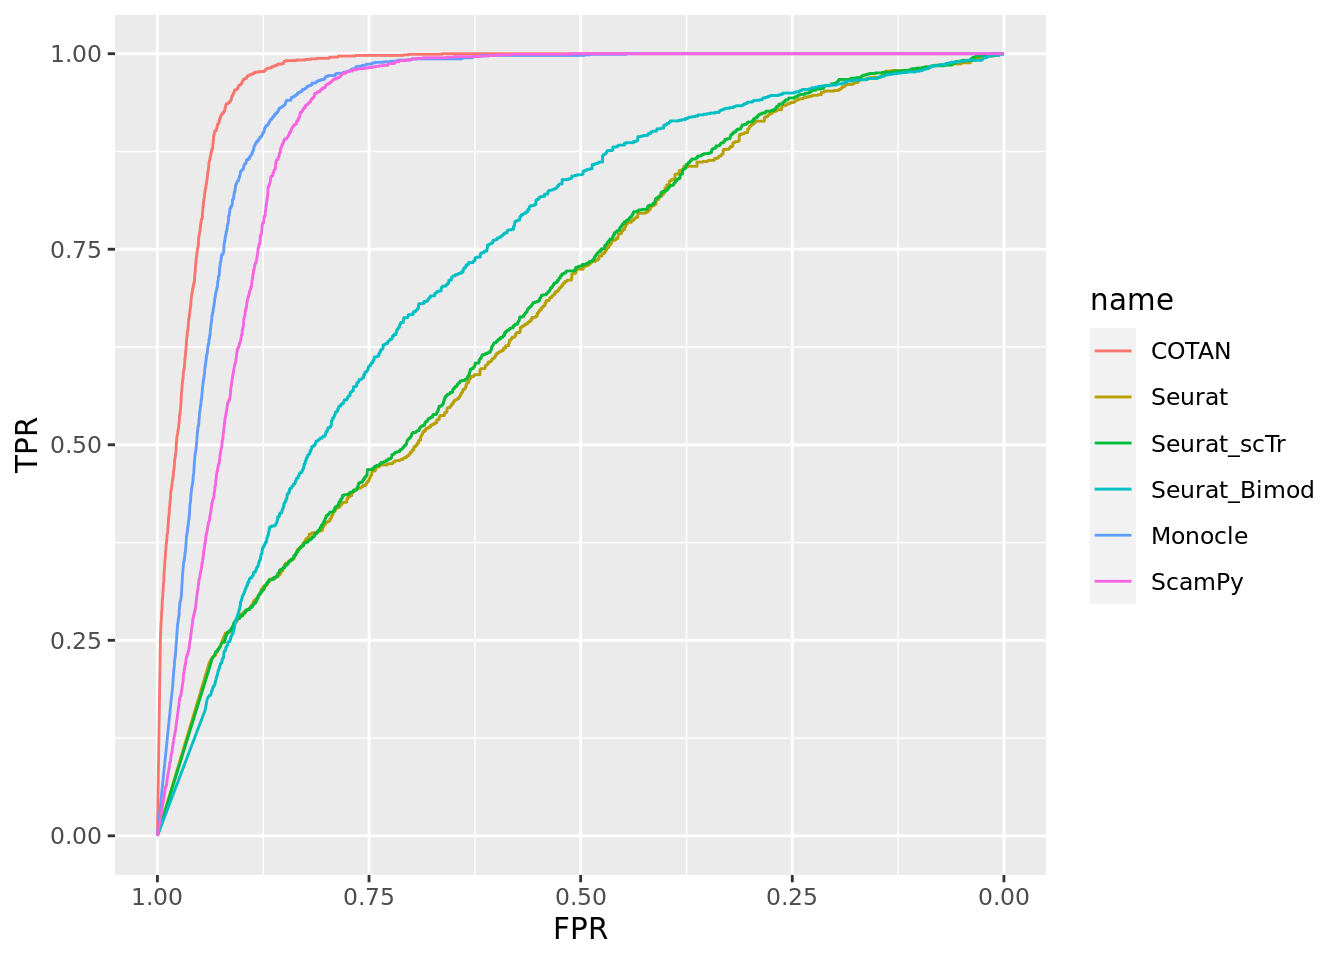
3 clusters
3_Clusters_even
True vector
subset.datasets_csv <-datasets_csv[datasets_csv$Group == "3_Clusters_even",]

ground_truth_tot <- NA

for (ind in 1:dim(subset.datasets_csv)[1]) {
  clusters <- str_split(subset.datasets_csv$Collection[ind],pattern = "_[+]_",simplify = T)

  file.presence.subset <- file.presence[,clusters]


  #file.presence.subset <- as.matrix(file.presence.subset)


  ground_truth <- as.data.frame(matrix(nrow = nrow(file.presence.subset),
                                       ncol = ncol(file.presence.subset)))
  rownames(ground_truth) <- rownames(file.presence.subset)
  colnames(ground_truth) <- colnames(file.presence.subset)

  ground_truth[file.presence.subset == "Absent"] <- 0
  ground_truth[file.presence.subset == "Present"] <- 1
  ground_truth[file.presence.subset == "Uncertain"] <- 0.6

  file.presence.subset <- ground_truth

  for (col in 1:ncol(ground_truth)) {
    ground_truth[,col] <- FALSE
    ground_truth[file.presence.subset[,col] == 1 & rowMeans(file.presence.subset[,-col,drop = FALSE]) < 0.555  ,col] <- TRUE
    }

  ground_truth$genes <- rownames(ground_truth)
  ground_truth <- pivot_longer(ground_truth,
                               cols = 1:(ncol(ground_truth)-1),
                               names_to = "clusters")
  ground_truth$data_set <- subset.datasets_csv[ind,1]
  ground_truth$set_number <- ind
  ground_truth_tot <- rbind(ground_truth_tot, ground_truth)

}
ground_truth_tot <- ground_truth_tot[2:nrow(ground_truth_tot),]

head(ground_truth_tot)
# A tibble: 6 × 5
genes clusters value data_set set_number
<chr> <chr> <lgl> <chr> <int>
1 Neil2 E15.0-437 FALSE 3_Clusters_even 1
2 Neil2 E13.5-510 FALSE 3_Clusters_even 1
3 Neil2 E13.5-437 FALSE 3_Clusters_even 1
4 Lamc1 E15.0-437 FALSE 3_Clusters_even 1
5 Lamc1 E13.5-510 FALSE 3_Clusters_even 1
6 Lamc1 E13.5-437 FALSE 3_Clusters_even 1length(unique(ground_truth_tot$genes)) [1] 14695sum(ground_truth_tot$value)[1] 1305ROC for COTAN
onlyPositive.pVal.Cotan_tot <- NA

for (ind in 1:dim(subset.datasets_csv)[1]) {
  #print(ind)
  file.code <- paste0(subset.datasets_csv$Group[ind],"_",
                      subset.datasets_csv$Collection[ind])
  dataset <- readRDS(file = file.path(dataSetDir,paste0(file.code,".RDS")))
  deaCOTAN <- getClusterizationData(dataset,clName = "mergedClusters")[[2]]
  pvalCOTAN <- pValueFromDEA(deaCOTAN,
              numCells = getNumCells(dataset),adjustmentMethod = "none")

  clusterization <- getClusterizationData(dataset, clName = "mergedClusters")[[1]]
  cl.names <- NA

  for (cl.val in  unique(clusterization)) {
    #print(cl.val)
    cl.names <- c(cl.names,
                  str_split(names(clusterization[clusterization == cl.val])[1],
                            pattern = "_",simplify = T)[1])
    cl.names <- cl.names[!is.na(cl.names)]
  }
  colnames(deaCOTAN) <- cl.names
  colnames(pvalCOTAN) <- cl.names

  clusters <- str_split(datasets_csv$Collection[ind],pattern = "_[+]_",simplify = T)

  onlyPositive.pVal.Cotan <- pvalCOTAN

    for (cl in cl.names) {
    print(cl)
    #temp.DEA.CotanSign <- deaCOTAN[rownames(pvalCOTAN[pvalCOTAN[,cl] < 0.05,]) ,]
    onlyPositive.pVal.Cotan[rownames(deaCOTAN[deaCOTAN[,cl] < 0,]),cl] <-  1 #onlyPositive.pVal.Cotan[rownames(deaCOTAN[deaCOTAN[,cl] < 0,]),cl]+1
    }

    onlyPositive.pVal.Cotan$genes <- rownames(onlyPositive.pVal.Cotan)
    onlyPositive.pVal.Cotan <- pivot_longer(onlyPositive.pVal.Cotan,
                                            values_to = "p_values",
                               cols = 1:(ncol(onlyPositive.pVal.Cotan)-1),
                               names_to = "clusters")
  onlyPositive.pVal.Cotan$data_set <- subset.datasets_csv[ind,1]
  onlyPositive.pVal.Cotan$set_number <- ind
  onlyPositive.pVal.Cotan_tot <- rbind(onlyPositive.pVal.Cotan_tot, onlyPositive.pVal.Cotan)

  }
[1] "E13.5-437"
[1] "E15.0-437"
[1] "E13.5-510"
[1] "E17.5-516"
[1] "E13.5-437"
[1] "E17.5-505"
[1] "E15.0-510"
[1] "E15.0-428"
[1] "E13.5-510"onlyPositive.pVal.Cotan_tot <- onlyPositive.pVal.Cotan_tot[2:nrow(onlyPositive.pVal.Cotan_tot),]
onlyPositive.pVal.Cotan_tot <- merge.data.frame(onlyPositive.pVal.Cotan_tot,
ground_truth_tot,by = c("genes","clusters","data_set","set_number"),all.x = T,all.y = F)
#onlyPositive.pVal.Cotan_tot <- onlyPositive.pVal.Cotan_tot[order(onlyPositive.pVal.Cotan_tot$p_values,
# decreasing = F),]
# df <- as.data.frame(matrix(nrow = nrow(onlyPositive.pVal.Cotan_tot),ncol = 3))
# colnames(df) <- c("TPR","FPR","Method")
# df$Method <- "COTAN"
#
# Positive <- sum(onlyPositive.pVal.Cotan_tot$value)
# Negative <- sum(!onlyPositive.pVal.Cotan_tot$value)
#
# for (i in 1:nrow(onlyPositive.pVal.Cotan_tot)) {
# df[i,"TPR"] <- sum(onlyPositive.pVal.Cotan_tot[1:i,"value"])/Positive
# df[i,"FPR"] <- (i-sum(onlyPositive.pVal.Cotan_tot[1:i,"value"]))/Negative
# Convert TRUE/FALSE to 1/0
onlyPositive.pVal.Cotan_tot$value <- as.numeric(onlyPositive.pVal.Cotan_tot$value)
# Compute the ROC curve - note that we invert the p-values with 1 - p_values
roc_resultCOTAN <- roc(onlyPositive.pVal.Cotan_tot$value, 1 - onlyPositive.pVal.Cotan_tot$p_values)
# Plot the ROC curve
#plot(roc_resultCOTAN)ROC for Seurat
deaSeurat_tot <- NA

for (ind in 1:dim(subset.datasets_csv)[1]) {
  #print(ind)
  file.code <- paste0(subset.datasets_csv$Group[ind],"_",subset.datasets_csv$Collection[ind])

  dataset <- readRDS(file = file.path(dataSetDir,paste0(file.code,".RDS")))

  clusterization <- getClusterizationData(dataset, clName = "mergedClusters")[[1]]

  deaSeurat <- read.csv(file.path(dirOut,paste0(file.code,"Seurat_DEA_genes.csv")), row.names = 1)

  cl.names <- NA

  for (cl.val in  unique(clusterization)) {
    #print(cl.val)
    cl.name <- str_split(names(clusterization[clusterization == cl.val])[1],
                            pattern = "_",simplify = T)[1]
    cl.names <- c(cl.names,cl.name)
    cl.names <- cl.names[!is.na(cl.names)]

    deaSeurat[deaSeurat$cluster == cl.val,]$cluster <- cl.name

  }

  clusters <- str_split(datasets_csv$Collection[ind],pattern = "_[+]_",simplify = T)

  colnames(deaSeurat) <- str_replace(colnames(deaSeurat),
                                     pattern = "cluster",
                                     replacement = "clusters")
  colnames(deaSeurat) <- str_replace(colnames(deaSeurat),
                                     pattern = "gene",
                                     replacement = "genes")

  deaSeurat$data_set <- subset.datasets_csv[ind,1]
  deaSeurat$set_number <- ind
  deaSeurat_tot <- rbind(deaSeurat_tot, deaSeurat)


  }
 deaSeurat_tot <-  deaSeurat_tot[2:nrow(deaSeurat_tot),]

 deaSeurat_tot <- merge.data.frame(deaSeurat_tot,
                                   ground_truth_tot,
                                   by = c("genes","clusters","data_set","set_number"),
                                   all.x = T,all.y = F)

# Convert TRUE/FALSE to 1/0
deaSeurat_tot$value <- as.numeric(deaSeurat_tot$value)

# Compute the ROC curve - note that we invert the p-values with 1 - p_values
roc_resultSeurat <- roc(deaSeurat_tot$value, 1 - deaSeurat_tot$p_val)

# Plot the ROC curve
#plot(roc_resultSeurat)
ROC for Seurat scTransform
deaSeurat_tot <- NA

for (ind in 1:dim(subset.datasets_csv)[1]) {
  #print(ind)
  file.code <- paste0(subset.datasets_csv$Group[ind],"_",subset.datasets_csv$Collection[ind])

  dataset <- readRDS(file = file.path(dataSetDir,paste0(file.code,".RDS")))

  clusterization <- getClusterizationData(dataset, clName = "mergedClusters")[[1]]

  deaSeurat <- read.csv(file.path(dirOut,paste0(file.code,"Seurat_DEA_ScTransform_genes.csv")), row.names = 1)

  cl.names <- NA

  for (cl.val in  unique(clusterization)) {
    #print(cl.val)
    cl.name <- str_split(names(clusterization[clusterization == cl.val])[1],
                            pattern = "_",simplify = T)[1]
    cl.names <- c(cl.names,cl.name)
    cl.names <- cl.names[!is.na(cl.names)]

    deaSeurat[deaSeurat$cluster == cl.val,]$cluster <- cl.name

  }

  clusters <- str_split(datasets_csv$Collection[ind],pattern = "_[+]_",simplify = T)

  colnames(deaSeurat) <- str_replace(colnames(deaSeurat),
                                     pattern = "cluster",
                                     replacement = "clusters")
  colnames(deaSeurat) <- str_replace(colnames(deaSeurat),
                                     pattern = "gene",
                                     replacement = "genes")

  deaSeurat$data_set <- subset.datasets_csv[ind,1]
  deaSeurat$set_number <- ind
  deaSeurat_tot <- rbind(deaSeurat_tot, deaSeurat)


  }
 deaSeurat_tot <-  deaSeurat_tot[2:nrow(deaSeurat_tot),]

 deaSeurat_tot <- merge.data.frame(deaSeurat_tot,
                                   ground_truth_tot,
                                   by = c("genes","clusters","data_set","set_number"),
                                   all.x = T,all.y = F)

# Convert TRUE/FALSE to 1/0
deaSeurat_tot$value <- as.numeric(deaSeurat_tot$value)

# Compute the ROC curve - note that we invert the p-values with 1 - p_values
roc_resultSeurat_scTr <- roc(deaSeurat_tot$value, 1 - deaSeurat_tot$p_val)
ROC for Seurat Bimod
deaSeurat_tot <- NA

for (ind in 1:dim(subset.datasets_csv)[1]) {
  #print(ind)
  file.code <- paste0(subset.datasets_csv$Group[ind],"_",subset.datasets_csv$Collection[ind])

  dataset <- readRDS(file = file.path(dataSetDir,paste0(file.code,".RDS")))

  clusterization <- getClusterizationData(dataset, clName = "mergedClusters")[[1]]

  deaSeurat <- read.csv(file.path(dirOut,paste0(file.code,"Seurat_DEA_Bimod_genes.csv")), row.names = 1)

  cl.names <- NA

  for (cl.val in  unique(clusterization)) {
    #print(cl.val)
    cl.name <- str_split(names(clusterization[clusterization == cl.val])[1],
                            pattern = "_",simplify = T)[1]
    cl.names <- c(cl.names,cl.name)
    cl.names <- cl.names[!is.na(cl.names)]

    deaSeurat[deaSeurat$cluster == cl.val,]$cluster <- cl.name

  }

  clusters <- str_split(datasets_csv$Collection[ind],pattern = "_[+]_",simplify = T)

  colnames(deaSeurat) <- str_replace(colnames(deaSeurat),
                                     pattern = "cluster",
                                     replacement = "clusters")
  colnames(deaSeurat) <- str_replace(colnames(deaSeurat),
                                     pattern = "gene",
                                     replacement = "genes")

  deaSeurat$data_set <- subset.datasets_csv[ind,1]
  deaSeurat$set_number <- ind
  deaSeurat_tot <- rbind(deaSeurat_tot, deaSeurat)


  }
 deaSeurat_tot <-  deaSeurat_tot[2:nrow(deaSeurat_tot),]

 deaSeurat_tot <- merge.data.frame(deaSeurat_tot,
                                   ground_truth_tot,
                                   by = c("genes","clusters","data_set","set_number"),
                                   all.x = T,all.y = F)

# Convert TRUE/FALSE to 1/0
deaSeurat_tot$value <- as.numeric(deaSeurat_tot$value)

# Compute the ROC curve - note that we invert the p-values with 1 - p_values
roc_resultSeurat_Bimod <- roc(deaSeurat_tot$value, 1 - deaSeurat_tot$p_val)
ROC for Monocle
deaMonocle_tot <- NA
for (ind in 1:dim(subset.datasets_csv)[1]) {
  file.code <- paste0(subset.datasets_csv$Group[ind],"_",subset.datasets_csv$Collection[ind])
  dataset <- readRDS(file = file.path(dataSetDir,paste0(file.code,".RDS")))

  clusterization <- getClusterizationData(dataset, clName = "mergedClusters")[[1]]
  #print(file.code)

  deaMonocle <- read.csv(file.path(dirOut,paste0(file.code,"Monocle_DEA_genes.csv")),row.names = 1)

  cl.names <- NA

  for (cl.val in  unique(clusterization)) {
    #print(cl.val)
    cl.name <- str_split(names(clusterization[clusterization == cl.val])[1],
                            pattern = "_",simplify = T)[1]
    cl.names <- c(cl.names,cl.name)
    cl.names <- cl.names[!is.na(cl.names)]

    deaMonocle[deaMonocle$cell_group == cl.val,"cell_group"] <- cl.name

  }

  clusters <- str_split(datasets_csv$Collection[ind],pattern = "_[+]_",simplify = T)

  colnames(deaMonocle) <- str_replace(colnames(deaMonocle),
                                     pattern = "cell_group",
                                     replacement = "clusters")
  colnames(deaMonocle) <- str_replace(colnames(deaMonocle),
                                     pattern = "gene_id",
                                     replacement = "genes")

  deaMonocle$data_set <- subset.datasets_csv[ind,1]
  deaMonocle$set_number <- ind
  deaMonocle <- as.data.frame(deaMonocle)
  deaMonocle_tot <- rbind(deaMonocle_tot, deaMonocle)


  }
 deaMonocle_tot <-  deaMonocle_tot[2:nrow(deaMonocle_tot),]

 deaMonocle_tot <- merge.data.frame(deaMonocle_tot,
                                   ground_truth_tot,
                                   by = c("genes","clusters","data_set","set_number"),
                                   all.x = T,all.y = F)

# Convert TRUE/FALSE to 1/0
deaMonocle_tot$value <- as.numeric(deaMonocle_tot$value)

# Compute the ROC curve - note that we invert the p-values with 1 - p_values
roc_resultMonocle <- roc(deaMonocle_tot$value, 1 - deaMonocle_tot$marker_test_p_value)

# Plot the ROC curve
#plot(roc_resultMonocle)
ROC from ScamPy
deaScamPy_tot <- NA
for (ind in 1:dim(subset.datasets_csv)[1]) {
  file.code <- paste0(subset.datasets_csv$Group[ind],"_",subset.datasets_csv$Collection[ind])
  dataset <- readRDS(file = file.path(dataSetDir,paste0(file.code,".RDS")))

  clusterization <- getClusterizationData(dataset, clName = "mergedClusters")[[1]]
  #print(file.code)

  deaScamPy <- read.csv(file.path(dirOut,paste0(file.code,"ScanPy_DEA_genes.csv")),
                        row.names = 1)

  cl.names <- NA

  for (cl.val in  unique(clusterization)) {
    #print(cl.val)
    cl.name <- str_split(names(clusterization[clusterization == cl.val])[1],
                            pattern = "_",simplify = T)[1]
    cl.names <- c(cl.names,cl.name)
    cl.names <- cl.names[!is.na(cl.names)]

    deaScamPy[deaScamPy$clusters == paste0("cl",cl.val),"clusters"] <- cl.name

  }

  clusters <- str_split(datasets_csv$Collection[ind],pattern = "_[+]_",simplify = T)


  deaScamPy$data_set <- subset.datasets_csv[ind,1]
  deaScamPy$set_number <- ind
  deaScamPy_tot <- rbind(deaScamPy_tot, deaScamPy)


  }
 deaScamPy_tot <-  deaScamPy_tot[2:nrow(deaScamPy_tot),]

 deaScamPy_tot <- merge.data.frame(deaScamPy_tot,
                                   ground_truth_tot,
                                   by = c("genes","clusters","data_set","set_number"),
                                   all.x = T,all.y = F)

# Convert TRUE/FALSE to 1/0
deaScamPy_tot$value <- as.numeric(deaScamPy_tot$value)

# Compute the ROC curve - note that we invert the p-values with 1 - p_values
roc_resultScamPy <- roc(deaScamPy_tot$value, 1 - deaScamPy_tot$pval)

# Plot the ROC curve
#plot(roc_resultScamPy)
Summary ROC for all methods
Three_Clusters_even <- ggroc(list(COTAN=roc_resultCOTAN, Seurat=roc_resultSeurat,                  Seurat_scTr = roc_resultSeurat_scTr, Seurat_Bimod = roc_resultSeurat_Bimod,
                 Monocle=roc_resultMonocle, ScamPy=roc_resultScamPy))

Three_Clusters_evenPL <- Three_Clusters_even +
  xlab("FPR") + ylab("TPR")+theme(legend.position="none")
Three_Clusters_even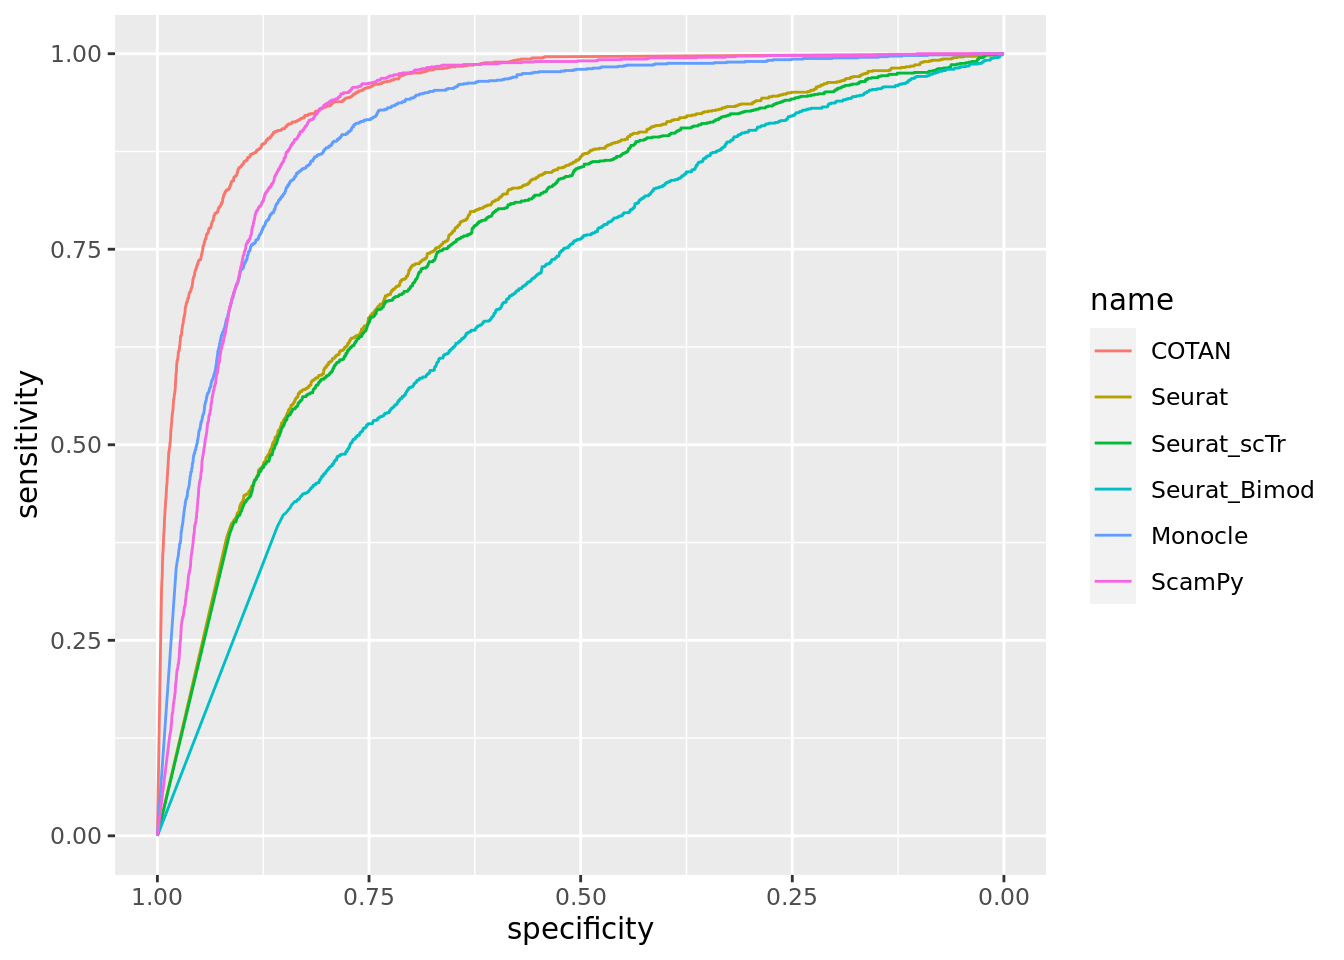
3_Clusters_uneven
True vector
subset.datasets_csv <-datasets_csv[datasets_csv$Group == "3_Clusters_uneven",]

ground_truth_tot <- NA

for (ind in 1:dim(subset.datasets_csv)[1]) {
  clusters <- str_split(subset.datasets_csv$Collection[ind],pattern = "_[+]_",simplify = T)

  file.presence.subset <- file.presence[,clusters]


  #file.presence.subset <- as.matrix(file.presence.subset)


  ground_truth <- as.data.frame(matrix(nrow = nrow(file.presence.subset),
                                       ncol = ncol(file.presence.subset)))
  rownames(ground_truth) <- rownames(file.presence.subset)
  colnames(ground_truth) <- colnames(file.presence.subset)

  ground_truth[file.presence.subset == "Absent"] <- 0
  ground_truth[file.presence.subset == "Present"] <- 1
  ground_truth[file.presence.subset == "Uncertain"] <- 0.6

  file.presence.subset <- ground_truth

  for (col in 1:ncol(ground_truth)) {
    ground_truth[,col] <- FALSE
    ground_truth[file.presence.subset[,col] == 1 & rowMeans(file.presence.subset[,-col,drop = FALSE]) < 0.555  ,col] <- TRUE
    }

  ground_truth$genes <- rownames(ground_truth)
  ground_truth <- pivot_longer(ground_truth,
                               cols = 1:(ncol(ground_truth)-1),
                               names_to = "clusters")
  ground_truth$data_set <- subset.datasets_csv[ind,1]
  ground_truth$set_number <- ind
  ground_truth_tot <- rbind(ground_truth_tot, ground_truth)

}
ground_truth_tot <- ground_truth_tot[2:nrow(ground_truth_tot),]

head(ground_truth_tot)
# A tibble: 6 × 5
genes clusters value data_set set_number
<chr> <chr> <lgl> <chr> <int>
1 Neil2 E15.0-428 FALSE 3_Clusters_uneven 1
2 Neil2 E13.5-434 FALSE 3_Clusters_uneven 1
3 Neil2 E15.0-510 FALSE 3_Clusters_uneven 1
4 Lamc1 E15.0-428 FALSE 3_Clusters_uneven 1
5 Lamc1 E13.5-434 FALSE 3_Clusters_uneven 1
6 Lamc1 E15.0-510 FALSE 3_Clusters_uneven 1length(unique(ground_truth_tot$genes)) [1] 14695sum(ground_truth_tot$value)[1] 1577ROC for COTAN
onlyPositive.pVal.Cotan_tot <- NA

for (ind in 1:dim(subset.datasets_csv)[1]) {
  #print(ind)
  file.code <- paste0(subset.datasets_csv$Group[ind],"_",
                      subset.datasets_csv$Collection[ind])
  dataset <- readRDS(file = file.path(dataSetDir,paste0(file.code,".RDS")))
  deaCOTAN <- getClusterizationData(dataset,clName = "mergedClusters")[[2]]
  pvalCOTAN <- pValueFromDEA(deaCOTAN,
              numCells = getNumCells(dataset),adjustmentMethod = "none")

  clusterization <- getClusterizationData(dataset, clName = "mergedClusters")[[1]]
  cl.names <- NA

  for (cl.val in  unique(clusterization)) {
    #print(cl.val)
    cl.names <- c(cl.names,
                  str_split(names(clusterization[clusterization == cl.val])[1],
                            pattern = "_",simplify = T)[1])
    cl.names <- cl.names[!is.na(cl.names)]
  }
  colnames(deaCOTAN) <- cl.names
  colnames(pvalCOTAN) <- cl.names

  clusters <- str_split(datasets_csv$Collection[ind],pattern = "_[+]_",simplify = T)

  onlyPositive.pVal.Cotan <- pvalCOTAN

    for (cl in cl.names) {
    print(cl)
    #temp.DEA.CotanSign <- deaCOTAN[rownames(pvalCOTAN[pvalCOTAN[,cl] < 0.05,]) ,]
    onlyPositive.pVal.Cotan[rownames(deaCOTAN[deaCOTAN[,cl] < 0,]),cl] <-  1 #onlyPositive.pVal.Cotan[rownames(deaCOTAN[deaCOTAN[,cl] < 0,]),cl]+1
    }

    onlyPositive.pVal.Cotan$genes <- rownames(onlyPositive.pVal.Cotan)
    onlyPositive.pVal.Cotan <- pivot_longer(onlyPositive.pVal.Cotan,
                                            values_to = "p_values",
                               cols = 1:(ncol(onlyPositive.pVal.Cotan)-1),
                               names_to = "clusters")
  onlyPositive.pVal.Cotan$data_set <- subset.datasets_csv[ind,1]
  onlyPositive.pVal.Cotan$set_number <- ind
  onlyPositive.pVal.Cotan_tot <- rbind(onlyPositive.pVal.Cotan_tot, onlyPositive.pVal.Cotan)

  }
[1] "E15.0-510"
[1] "E13.5-434"
[1] "E15.0-428"
[1] "E15.0-432"
[1] "E13.5-432"
[1] "E13.5-187"
[1] "E15.0-509"
[1] "E15.0-508"
[1] "E13.5-184"onlyPositive.pVal.Cotan_tot <- onlyPositive.pVal.Cotan_tot[2:nrow(onlyPositive.pVal.Cotan_tot),]
onlyPositive.pVal.Cotan_tot <- merge.data.frame(onlyPositive.pVal.Cotan_tot,
ground_truth_tot,by = c("genes","clusters","data_set","set_number"),all.x = T,all.y = F)
#onlyPositive.pVal.Cotan_tot <- onlyPositive.pVal.Cotan_tot[order(onlyPositive.pVal.Cotan_tot$p_values,
# decreasing = F),]
# df <- as.data.frame(matrix(nrow = nrow(onlyPositive.pVal.Cotan_tot),ncol = 3))
# colnames(df) <- c("TPR","FPR","Method")
# df$Method <- "COTAN"
#
# Positive <- sum(onlyPositive.pVal.Cotan_tot$value)
# Negative <- sum(!onlyPositive.pVal.Cotan_tot$value)
#
# for (i in 1:nrow(onlyPositive.pVal.Cotan_tot)) {
# df[i,"TPR"] <- sum(onlyPositive.pVal.Cotan_tot[1:i,"value"])/Positive
# df[i,"FPR"] <- (i-sum(onlyPositive.pVal.Cotan_tot[1:i,"value"]))/Negative
# Convert TRUE/FALSE to 1/0
onlyPositive.pVal.Cotan_tot$value <- as.numeric(onlyPositive.pVal.Cotan_tot$value)
# Compute the ROC curve - note that we invert the p-values with 1 - p_values
roc_resultCOTAN <- roc(onlyPositive.pVal.Cotan_tot$value, 1 - onlyPositive.pVal.Cotan_tot$p_values)
# Plot the ROC curve
#plot(roc_resultCOTAN)ROC for Seurat
deaSeurat_tot <- NA

for (ind in 1:dim(subset.datasets_csv)[1]) {
  #print(ind)
  file.code <- paste0(subset.datasets_csv$Group[ind],"_",subset.datasets_csv$Collection[ind])

  dataset <- readRDS(file = file.path(dataSetDir,paste0(file.code,".RDS")))

  clusterization <- getClusterizationData(dataset, clName = "mergedClusters")[[1]]

  deaSeurat <- read.csv(file.path(dirOut,paste0(file.code,"Seurat_DEA_genes.csv")), row.names = 1)

  cl.names <- NA

  for (cl.val in  unique(clusterization)) {
    #print(cl.val)
    cl.name <- str_split(names(clusterization[clusterization == cl.val])[1],
                            pattern = "_",simplify = T)[1]
    cl.names <- c(cl.names,cl.name)
    cl.names <- cl.names[!is.na(cl.names)]

    deaSeurat[deaSeurat$cluster == cl.val,]$cluster <- cl.name

  }

  clusters <- str_split(datasets_csv$Collection[ind],pattern = "_[+]_",simplify = T)

  colnames(deaSeurat) <- str_replace(colnames(deaSeurat),
                                     pattern = "cluster",
                                     replacement = "clusters")
  colnames(deaSeurat) <- str_replace(colnames(deaSeurat),
                                     pattern = "gene",
                                     replacement = "genes")

  deaSeurat$data_set <- subset.datasets_csv[ind,1]
  deaSeurat$set_number <- ind
  deaSeurat_tot <- rbind(deaSeurat_tot, deaSeurat)


  }
 deaSeurat_tot <-  deaSeurat_tot[2:nrow(deaSeurat_tot),]

 deaSeurat_tot <- merge.data.frame(deaSeurat_tot,
                                   ground_truth_tot,
                                   by = c("genes","clusters","data_set","set_number"),
                                   all.x = T,all.y = F)

# Convert TRUE/FALSE to 1/0
deaSeurat_tot$value <- as.numeric(deaSeurat_tot$value)

# Compute the ROC curve - note that we invert the p-values with 1 - p_values
roc_resultSeurat <- roc(deaSeurat_tot$value, 1 - deaSeurat_tot$p_val)

# Plot the ROC curve
#plot(roc_resultSeurat)
ROC for Seurat scTransform
deaSeurat_tot <- NA

for (ind in 1:dim(subset.datasets_csv)[1]) {
  #print(ind)
  file.code <- paste0(subset.datasets_csv$Group[ind],"_",subset.datasets_csv$Collection[ind])

  dataset <- readRDS(file = file.path(dataSetDir,paste0(file.code,".RDS")))

  clusterization <- getClusterizationData(dataset, clName = "mergedClusters")[[1]]

  deaSeurat <- read.csv(file.path(dirOut,paste0(file.code,"Seurat_DEA_ScTransform_genes.csv")), row.names = 1)

  cl.names <- NA

  for (cl.val in  unique(clusterization)) {
    #print(cl.val)
    cl.name <- str_split(names(clusterization[clusterization == cl.val])[1],
                            pattern = "_",simplify = T)[1]
    cl.names <- c(cl.names,cl.name)
    cl.names <- cl.names[!is.na(cl.names)]

    deaSeurat[deaSeurat$cluster == cl.val,]$cluster <- cl.name

  }

  clusters <- str_split(datasets_csv$Collection[ind],pattern = "_[+]_",simplify = T)

  colnames(deaSeurat) <- str_replace(colnames(deaSeurat),
                                     pattern = "cluster",
                                     replacement = "clusters")
  colnames(deaSeurat) <- str_replace(colnames(deaSeurat),
                                     pattern = "gene",
                                     replacement = "genes")

  deaSeurat$data_set <- subset.datasets_csv[ind,1]
  deaSeurat$set_number <- ind
  deaSeurat_tot <- rbind(deaSeurat_tot, deaSeurat)


  }
 deaSeurat_tot <-  deaSeurat_tot[2:nrow(deaSeurat_tot),]

 deaSeurat_tot <- merge.data.frame(deaSeurat_tot,
                                   ground_truth_tot,
                                   by = c("genes","clusters","data_set","set_number"),
                                   all.x = T,all.y = F)

# Convert TRUE/FALSE to 1/0
deaSeurat_tot$value <- as.numeric(deaSeurat_tot$value)

# Compute the ROC curve - note that we invert the p-values with 1 - p_values
roc_resultSeurat_scTr <- roc(deaSeurat_tot$value, 1 - deaSeurat_tot$p_val)
ROC for Seurat Bimod
deaSeurat_tot <- NA

for (ind in 1:dim(subset.datasets_csv)[1]) {
  #print(ind)
  file.code <- paste0(subset.datasets_csv$Group[ind],"_",subset.datasets_csv$Collection[ind])

  dataset <- readRDS(file = file.path(dataSetDir,paste0(file.code,".RDS")))

  clusterization <- getClusterizationData(dataset, clName = "mergedClusters")[[1]]

  deaSeurat <- read.csv(file.path(dirOut,paste0(file.code,"Seurat_DEA_Bimod_genes.csv")), row.names = 1)

  cl.names <- NA

  for (cl.val in  unique(clusterization)) {
    #print(cl.val)
    cl.name <- str_split(names(clusterization[clusterization == cl.val])[1],
                            pattern = "_",simplify = T)[1]
    cl.names <- c(cl.names,cl.name)
    cl.names <- cl.names[!is.na(cl.names)]

    deaSeurat[deaSeurat$cluster == cl.val,]$cluster <- cl.name

  }

  clusters <- str_split(datasets_csv$Collection[ind],pattern = "_[+]_",simplify = T)

  colnames(deaSeurat) <- str_replace(colnames(deaSeurat),
                                     pattern = "cluster",
                                     replacement = "clusters")
  colnames(deaSeurat) <- str_replace(colnames(deaSeurat),
                                     pattern = "gene",
                                     replacement = "genes")

  deaSeurat$data_set <- subset.datasets_csv[ind,1]
  deaSeurat$set_number <- ind
  deaSeurat_tot <- rbind(deaSeurat_tot, deaSeurat)


  }
 deaSeurat_tot <-  deaSeurat_tot[2:nrow(deaSeurat_tot),]

 deaSeurat_tot <- merge.data.frame(deaSeurat_tot,
                                   ground_truth_tot,
                                   by = c("genes","clusters","data_set","set_number"),
                                   all.x = T,all.y = F)

# Convert TRUE/FALSE to 1/0
deaSeurat_tot$value <- as.numeric(deaSeurat_tot$value)

# Compute the ROC curve - note that we invert the p-values with 1 - p_values
roc_resultSeurat_Bimod <- roc(deaSeurat_tot$value, 1 - deaSeurat_tot$p_val)
ROC for Monocle
deaMonocle_tot <- NA
for (ind in 1:dim(subset.datasets_csv)[1]) {
  file.code <- paste0(subset.datasets_csv$Group[ind],"_",subset.datasets_csv$Collection[ind])
  dataset <- readRDS(file = file.path(dataSetDir,paste0(file.code,".RDS")))

  clusterization <- getClusterizationData(dataset, clName = "mergedClusters")[[1]]
  #print(file.code)

  deaMonocle <- read.csv(file.path(dirOut,paste0(file.code,"Monocle_DEA_genes.csv")),row.names = 1)

  cl.names <- NA

  for (cl.val in  unique(clusterization)) {
    #print(cl.val)
    cl.name <- str_split(names(clusterization[clusterization == cl.val])[1],
                            pattern = "_",simplify = T)[1]
    cl.names <- c(cl.names,cl.name)
    cl.names <- cl.names[!is.na(cl.names)]

    deaMonocle[deaMonocle$cell_group == cl.val,"cell_group"] <- cl.name

  }

  clusters <- str_split(datasets_csv$Collection[ind],pattern = "_[+]_",simplify = T)

  colnames(deaMonocle) <- str_replace(colnames(deaMonocle),
                                     pattern = "cell_group",
                                     replacement = "clusters")
  colnames(deaMonocle) <- str_replace(colnames(deaMonocle),
                                     pattern = "gene_id",
                                     replacement = "genes")

  deaMonocle$data_set <- subset.datasets_csv[ind,1]
  deaMonocle$set_number <- ind
  deaMonocle <- as.data.frame(deaMonocle)
  deaMonocle_tot <- rbind(deaMonocle_tot, deaMonocle)


  }
 deaMonocle_tot <-  deaMonocle_tot[2:nrow(deaMonocle_tot),]

 deaMonocle_tot <- merge.data.frame(deaMonocle_tot,
                                   ground_truth_tot,
                                   by = c("genes","clusters","data_set","set_number"),
                                   all.x = T,all.y = F)

# Convert TRUE/FALSE to 1/0
deaMonocle_tot$value <- as.numeric(deaMonocle_tot$value)

# Compute the ROC curve - note that we invert the p-values with 1 - p_values
roc_resultMonocle <- roc(deaMonocle_tot$value, 1 - deaMonocle_tot$marker_test_p_value)

# Plot the ROC curve
#plot(roc_resultMonocle)
ROC from ScamPy
deaScamPy_tot <- NA
for (ind in 1:dim(subset.datasets_csv)[1]) {
  file.code <- paste0(subset.datasets_csv$Group[ind],"_",subset.datasets_csv$Collection[ind])
  dataset <- readRDS(file = file.path(dataSetDir,paste0(file.code,".RDS")))

  clusterization <- getClusterizationData(dataset, clName = "mergedClusters")[[1]]
  #print(file.code)

  deaScamPy <- read.csv(file.path(dirOut,paste0(file.code,"ScanPy_DEA_genes.csv")),
                        row.names = 1)

  cl.names <- NA

  for (cl.val in  unique(clusterization)) {
    #print(cl.val)
    cl.name <- str_split(names(clusterization[clusterization == cl.val])[1],
                            pattern = "_",simplify = T)[1]
    cl.names <- c(cl.names,cl.name)
    cl.names <- cl.names[!is.na(cl.names)]

    deaScamPy[deaScamPy$clusters == paste0("cl",cl.val),"clusters"] <- cl.name

  }

  clusters <- str_split(datasets_csv$Collection[ind],pattern = "_[+]_",simplify = T)


  deaScamPy$data_set <- subset.datasets_csv[ind,1]
  deaScamPy$set_number <- ind
  deaScamPy_tot <- rbind(deaScamPy_tot, deaScamPy)


  }
 deaScamPy_tot <-  deaScamPy_tot[2:nrow(deaScamPy_tot),]

 deaScamPy_tot <- merge.data.frame(deaScamPy_tot,
                                   ground_truth_tot,
                                   by = c("genes","clusters","data_set","set_number"),
                                   all.x = T,all.y = F)

# Convert TRUE/FALSE to 1/0
deaScamPy_tot$value <- as.numeric(deaScamPy_tot$value)

# Compute the ROC curve - note that we invert the p-values with 1 - p_values
roc_resultScamPy <- roc(deaScamPy_tot$value, 1 - deaScamPy_tot$pval)

# Plot the ROC curve
#plot(roc_resultScamPy)
Summary ROC for all methods
Three_Clusters_uneven <- ggroc(list(COTAN=roc_resultCOTAN, Seurat=roc_resultSeurat,                  Seurat_scTr = roc_resultSeurat_scTr, Seurat_Bimod = roc_resultSeurat_Bimod,
                 Monocle=roc_resultMonocle, ScamPy=roc_resultScamPy))

Three_Clusters_unevenPL <- Three_Clusters_uneven + xlab("FPR") + ylab("TPR")+theme(legend.position="none")

Three_Clusters_uneven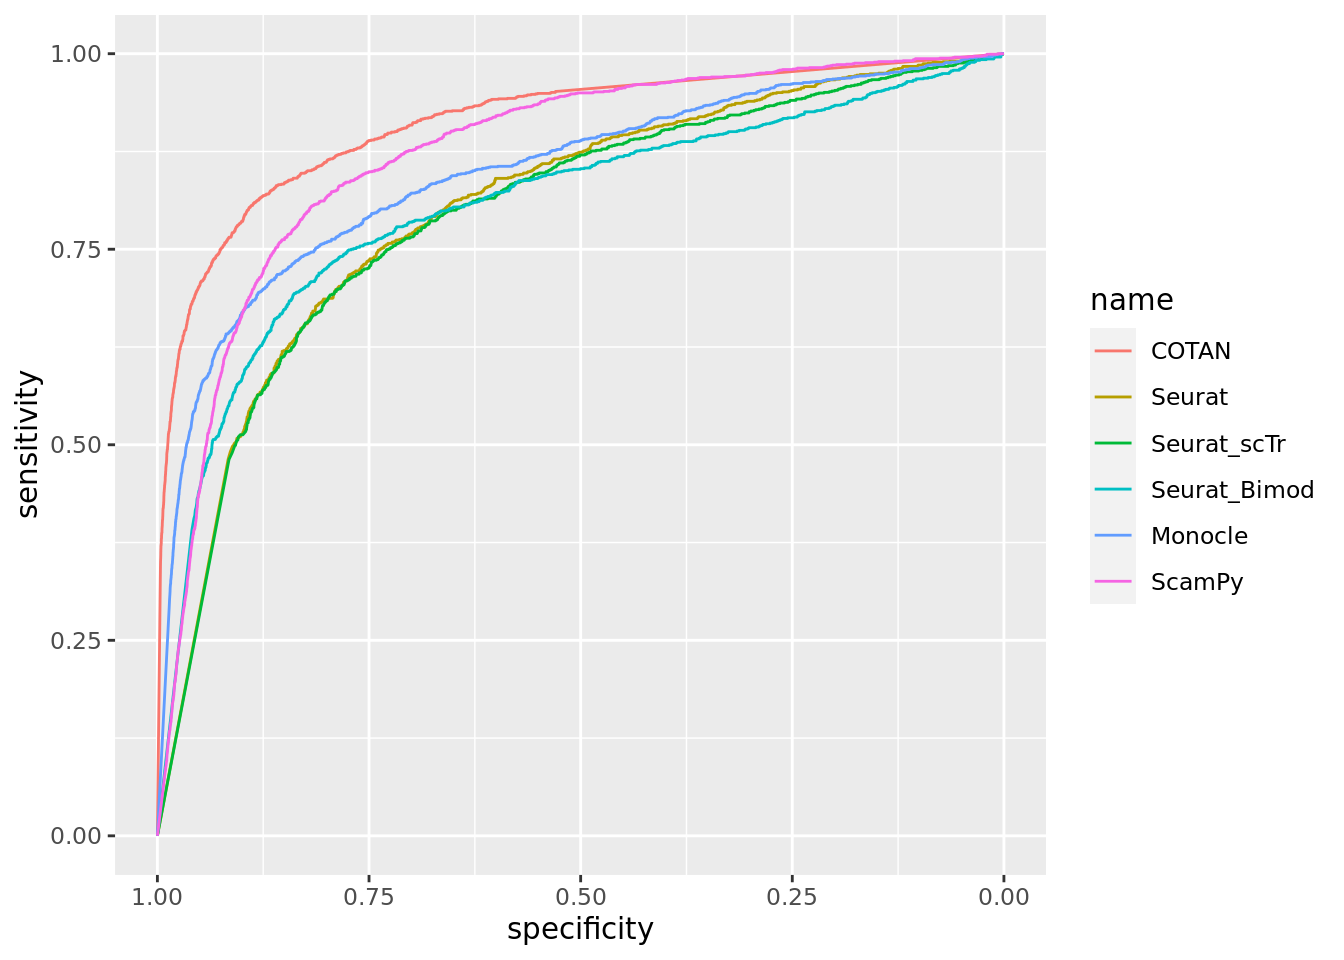
5 clusters
5_Clusters_uneven
True vector
subset.datasets_csv <-datasets_csv[datasets_csv$Group == "5_Clusters_uneven",]

ground_truth_tot <- NA

for (ind in 1:dim(subset.datasets_csv)[1]) {
  clusters <- str_split(subset.datasets_csv$Collection[ind],pattern = "_[+]_",simplify = T)

  file.presence.subset <- file.presence[,clusters]


  #file.presence.subset <- as.matrix(file.presence.subset)


  ground_truth <- as.data.frame(matrix(nrow = nrow(file.presence.subset),
                                       ncol = ncol(file.presence.subset)))
  rownames(ground_truth) <- rownames(file.presence.subset)
  colnames(ground_truth) <- colnames(file.presence.subset)

  ground_truth[file.presence.subset == "Absent"] <- 0
  ground_truth[file.presence.subset == "Present"] <- 1
  ground_truth[file.presence.subset == "Uncertain"] <- 0.6

  file.presence.subset <- ground_truth

  for (col in 1:ncol(ground_truth)) {
    ground_truth[,col] <- FALSE
    ground_truth[file.presence.subset[,col] == 1 & rowMeans(file.presence.subset[,-col,drop = FALSE]) < 0.555  ,col] <- TRUE
    }

  ground_truth$genes <- rownames(ground_truth)
  ground_truth <- pivot_longer(ground_truth,
                               cols = 1:(ncol(ground_truth)-1),
                               names_to = "clusters")
  ground_truth$data_set <- subset.datasets_csv[ind,1]
  ground_truth$set_number <- ind
  ground_truth_tot <- rbind(ground_truth_tot, ground_truth)

}
ground_truth_tot <- ground_truth_tot[2:nrow(ground_truth_tot),]

head(ground_truth_tot)
# A tibble: 6 × 5
genes clusters value data_set set_number
<chr> <chr> <lgl> <chr> <int>
1 Neil2 E13.5-510 FALSE 5_Clusters_uneven 1
2 Neil2 E15.0-437 FALSE 5_Clusters_uneven 1
3 Neil2 E15.0-510 FALSE 5_Clusters_uneven 1
4 Neil2 E13.5-432 FALSE 5_Clusters_uneven 1
5 Neil2 E13.5-437 FALSE 5_Clusters_uneven 1
6 Lamc1 E13.5-510 FALSE 5_Clusters_uneven 1length(unique(ground_truth_tot$genes)) [1] 14695sum(ground_truth_tot$value)[1] 1862ROC for COTAN
onlyPositive.pVal.Cotan_tot <- NA

for (ind in 1:dim(subset.datasets_csv)[1]) {
  #print(ind)
  file.code <- paste0(subset.datasets_csv$Group[ind],"_",
                      subset.datasets_csv$Collection[ind])
  dataset <- readRDS(file = file.path(dataSetDir,paste0(file.code,".RDS")))
  deaCOTAN <- getClusterizationData(dataset,clName = "mergedClusters")[[2]]
  pvalCOTAN <- pValueFromDEA(deaCOTAN,
              numCells = getNumCells(dataset),adjustmentMethod = "none")

  clusterization <- getClusterizationData(dataset, clName = "mergedClusters")[[1]]
  cl.names <- NA

  for (cl.val in  unique(clusterization)) {
    #print(cl.val)
    cl.names <- c(cl.names,
                  str_split(names(clusterization[clusterization == cl.val])[1],
                            pattern = "_",simplify = T)[1])
    cl.names <- cl.names[!is.na(cl.names)]
  }
  colnames(deaCOTAN) <- cl.names
  colnames(pvalCOTAN) <- cl.names

  clusters <- str_split(datasets_csv$Collection[ind],pattern = "_[+]_",simplify = T)

  onlyPositive.pVal.Cotan <- pvalCOTAN

    for (cl in cl.names) {
    print(cl)
    #temp.DEA.CotanSign <- deaCOTAN[rownames(pvalCOTAN[pvalCOTAN[,cl] < 0.05,]) ,]
    onlyPositive.pVal.Cotan[rownames(deaCOTAN[deaCOTAN[,cl] < 0,]),cl] <-  1 #onlyPositive.pVal.Cotan[rownames(deaCOTAN[deaCOTAN[,cl] < 0,]),cl]+1
    }

    onlyPositive.pVal.Cotan$genes <- rownames(onlyPositive.pVal.Cotan)
    onlyPositive.pVal.Cotan <- pivot_longer(onlyPositive.pVal.Cotan,
                                            values_to = "p_values",
                               cols = 1:(ncol(onlyPositive.pVal.Cotan)-1),
                               names_to = "clusters")
  onlyPositive.pVal.Cotan$data_set <- subset.datasets_csv[ind,1]
  onlyPositive.pVal.Cotan$set_number <- ind
  onlyPositive.pVal.Cotan_tot <- rbind(onlyPositive.pVal.Cotan_tot, onlyPositive.pVal.Cotan)

  }
[1] "E13.5-432"
[1] "E15.0-510"
[1] "E13.5-437"
[1] "E15.0-437"
[1] "E13.5-510"
[1] "E13.5-434"
[1] "E15.0-428"
[1] "E13.5-184"
[1] "E15.0-434"
[1] "E17.5-505"
[1] "E15.0-432"
[1] "E13.5-432"
[1] "E15.0-509"
[1] "E15.0-508"
[1] "E13.5-187"onlyPositive.pVal.Cotan_tot <- onlyPositive.pVal.Cotan_tot[2:nrow(onlyPositive.pVal.Cotan_tot),]
onlyPositive.pVal.Cotan_tot <- merge.data.frame(onlyPositive.pVal.Cotan_tot,
ground_truth_tot,by = c("genes","clusters","data_set","set_number"),all.x = T,all.y = F)
# Convert TRUE/FALSE to 1/0
onlyPositive.pVal.Cotan_tot$value <- as.numeric(onlyPositive.pVal.Cotan_tot$value)
# Compute the ROC curve - note that we invert the p-values with 1 - p_values
roc_resultCOTAN <- roc(onlyPositive.pVal.Cotan_tot$value, 1 - onlyPositive.pVal.Cotan_tot$p_values)
# Plot the ROC curve
#plot(roc_resultCOTAN)ROC for Seurat
deaSeurat_tot <- NA

for (ind in 1:dim(subset.datasets_csv)[1]) {
  #print(ind)
  file.code <- paste0(subset.datasets_csv$Group[ind],"_",subset.datasets_csv$Collection[ind])

  dataset <- readRDS(file = file.path(dataSetDir,paste0(file.code,".RDS")))

  clusterization <- getClusterizationData(dataset, clName = "mergedClusters")[[1]]

  deaSeurat <- read.csv(file.path(dirOut,paste0(file.code,"Seurat_DEA_genes.csv")), row.names = 1)

  cl.names <- NA

  for (cl.val in  unique(clusterization)) {
    #print(cl.val)
    cl.name <- str_split(names(clusterization[clusterization == cl.val])[1],
                            pattern = "_",simplify = T)[1]
    cl.names <- c(cl.names,cl.name)
    cl.names <- cl.names[!is.na(cl.names)]

    deaSeurat[deaSeurat$cluster == cl.val,]$cluster <- cl.name

  }

  clusters <- str_split(datasets_csv$Collection[ind],pattern = "_[+]_",simplify = T)

  colnames(deaSeurat) <- str_replace(colnames(deaSeurat),
                                     pattern = "cluster",
                                     replacement = "clusters")
  colnames(deaSeurat) <- str_replace(colnames(deaSeurat),
                                     pattern = "gene",
                                     replacement = "genes")

  deaSeurat$data_set <- subset.datasets_csv[ind,1]
  deaSeurat$set_number <- ind
  deaSeurat_tot <- rbind(deaSeurat_tot, deaSeurat)


  }
 deaSeurat_tot <-  deaSeurat_tot[2:nrow(deaSeurat_tot),]

 deaSeurat_tot <- merge.data.frame(deaSeurat_tot,
                                   ground_truth_tot,
                                   by = c("genes","clusters","data_set","set_number"),
                                   all.x = T,all.y = F)

# Convert TRUE/FALSE to 1/0
deaSeurat_tot$value <- as.numeric(deaSeurat_tot$value)

# Compute the ROC curve - note that we invert the p-values with 1 - p_values
roc_resultSeurat <- roc(deaSeurat_tot$value, 1 - deaSeurat_tot$p_val)

# Plot the ROC curve
#plot(roc_resultSeurat)
ROC for Seurat scTransform
deaSeurat_tot <- NA

for (ind in 1:dim(subset.datasets_csv)[1]) {
  #print(ind)
  file.code <- paste0(subset.datasets_csv$Group[ind],"_",subset.datasets_csv$Collection[ind])

  dataset <- readRDS(file = file.path(dataSetDir,paste0(file.code,".RDS")))

  clusterization <- getClusterizationData(dataset, clName = "mergedClusters")[[1]]

  deaSeurat <- read.csv(file.path(dirOut,paste0(file.code,"Seurat_DEA_ScTransform_genes.csv")), row.names = 1)

  cl.names <- NA

  for (cl.val in  unique(clusterization)) {
    #print(cl.val)
    cl.name <- str_split(names(clusterization[clusterization == cl.val])[1],
                            pattern = "_",simplify = T)[1]
    cl.names <- c(cl.names,cl.name)
    cl.names <- cl.names[!is.na(cl.names)]

    deaSeurat[deaSeurat$cluster == cl.val,]$cluster <- cl.name

  }

  clusters <- str_split(datasets_csv$Collection[ind],pattern = "_[+]_",simplify = T)

  colnames(deaSeurat) <- str_replace(colnames(deaSeurat),
                                     pattern = "cluster",
                                     replacement = "clusters")
  colnames(deaSeurat) <- str_replace(colnames(deaSeurat),
                                     pattern = "gene",
                                     replacement = "genes")

  deaSeurat$data_set <- subset.datasets_csv[ind,1]
  deaSeurat$set_number <- ind
  deaSeurat_tot <- rbind(deaSeurat_tot, deaSeurat)


  }
 deaSeurat_tot <-  deaSeurat_tot[2:nrow(deaSeurat_tot),]

 deaSeurat_tot <- merge.data.frame(deaSeurat_tot,
                                   ground_truth_tot,
                                   by = c("genes","clusters","data_set","set_number"),
                                   all.x = T,all.y = F)

# Convert TRUE/FALSE to 1/0
deaSeurat_tot$value <- as.numeric(deaSeurat_tot$value)

# Compute the ROC curve - note that we invert the p-values with 1 - p_values
roc_resultSeurat_scTr <- roc(deaSeurat_tot$value, 1 - deaSeurat_tot$p_val)
ROC for Seurat Bimod
deaSeurat_tot <- NA

for (ind in 1:dim(subset.datasets_csv)[1]) {
  #print(ind)
  file.code <- paste0(subset.datasets_csv$Group[ind],"_",subset.datasets_csv$Collection[ind])

  dataset <- readRDS(file = file.path(dataSetDir,paste0(file.code,".RDS")))

  clusterization <- getClusterizationData(dataset, clName = "mergedClusters")[[1]]

  deaSeurat <- read.csv(file.path(dirOut,paste0(file.code,"Seurat_DEA_Bimod_genes.csv")), row.names = 1)

  cl.names <- NA

  for (cl.val in  unique(clusterization)) {
    #print(cl.val)
    cl.name <- str_split(names(clusterization[clusterization == cl.val])[1],
                            pattern = "_",simplify = T)[1]
    cl.names <- c(cl.names,cl.name)
    cl.names <- cl.names[!is.na(cl.names)]

    deaSeurat[deaSeurat$cluster == cl.val,]$cluster <- cl.name

  }

  clusters <- str_split(datasets_csv$Collection[ind],pattern = "_[+]_",simplify = T)

  colnames(deaSeurat) <- str_replace(colnames(deaSeurat),
                                     pattern = "cluster",
                                     replacement = "clusters")
  colnames(deaSeurat) <- str_replace(colnames(deaSeurat),
                                     pattern = "gene",
                                     replacement = "genes")

  deaSeurat$data_set <- subset.datasets_csv[ind,1]
  deaSeurat$set_number <- ind
  deaSeurat_tot <- rbind(deaSeurat_tot, deaSeurat)


  }
 deaSeurat_tot <-  deaSeurat_tot[2:nrow(deaSeurat_tot),]

 deaSeurat_tot <- merge.data.frame(deaSeurat_tot,
                                   ground_truth_tot,
                                   by = c("genes","clusters","data_set","set_number"),
                                   all.x = T,all.y = F)

# Convert TRUE/FALSE to 1/0
deaSeurat_tot$value <- as.numeric(deaSeurat_tot$value)

# Compute the ROC curve - note that we invert the p-values with 1 - p_values
roc_resultSeurat_Bimod <- roc(deaSeurat_tot$value, 1 - deaSeurat_tot$p_val)
ROC for Monocle
deaMonocle_tot <- NA
for (ind in 1:dim(subset.datasets_csv)[1]) {
  file.code <- paste0(subset.datasets_csv$Group[ind],"_",subset.datasets_csv$Collection[ind])
  dataset <- readRDS(file = file.path(dataSetDir,paste0(file.code,".RDS")))

  clusterization <- getClusterizationData(dataset, clName = "mergedClusters")[[1]]
  #print(file.code)

  deaMonocle <- read.csv(file.path(dirOut,paste0(file.code,"Monocle_DEA_genes.csv")),row.names = 1)

  cl.names <- NA

  for (cl.val in  unique(clusterization)) {
    #print(cl.val)
    cl.name <- str_split(names(clusterization[clusterization == cl.val])[1],
                            pattern = "_",simplify = T)[1]
    cl.names <- c(cl.names,cl.name)
    cl.names <- cl.names[!is.na(cl.names)]

    deaMonocle[deaMonocle$cell_group == cl.val,"cell_group"] <- cl.name

  }

  clusters <- str_split(datasets_csv$Collection[ind],pattern = "_[+]_",simplify = T)

  colnames(deaMonocle) <- str_replace(colnames(deaMonocle),
                                     pattern = "cell_group",
                                     replacement = "clusters")
  colnames(deaMonocle) <- str_replace(colnames(deaMonocle),
                                     pattern = "gene_id",
                                     replacement = "genes")

  deaMonocle$data_set <- subset.datasets_csv[ind,1]
  deaMonocle$set_number <- ind
  deaMonocle <- as.data.frame(deaMonocle)
  deaMonocle_tot <- rbind(deaMonocle_tot, deaMonocle)


  }
 deaMonocle_tot <-  deaMonocle_tot[2:nrow(deaMonocle_tot),]

 deaMonocle_tot <- merge.data.frame(deaMonocle_tot,
                                   ground_truth_tot,
                                   by = c("genes","clusters","data_set","set_number"),
                                   all.x = T,all.y = F)

# Convert TRUE/FALSE to 1/0
deaMonocle_tot$value <- as.numeric(deaMonocle_tot$value)

# Compute the ROC curve - note that we invert the p-values with 1 - p_values
roc_resultMonocle <- roc(deaMonocle_tot$value, 1 - deaMonocle_tot$marker_test_p_value)

# Plot the ROC curve
#plot(roc_resultMonocle)
ROC from ScamPy
deaScamPy_tot <- NA
for (ind in 1:dim(subset.datasets_csv)[1]) {
  file.code <- paste0(subset.datasets_csv$Group[ind],"_",subset.datasets_csv$Collection[ind])
  dataset <- readRDS(file = file.path(dataSetDir,paste0(file.code,".RDS")))

  clusterization <- getClusterizationData(dataset, clName = "mergedClusters")[[1]]
  #print(file.code)

  deaScamPy <- read.csv(file.path(dirOut,paste0(file.code,"ScanPy_DEA_genes.csv")),
                        row.names = 1)

  cl.names <- NA

  for (cl.val in  unique(clusterization)) {
    #print(cl.val)
    cl.name <- str_split(names(clusterization[clusterization == cl.val])[1],
                            pattern = "_",simplify = T)[1]
    cl.names <- c(cl.names,cl.name)
    cl.names <- cl.names[!is.na(cl.names)]

    deaScamPy[deaScamPy$clusters == paste0("cl",cl.val),"clusters"] <- cl.name

  }

  clusters <- str_split(datasets_csv$Collection[ind],pattern = "_[+]_",simplify = T)


  deaScamPy$data_set <- subset.datasets_csv[ind,1]
  deaScamPy$set_number <- ind
  deaScamPy_tot <- rbind(deaScamPy_tot, deaScamPy)


  }
 deaScamPy_tot <-  deaScamPy_tot[2:nrow(deaScamPy_tot),]

 deaScamPy_tot <- merge.data.frame(deaScamPy_tot,
                                   ground_truth_tot,
                                   by = c("genes","clusters","data_set","set_number"),
                                   all.x = T,all.y = F)

# Convert TRUE/FALSE to 1/0
deaScamPy_tot$value <- as.numeric(deaScamPy_tot$value)

# Compute the ROC curve - note that we invert the p-values with 1 - p_values
roc_resultScamPy <- roc(deaScamPy_tot$value, 1 - deaScamPy_tot$pval)

# Plot the ROC curve
#plot(roc_resultScamPy)
Summary ROC for all methods
Five_Clusters <- ggroc(list(COTAN=roc_resultCOTAN, Seurat=roc_resultSeurat,                  Seurat_scTr = roc_resultSeurat_scTr, Seurat_Bimod = roc_resultSeurat_Bimod,
                 Monocle=roc_resultMonocle, ScamPy=roc_resultScamPy))


Five_Clusters_unevenPL <- Five_Clusters + xlab("FPR") + ylab("TPR")

Five_Clusters_unevenPL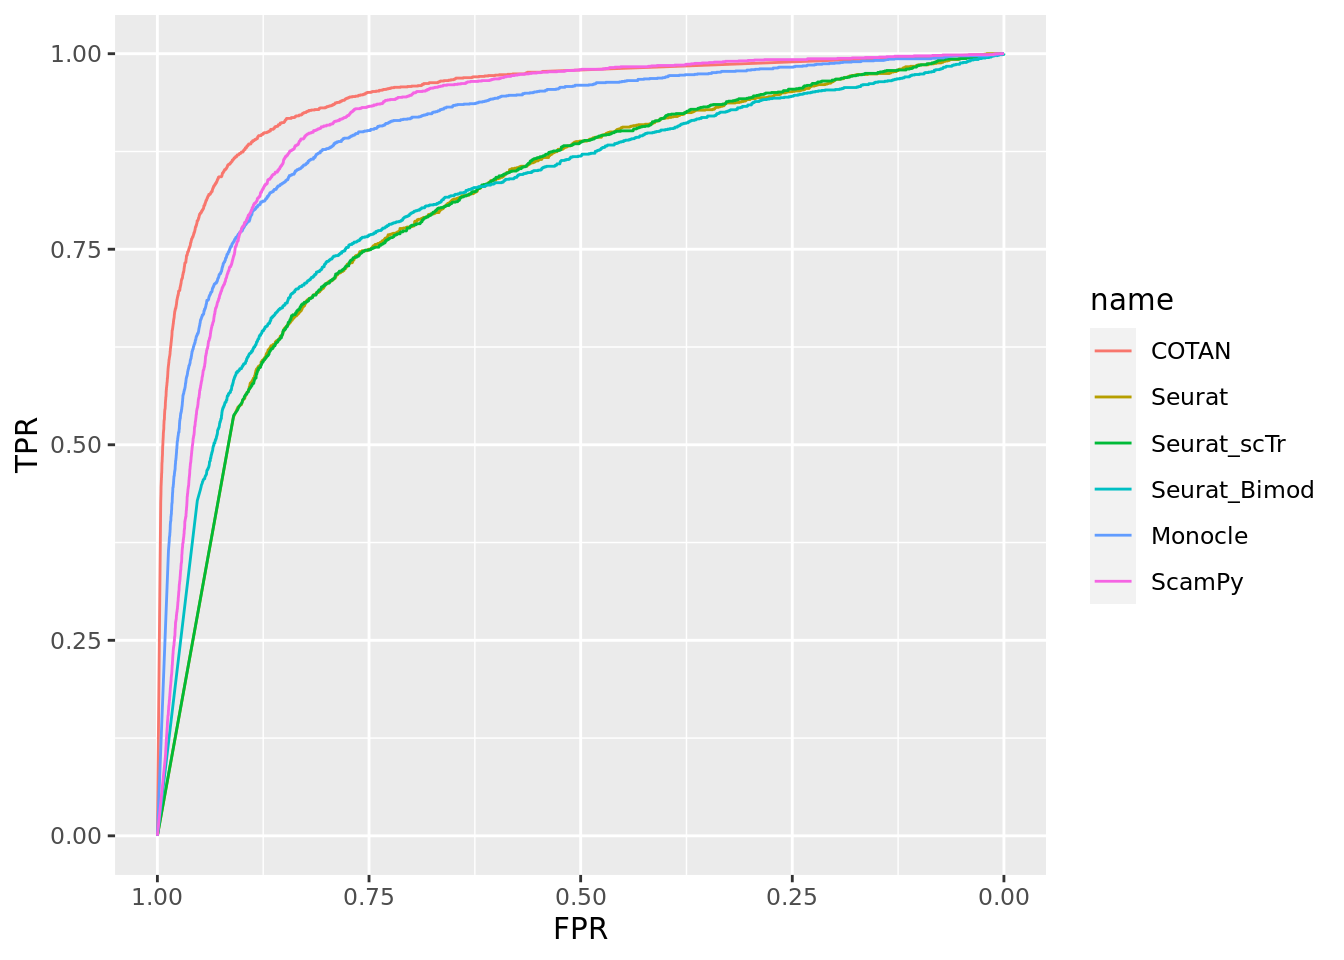
Global Summary
2 Clusters
ggarrange(TwoClusters_even_nearPL,Two_Clusters_even_mediumPL, Two_Clusters_even_farPL,Two_Clusters_uneven_nearPL, Two_Clusters_uneven_mediumPL,Two_Clusters_uneven_farPL,
          labels = c("Even_Near", "Even_Medium", "Even_Far", "Uneven_Near","Uneven_Medium","Uneven_Far"),
          ncol = 3, nrow = 2, common.legend = T, legend = "bottom")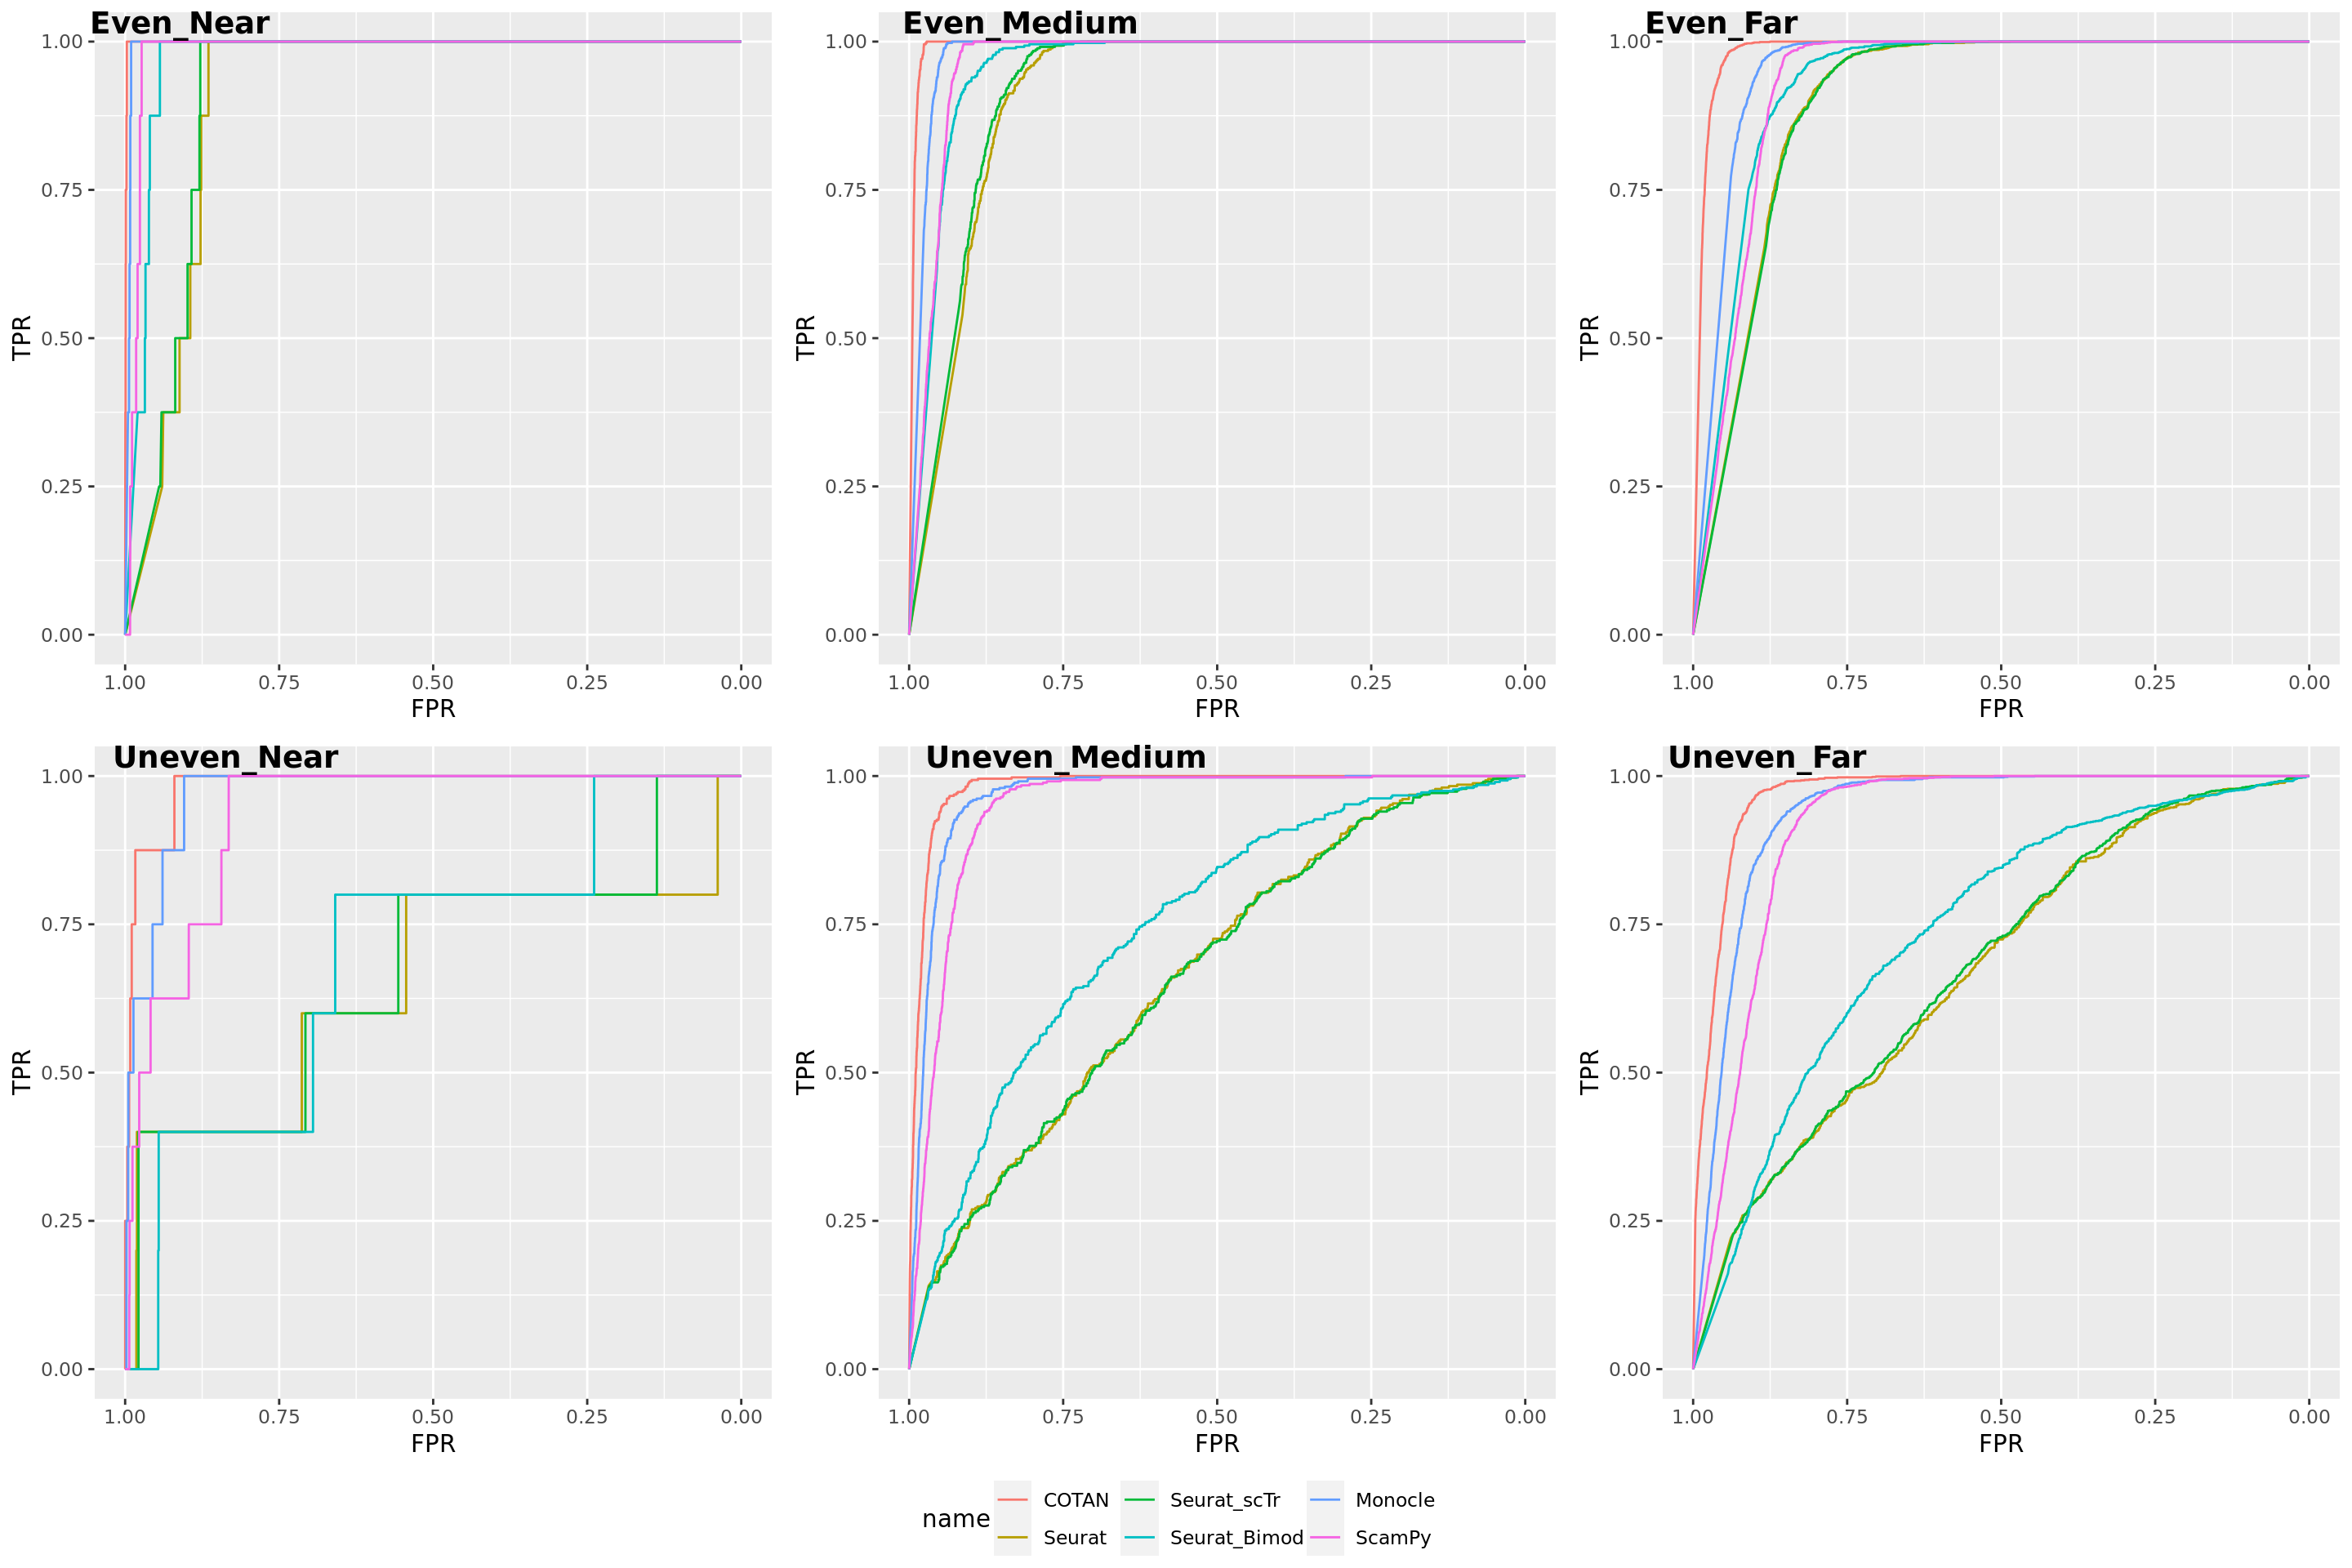
3 and 5 Clusters
ggarrange(Three_Clusters_evenPL,Three_Clusters_unevenPL, NULL, Five_Clusters_unevenPL,
          labels = c("3_Even", "3_Uneven", "", "5_Uneven"),
          ncol = 2, nrow = 2, common.legend = T, legend = "bottom")