library(COTAN)
library(ComplexHeatmap)
library(circlize)
library(dplyr)
library(Hmisc)
library(Seurat)
library(patchwork)
library(Rfast)
library(parallel)
library(doParallel)
library(HiClimR)
library(stringr)
library(fst)

options(parallelly.fork.enable = TRUE)

dataFile <- "Data/NewDataRevision/MouseBrainMorabito/MouseBrain_Morabito_GSE189033_CotanCleaned.RDS"
name <- str_split(dataFile,pattern = "/",simplify = T)[4]
name <- str_remove(name,pattern = "CotanCleaned.RDS")

project = name

setLoggingLevel(1)
outDir <- "CoexData/"
setLoggingFile(paste0(outDir, "Logs/",name,".log"))

obj <- readRDS(dataFile)
file_code = nameGene Correlation Analysis for Mouse Brain Morabito GSE189033
Prologue
source("src/Functions.R")To compare the ability of COTAN to asses the real correlation between genes we define some pools of genes:
- Constitutive genes
- Neural progenitor genes
- Pan neuronal genes
- Some layer marker genes
genesList <- list(
  "NPGs"=
    c("Nes", "Vim", "Sox2", "Sox1", "Notch1", "Hes1", "Hes5", "Pax6"),
  "PNGs"=
    c("Map2", "Tubb3", "Neurod1", "Nefm", "Nefl", "Dcx", "Tbr1"),
  "hk"=
    c("Calm1", "Cox6b1", "Ppia", "Rpl18", "Cox7c", "Erh", "H3f3a",
      "Taf1", "Taf2", "Gapdh", "Actb", "Golph3", "Zfr", "Sub1",
      "Tars", "Amacr"),
  "layers" =
    c("Reln","Lhx5","Cux1","Satb2","Tle1","Mef2c","Rorb","Sox5","Bcl11b","Fezf2","Foxp2","Ntf3","Rasgrf2","Pvrl3", "Cux2","Slc17a6", "Sema3c","Thsd7a", "Sulf2", "Kcnk2","Grik3", "Etv1", "Tle4", "Tmem200a", "Glra2", "Etv1","Htr1f", "Sulf1","Rxfp1", "Syt6")
  # From https://www.science.org/doi/10.1126/science.aam8999
)
COTAN
genesFromListExpressed <- unlist(genesList)[unlist(genesList) %in% getGenes(obj)]
int.genes <-getGenes(obj)
coexMat.big <- getGenesCoex(obj)[genesFromListExpressed,genesFromListExpressed]
coexMat <- getGenesCoex(obj)[c(genesList$NPGs,genesList$hk,genesList$PNGs),c(genesList$NPGs,genesList$hk,genesList$PNGs)]
f1 = colorRamp2(seq(-0.5,0.5, length = 3), c("#DC0000B2", "white","#3C5488B2" ))
split.genes <- base::factor(c(rep("NPGs",length(genesList[["NPGs"]])),
rep("HK",length(genesList[["hk"]])),
rep("PNGs",length(genesList[["PNGs"]]))
),
levels = c("NPGs","HK","PNGs"))
lgd = Legend(col_fun = f1, title = "COTAN coex")
htmp <- Heatmap(as.matrix(coexMat),
#width = ncol(coexMat)*unit(2.5, "mm"),
height = nrow(coexMat)*unit(3, "mm"),
cluster_rows = FALSE,
cluster_columns = FALSE,
col = f1,
row_names_side = "left",
row_names_gp = gpar(fontsize = 11),
column_names_gp = gpar(fontsize = 11),
column_split = split.genes,
row_split = split.genes,
cluster_row_slices = FALSE,
cluster_column_slices = FALSE,
heatmap_legend_param = list(
title = "COTAN coex", at = c(-0.5, 0, 0.5),
direction = "horizontal",
labels = c("-0.5", "0", "0.5")
)
)
draw(htmp, heatmap_legend_side="right")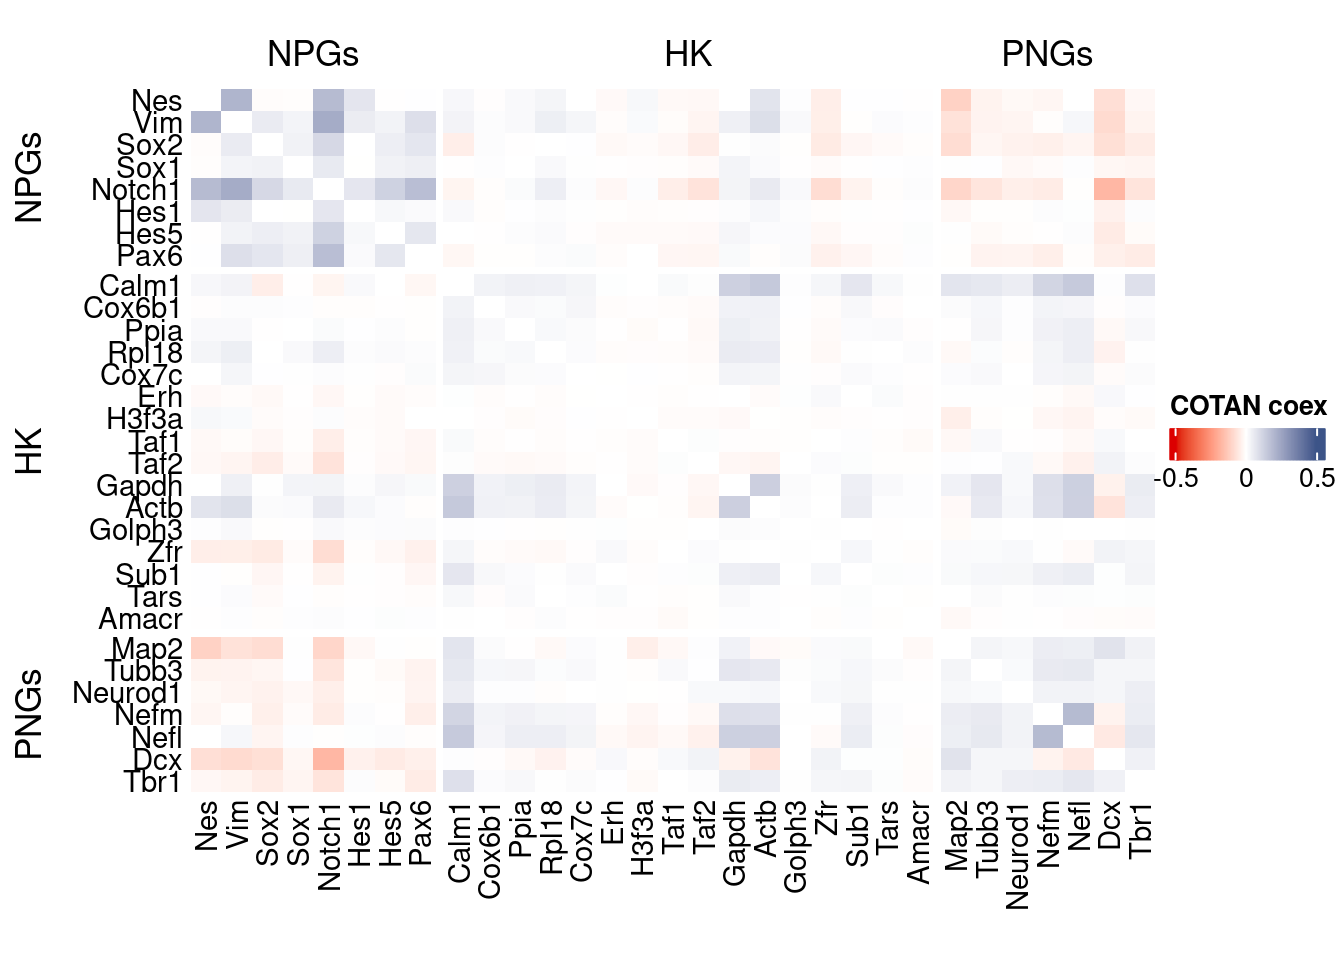
GDI_DF <- calculateGDI(obj)
GDI_DF$geneType <- NA
for (cat in names(genesList)) {
  GDI_DF[rownames(GDI_DF) %in% genesList[[cat]],]$geneType <- cat
}

GDI_DF$GDI_centered <- scale(GDI_DF$GDI,center = T,scale = T)

GDI_DF[genesFromListExpressed,]
sum.raw.norm GDI exp.cells geneType GDI_centered
Nes 7.806169 5.478041 2.2424845 NPGs NaN
Vim 8.137923 5.560237 3.4367877 NPGs NaN
Sox2 8.527893 5.163632 6.2423286 NPGs NaN
Sox1 7.325566 3.532271 2.3652269 NPGs NaN
Notch1 9.434706 6.540009 10.2636040 NPGs NaN
Hes1 6.979030 3.227879 1.8762055 NPGs NaN
Hes5 6.901275 4.208646 1.3813393 NPGs NaN
Pax6 8.250718 5.069675 4.3933992 NPGs NaN
Map2 12.443839 5.373626 88.1914002 PNGs NaN
Tubb3 9.053336 3.898603 14.3024139 PNGs NaN
Neurod1 7.397088 3.603543 3.1581819 PNGs NaN
Nefm 10.218169 4.235200 26.2551873 PNGs NaN
Nefl 9.889988 4.541443 22.4638105 PNGs NaN
Dcx 10.221746 5.465343 30.0251330 PNGs NaN
Tbr1 8.651506 4.573905 9.4336314 PNGs NaN
Calm1 11.662131 4.692619 64.6462875 hk NaN
Cox6b1 8.252913 2.354772 6.8462992 hk NaN
Ppia 8.532714 2.743132 8.5510550 hk NaN
Rpl18 7.668579 3.193186 3.5887545 hk NaN
Cox7c 8.090773 2.196201 5.6870653 hk NaN
Erh 7.732014 2.527985 4.3524850 hk NaN
H3f3a 8.881898 2.372332 11.3897169 hk NaN
Taf1 10.056592 2.958205 32.0123911 hk NaN
Taf2 9.611177 3.691041 22.6820192 hk NaN
Gapdh 9.833392 4.286121 24.2406531 hk NaN
Actb 10.799727 4.439722 44.4015820 hk NaN
Golph3 9.004261 2.088114 13.1431800 hk NaN
Zfr 11.121145 4.085471 61.2172930 hk NaN
Sub1 9.093222 3.327946 14.4056734 hk NaN
Tars 7.979124 1.857273 5.1785610 hk NaN
Amacr 6.595524 1.518655 1.2644417 hk NaN
Reln 10.724511 4.376288 21.5344750 layers NaN
Lhx5 5.811603 3.020672 0.6059189 layers NaN
Cux1 11.414186 4.066436 61.3536735 layers NaN
Satb2 10.508814 5.821415 28.5405342 layers NaN
Tle1 10.237579 3.257836 31.9851150 layers NaN
Mef2c 11.846416 5.568291 64.3832681 layers NaN
Rorb 11.163294 5.293155 29.0626766 layers NaN
Sox5 11.790543 4.802783 53.0091375 layers NaN
Bcl11b 10.893682 5.432291 37.5591794 layers NaN
Fezf2 7.435736 3.143919 2.8639897 layers NaN
Foxp2 10.863263 4.528695 25.1037466 layers NaN
Ntf3 7.697780 3.793891 2.9282834 layers NaN
Rasgrf2 10.881787 5.452757 38.4924114 layers NaN
Cux2 11.248246 4.700379 42.3363922 layers NaN
Slc17a6 8.613709 4.209432 7.2281645 layers NaN
Sema3c 9.481742 4.596898 7.8905839 layers NaN
Thsd7a 11.309785 4.092990 42.5507043 layers NaN
Sulf2 10.354962 4.312943 25.2732480 layers NaN
Kcnk2 10.058750 4.278195 23.5412161 layers NaN
Grik3 11.400137 5.291972 40.4387554 layers NaN
Etv1 9.681396 3.251721 16.9248154 layers NaN
Tle4 10.643795 3.982461 37.5007306 layers NaN
Tmem200a 9.685830 4.953884 17.9652035 layers NaN
Glra2 8.655348 4.228060 7.3703899 layers NaN
Etv1.1 9.681396 3.251721 16.9248154 layers NaN
Htr1f 10.547660 5.297501 27.5975607 layers NaN
Sulf1 9.912606 3.649390 16.4202077 layers NaN
Rxfp1 8.633149 4.018018 5.3636488 layers NaN
Syt6 10.441294 5.207473 20.6421571 layers NaNGDIPlot(obj,GDIIn = GDI_DF, genes = genesList,GDIThreshold = 1.4)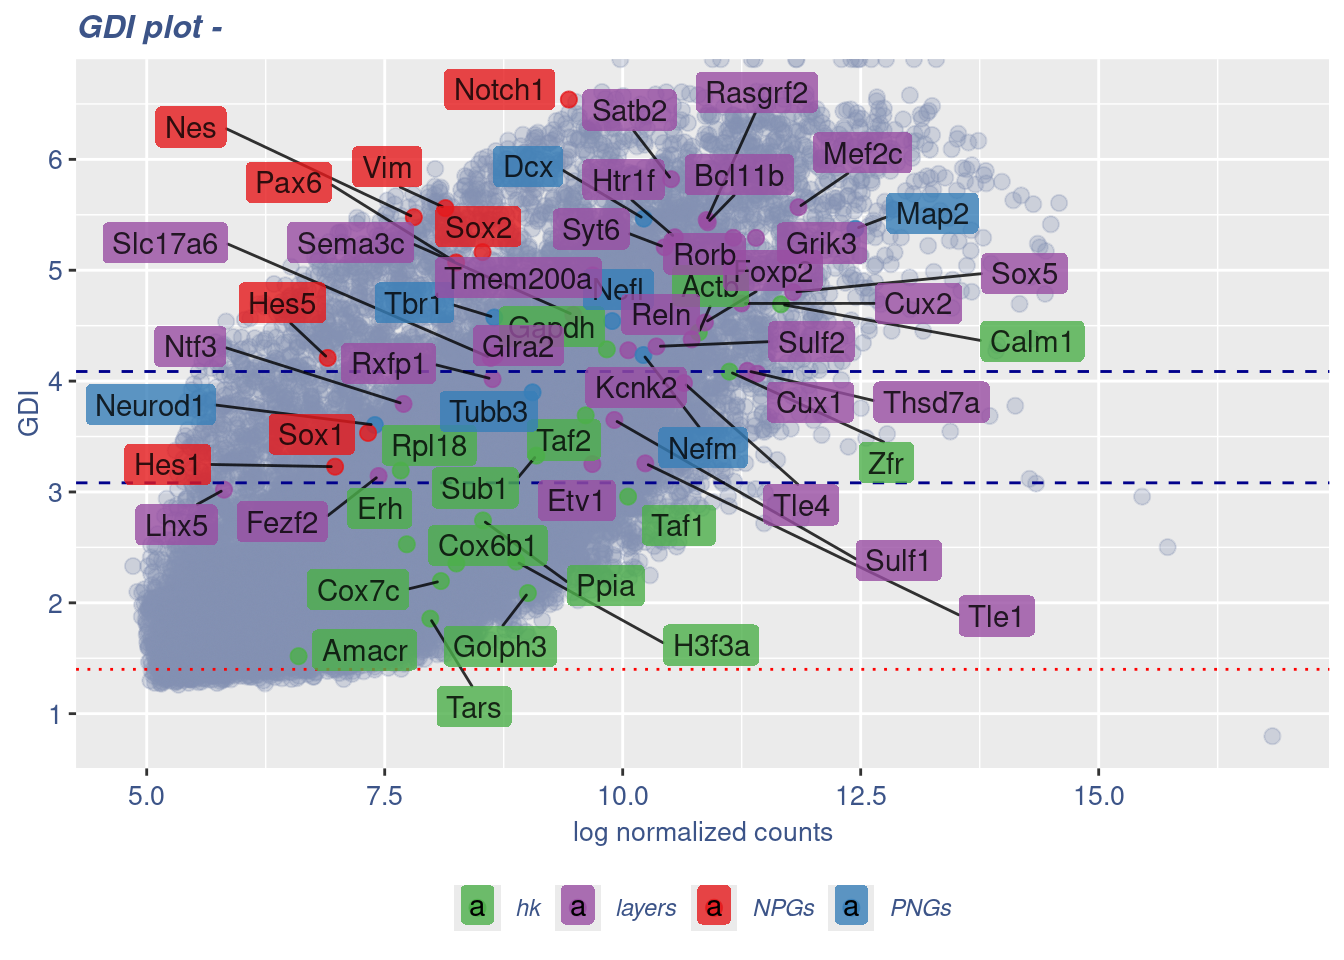
Seurat correlation
srat<- CreateSeuratObject(counts = getRawData(obj),
                          project = project,
                          min.cells = 3,
                          min.features = 200)
srat[["percent.mt"]] <- PercentageFeatureSet(srat, pattern = "^mt-")
srat <- NormalizeData(srat)
srat <- FindVariableFeatures(srat, selection.method = "vst", nfeatures = 2000)

# plot variable features with and without labels
plot1 <- VariableFeaturePlot(srat)

plot1$data$centered_variance <- scale(plot1$data$variance.standardized,
                                      center = T,scale = F)

write.csv(plot1$data,paste0("CoexData/",
                            "Variance_Seurat_genes",
                            getMetadataElement(obj,
                                               datasetTags()[["cond"]]),".csv"))

LabelPoints(plot = plot1, points = c(genesList$NPGs,genesList$PNGs,genesList$layers), repel = TRUE)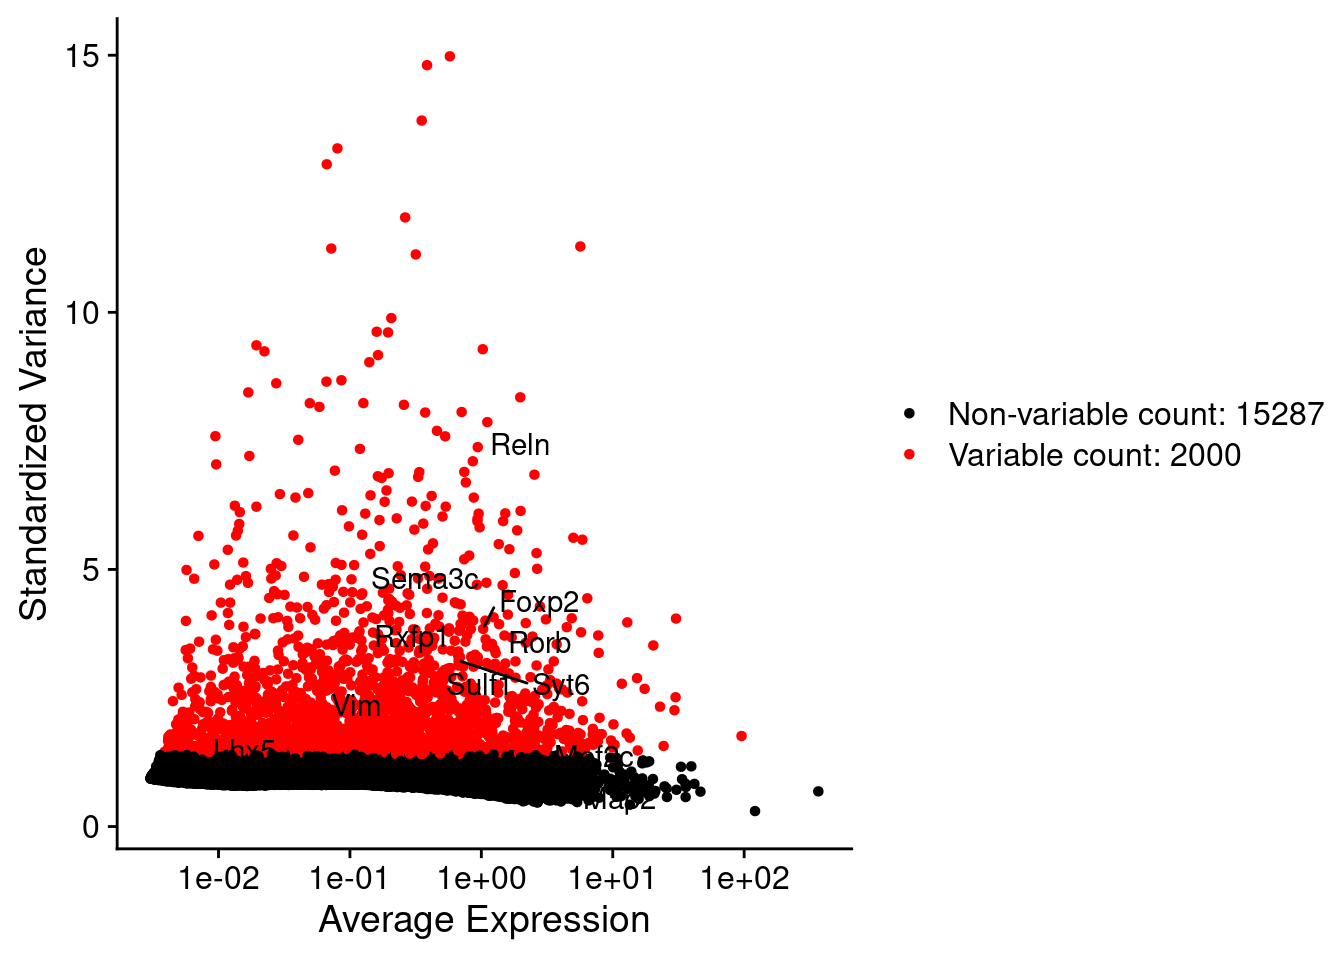
LabelPoints(plot = plot1, points = c(genesList$hk), repel = TRUE)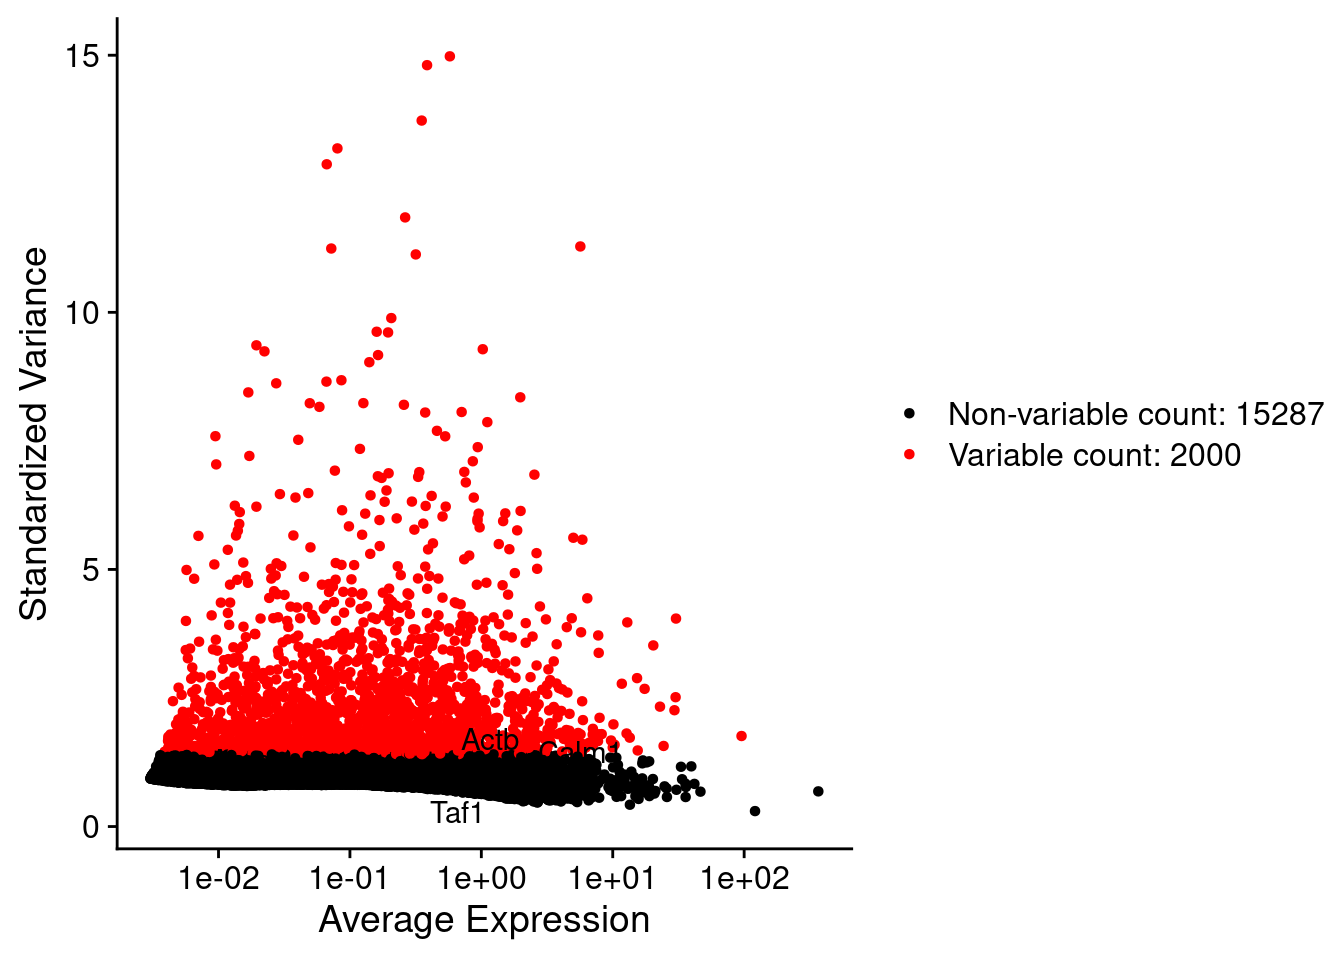
all.genes <- rownames(srat)
srat <- ScaleData(srat, features = all.genes)
seurat.data = GetAssayData(srat[["RNA"]],layer = "data")
corr.pval.list <- correlation_pvalues(data = seurat.data,
genesFromListExpressed,
n.cells = getNumCells(obj))
seurat.data.cor.big <- as.matrix(Matrix::forceSymmetric(corr.pval.list$data.cor, uplo = "U"))
htmp <- correlation_plot(seurat.data.cor.big,
genesList, title="Seurat corr")
p_values.fromSeurat <- corr.pval.list$p_values
seurat.data.cor.big <- corr.pval.list$data.cor
rm(corr.pval.list)
gc() used (Mb) gc trigger (Mb) max used (Mb)
Ncells 10200161 544.8 17751490 948.1 17751490 948.1
Vcells 1781216174 13589.7 3422348843 26110.5 3361031749 25642.7draw(htmp, heatmap_legend_side="right")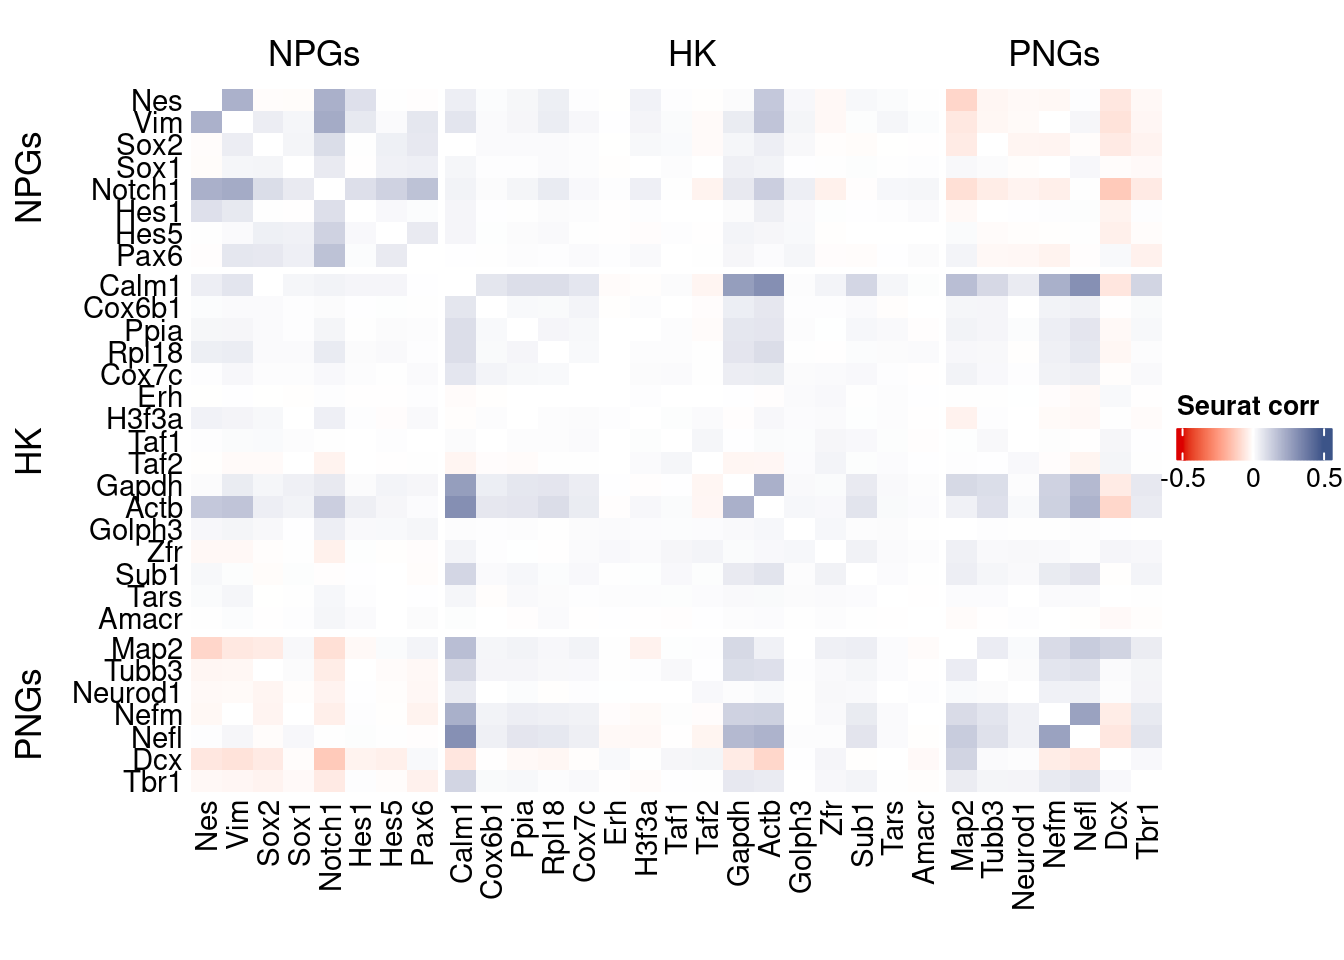
rm(seurat.data.cor.big)
rm(p_values.fromSeurat)
Seurat SC Transform
srat<- CreateSeuratObject(counts = getRawData(obj),
                          project = project,
                          min.cells = 3,
                          min.features = 200)
srat[["percent.mt"]] <- PercentageFeatureSet(srat, pattern = "^mt-")

srat <-  SCTransform(srat,
                     method = "glmGamPoi",
                     vars.to.regress = "percent.mt",
                     verbose = TRUE)

seurat.data <- GetAssayData(srat[["SCT"]],layer = "data")

#Remove genes with all zeros
seurat.data <-seurat.data[rowSums(seurat.data) > 0,]


corr.pval.list <- correlation_pvalues(seurat.data,
                                      genesFromListExpressed,
                                      n.cells = getNumCells(obj))


seurat.data.cor.big <- as.matrix(Matrix::forceSymmetric(corr.pval.list$data.cor, uplo = "U"))

htmp <- correlation_plot(seurat.data.cor.big,
                         genesList, title="Seurat corr SCT")


p_values.fromSeurat <- corr.pval.list$p_values
seurat.data.cor.big <- corr.pval.list$data.cor

rm(corr.pval.list)
gc()
used (Mb) gc trigger (Mb) max used (Mb)
Ncells 10529306 562.4 17751490 948.1 17751490 948.1
Vcells 1154714819 8809.8 3942686667 30080.4 4928310325 37600.1draw(htmp, heatmap_legend_side="right")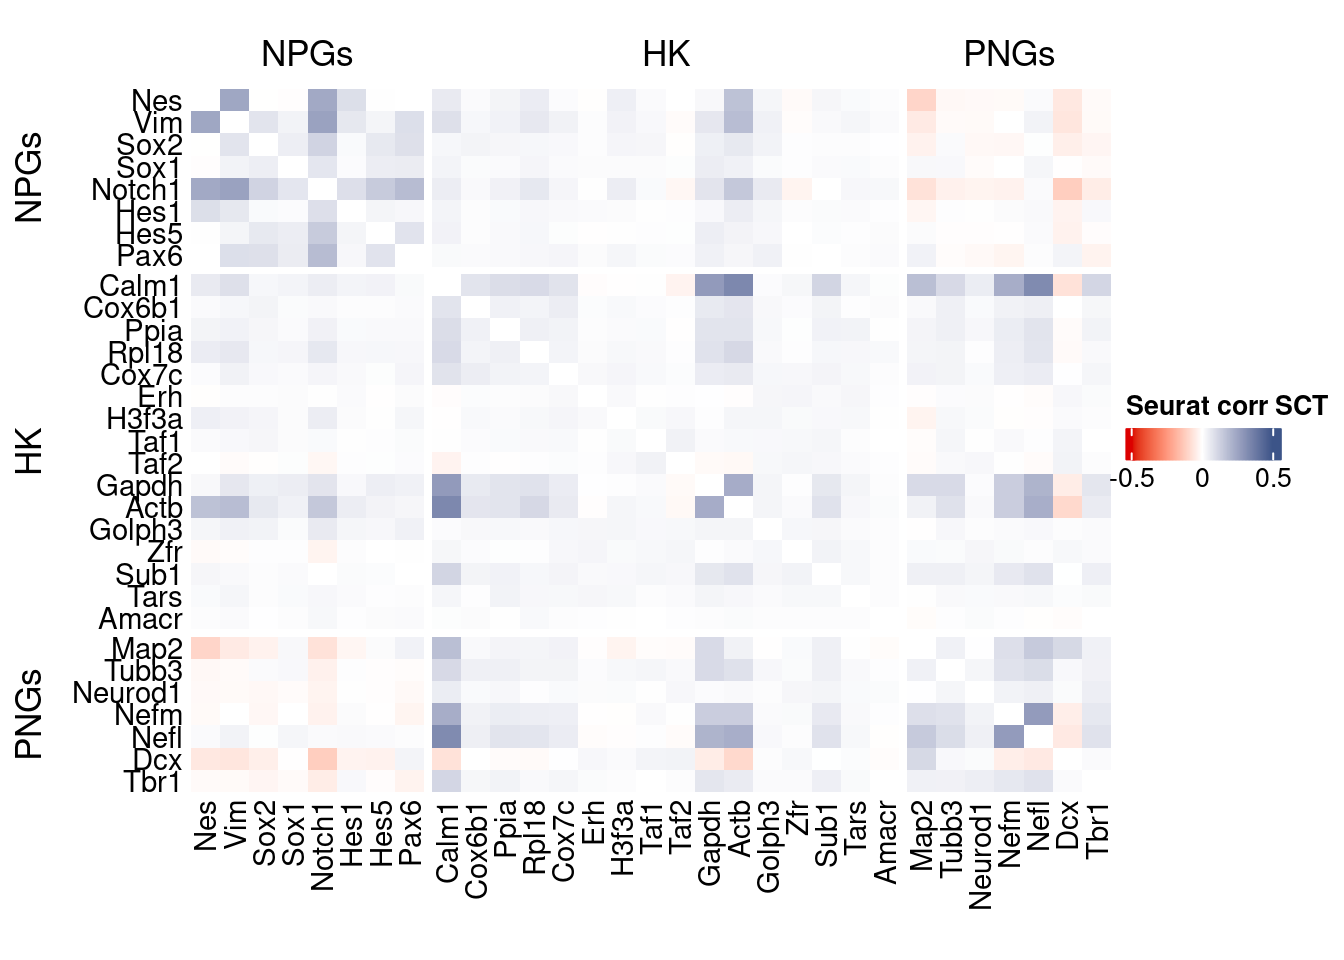
plot1 <- VariableFeaturePlot(srat)

plot1$data$centered_variance <- scale(plot1$data$residual_variance,
center = T,scale = F)write.csv(plot1$data,paste0("CoexData/",
"Variance_SeuratSCT_genes",
getMetadataElement(obj,
datasetTags()[["cond"]]),".csv"))
write_fst(as.data.frame(seurat.data.cor.big),path = paste0("CoexData/SeuratCorrSCT_",file_code,".fst"), compress = 100)
write_fst(as.data.frame(p_values.fromSeurat),path = paste0("CoexData/SeuratPValuesSCT_", file_code,".fst"))
write.csv(as.data.frame(p_values.fromSeurat),paste0("CoexData/SeuratPValuesSCT_", file_code,".csv"))
rm(seurat.data.cor.big)
rm(p_values.fromSeurat)Monocle
library(monocle3)cds <- new_cell_data_set(getRawData(obj),
cell_metadata = getMetadataCells(obj),
gene_metadata = getMetadataGenes(obj)
)
cds <- preprocess_cds(cds, num_dim = 100)
normalized_counts <- normalized_counts(cds)#Remove genes with all zeros
normalized_counts <- normalized_counts[rowSums(normalized_counts) > 0,]
corr.pval.list <- correlation_pvalues(normalized_counts,
genesFromListExpressed,
n.cells = getNumCells(obj))
rm(normalized_counts)
monocle.data.cor.big <- as.matrix(Matrix::forceSymmetric(corr.pval.list$data.cor, uplo = "U"))
htmp <- correlation_plot(data.cor.big = monocle.data.cor.big,
genesList,
title = "Monocle corr")
p_values.from.monocle <- corr.pval.list$p_values
monocle.data.cor.big <- corr.pval.list$data.cor
rm(corr.pval.list)
gc() used (Mb) gc trigger (Mb) max used (Mb)
Ncells 10715504 572.3 17751490 948.1 17751490 948.1
Vcells 1161953574 8865.1 3154149334 24064.3 4928310325 37600.1draw(htmp, heatmap_legend_side="right")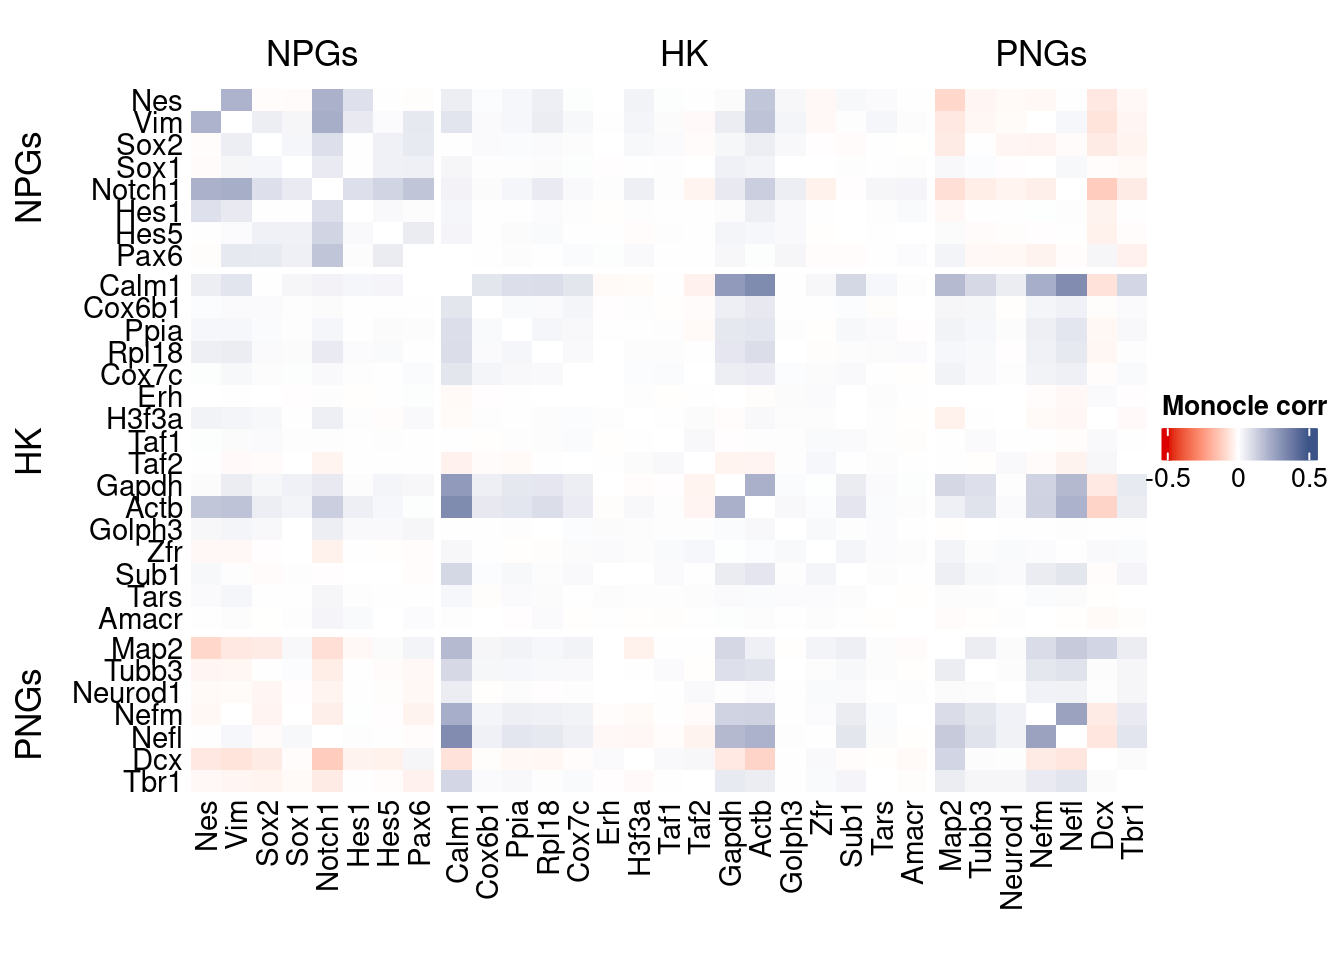
Cs-Core
devtools::load_all("../CS-CORE/")Convert to Seurat obj
sceObj <- convertToSingleCellExperiment(obj)

# Correct: assay=NULL (or omit), data=NULL (since no logcounts)
seuratObj <- as.Seurat(
  x       = sceObj,
  counts  = "counts",
  data    = NULL,
  assay   = NULL,      # IMPORTANT: do NOT set to "RNA" here
  project = "COTAN"
)

# as.Seurat(SCE) creates assay "originalexp" by default; rename it to RNA
seuratObj <- RenameAssays(seuratObj, originalexp = "RNA", verbose = FALSE)
DefaultAssay(seuratObj) <- "RNA"

# Optional: keep COTAN payload
seuratObj@misc$COTAN <- S4Vectors::metadata(sceObj)
Extract CS_CORE corr matrix
#seuratObj@assays$RNA@counts <- ceiling(seuratObj@assays$RNA@counts)
csCoreRes <- CSCORE(seuratObj, genes = genesFromListExpressed)
[INFO] IRLS converged after 2 iterations.
[INFO] Starting WLS for covariance at Wed Jan 21 11:17:28 2026
[INFO] 0.0565% co-expression estimates were greater than 1 and were set to 1.
[INFO] 0.0000% co-expression estimates were smaller than -1 and were set to -1.
[INFO] Finished WLS. Elapsed time: 4.2792 seconds.mat <- as.matrix(csCoreRes$est)
diag(mat) <- 0
split.genes <- base::factor(c(rep("NPGs",sum(genesList[["NPGs"]] %in% genesFromListExpressed)),
rep("HK",sum(genesList[["hk"]] %in% genesFromListExpressed)),
rep("PNGs",sum(genesList[["PNGs"]] %in% genesFromListExpressed))
),
levels = c("NPGs","HK","PNGs"))
f1 = colorRamp2(seq(-0.5,0.5, length = 3), c("#DC0000B2", "white","#3C5488B2" ))
htmp <- Heatmap(as.matrix(mat[c(genesList$NPGs,genesList$hk,genesList$PNGs),c(genesList$NPGs,genesList$hk,genesList$PNGs)]),
#width = ncol(coexMat)*unit(2.5, "mm"),
height = nrow(mat)*unit(3, "mm"),
cluster_rows = FALSE,
cluster_columns = FALSE,
col = f1,
row_names_side = "left",
row_names_gp = gpar(fontsize = 11),
column_names_gp = gpar(fontsize = 11),
column_split = split.genes,
row_split = split.genes,
cluster_row_slices = FALSE,
cluster_column_slices = FALSE,
heatmap_legend_param = list(
title = "CS-CORE", at = c(-0.5, 0, 0.5),
direction = "horizontal",
labels = c("-0.5", "0", "0.5")
)
)
draw(htmp, heatmap_legend_side="right")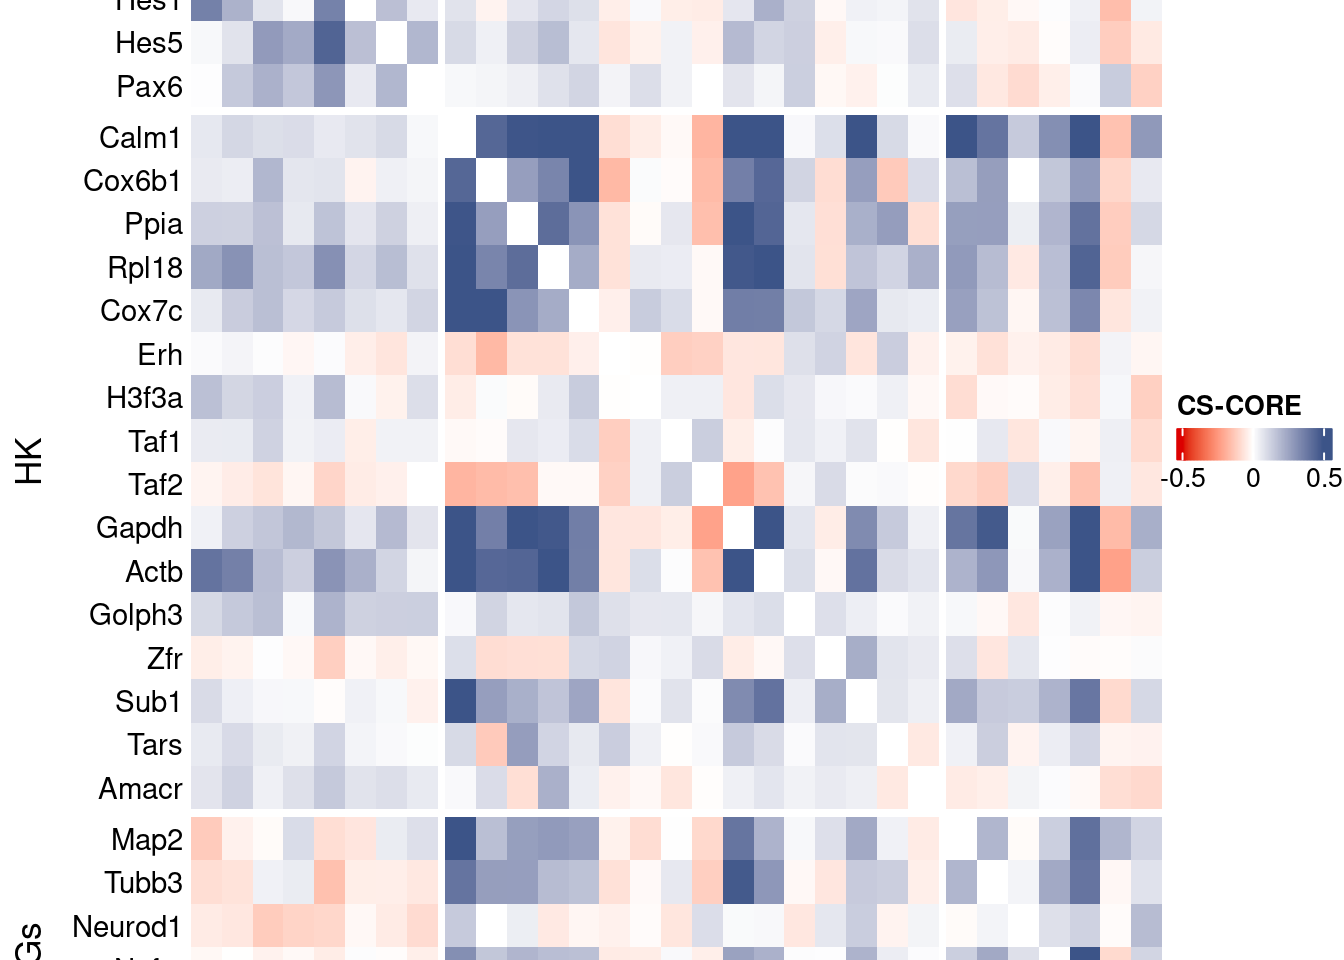
Save CS_CORE matrix
write_fst(as.data.frame(csCoreRes$est), path = paste0("CoexData/CS_CORECorr_", file_code,".fst"),compress = 100)
write_fst(as.data.frame(csCoreRes$p_value), path = paste0("CoexData/CS_COREPValues_", file_code,".fst"),compress = 100)
write.csv(as.data.frame(csCoreRes$p_value), paste0("CoexData/CS_COREPValues_", file_code,".csv"))
Baseline: Spearman on UMI counts
corr.pval.list <- correlation_pvaluesSpearman(data = getRawData(obj),
                                      genesFromListExpressed,
                                      n.cells = getNumCells(obj))

data.cor.big <- as.matrix(Matrix::forceSymmetric(corr.pval.list$data.cor, uplo = "U"))

htmp <- correlation_plot(data.cor.big,
                         genesList, title="UMI baseline S. corr")


p_values.fromSp.C <- corr.pval.list$p_values
data.cor.bigSp.C <- corr.pval.list$data.cor

rm(corr.pval.list)
gc()
used (Mb) gc trigger (Mb) max used (Mb)
Ncells 10851327 579.6 17751490 948.1 17751490 948.1
Vcells 1162483358 8869.1 3154149334 24064.3 4928310325 37600.1draw(htmp, heatmap_legend_side="right")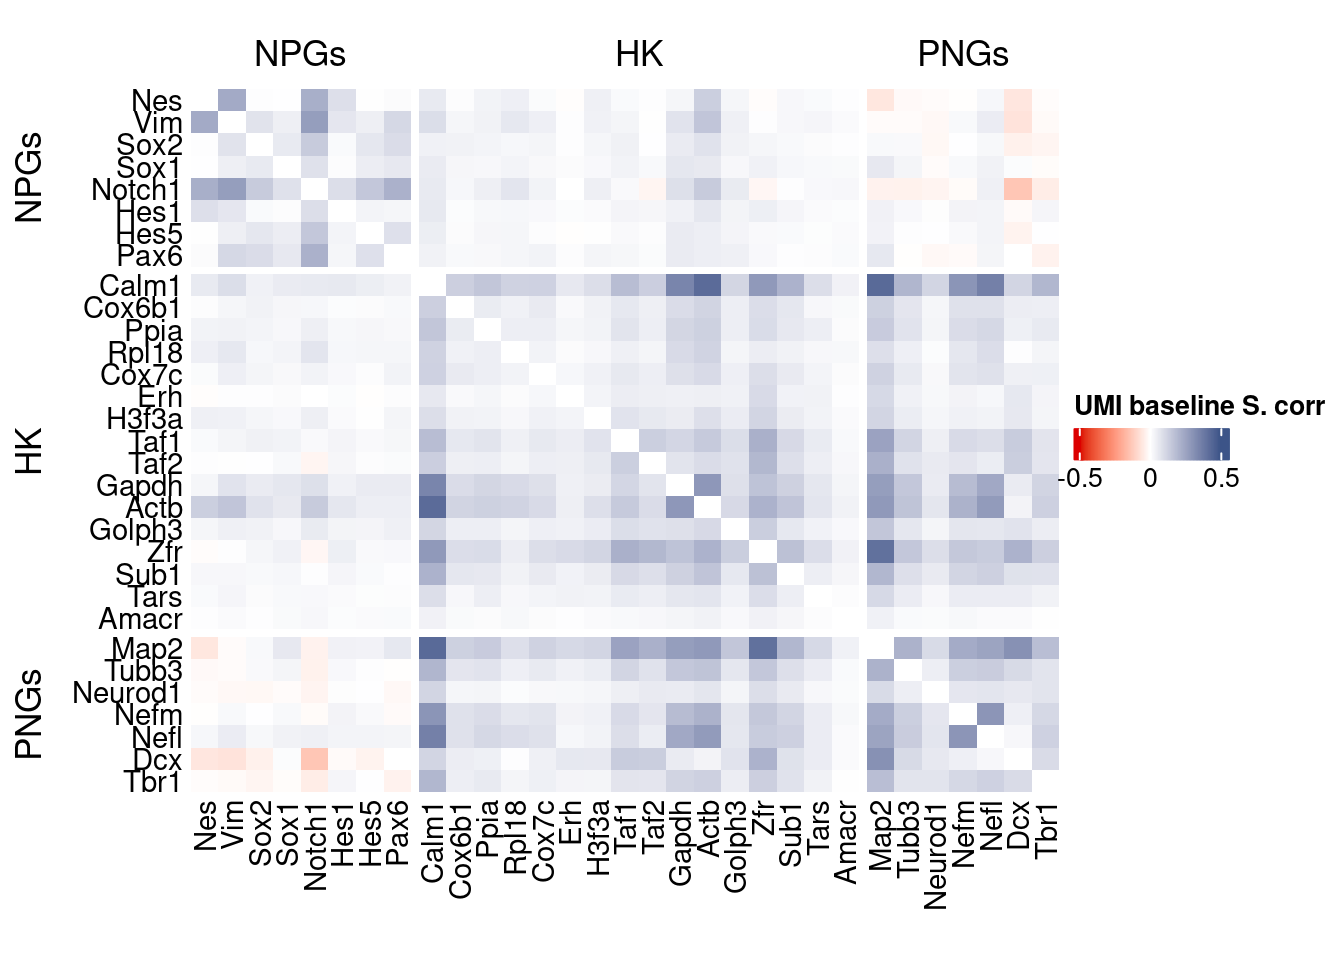
write.csv(as.data.frame(p_values.fromSp.C), paste0("CoexData/BaselineUMISpCorrPValues_", file_code,".csv"))Baseline: Pearson on binarized counts
corr.pval.list <- correlation_pvalues(data = getZeroOneProj(obj),
                                      genesFromListExpressed,
                                      n.cells = getNumCells(obj))

data.cor.big <- as.matrix(Matrix::forceSymmetric(corr.pval.list$data.cor, uplo = "U"))

htmp <- correlation_plot(data.cor.big,
                         genesList, title="Zero-one P. corr")


p_values.fromSp.C <- corr.pval.list$p_values
data.cor.bigSp.C <- corr.pval.list$data.cor

rm(corr.pval.list)
gc()
used (Mb) gc trigger (Mb) max used (Mb)
Ncells 10851454 579.6 17751490 948.1 17751490 948.1
Vcells 1162483617 8869.1 3154149334 24064.3 4928310325 37600.1draw(htmp, heatmap_legend_side="right")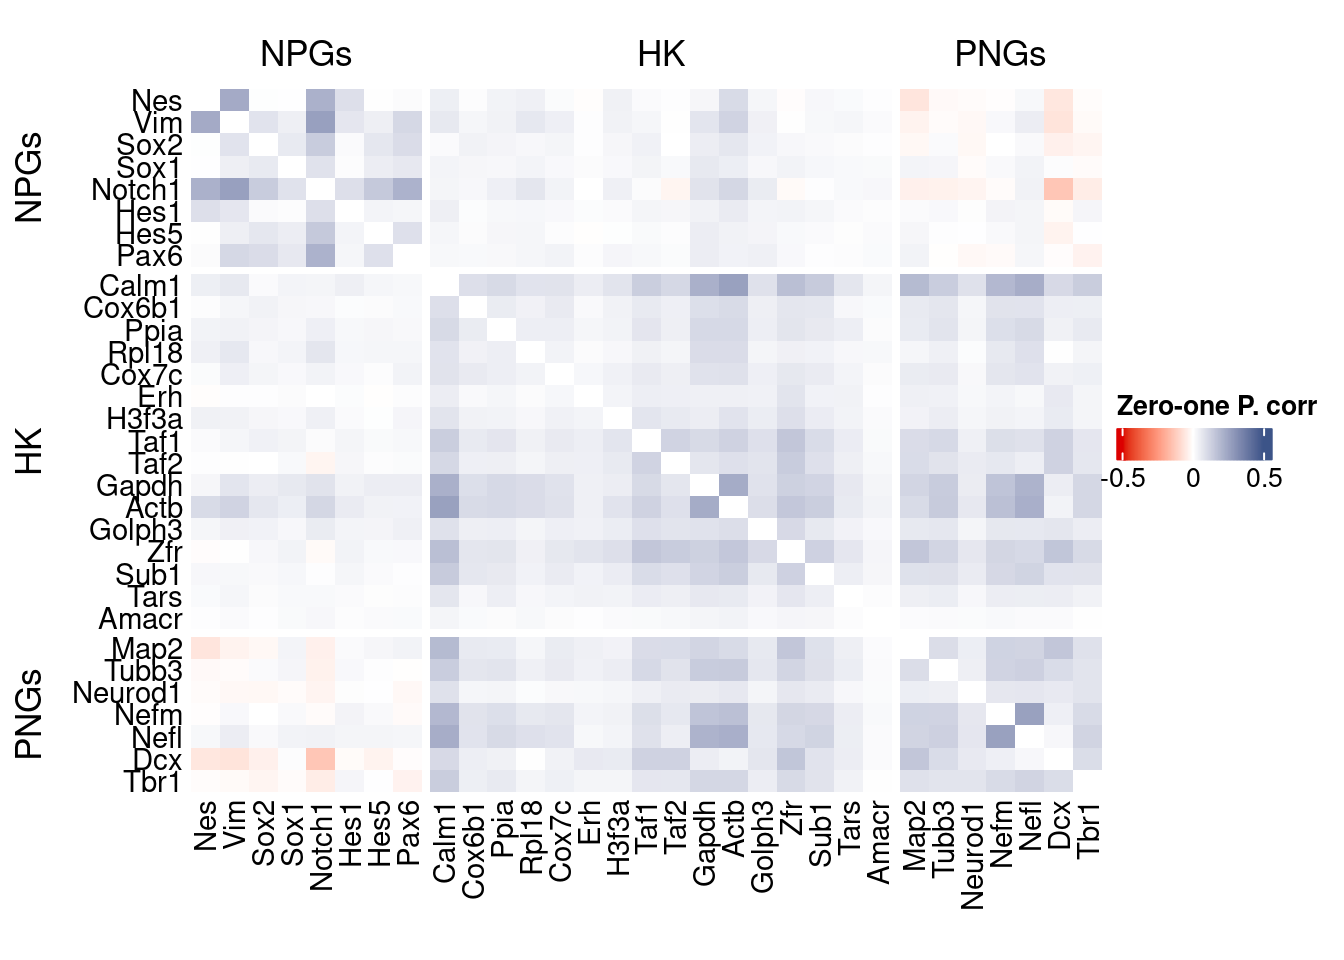
write.csv(as.data.frame(p_values.fromSp.C), paste0("CoexData/ZeroOnePCorrPValues_", file_code,".csv"))Sys.time()[1] "2026-01-21 11:19:06 CET"sessionInfo()R version 4.5.2 (2025-10-31)
Platform: x86_64-pc-linux-gnu
Running under: Ubuntu 22.04.5 LTS
Matrix products: default
BLAS: /usr/lib/x86_64-linux-gnu/blas/libblas.so.3.10.0
LAPACK: /usr/lib/x86_64-linux-gnu/lapack/liblapack.so.3.10.0 LAPACK version 3.10.0
locale:
[1] LC_CTYPE=C.UTF-8 LC_NUMERIC=C LC_TIME=C.UTF-8
[4] LC_COLLATE=C.UTF-8 LC_MONETARY=C.UTF-8 LC_MESSAGES=C.UTF-8
[7] LC_PAPER=C.UTF-8 LC_NAME=C LC_ADDRESS=C
[10] LC_TELEPHONE=C LC_MEASUREMENT=C.UTF-8 LC_IDENTIFICATION=C
time zone: Europe/Rome
tzcode source: system (glibc)
attached base packages:
[1] stats4 parallel grid stats graphics grDevices utils
[8] datasets methods base
other attached packages:
[1] CSCORE_1.0.2 testthat_3.3.2
[3] monocle3_1.3.7 SingleCellExperiment_1.32.0
[5] SummarizedExperiment_1.38.1 GenomicRanges_1.62.1
[7] Seqinfo_1.0.0 IRanges_2.44.0
[9] S4Vectors_0.48.0 MatrixGenerics_1.22.0
[11] matrixStats_1.5.0 Biobase_2.70.0
[13] BiocGenerics_0.56.0 generics_0.1.3
[15] fstcore_0.10.0 fst_0.9.8
[17] stringr_1.6.0 HiClimR_2.2.1
[19] doParallel_1.0.17 iterators_1.0.14
[21] foreach_1.5.2 Rfast_2.1.5.1
[23] RcppParallel_5.1.10 zigg_0.0.2
[25] Rcpp_1.1.0 patchwork_1.3.2
[27] Seurat_5.4.0 SeuratObject_5.3.0
[29] sp_2.2-0 Hmisc_5.2-3
[31] dplyr_1.1.4 circlize_0.4.16
[33] ComplexHeatmap_2.26.0 COTAN_2.11.1
loaded via a namespace (and not attached):
[1] fs_1.6.6 spatstat.sparse_3.1-0
[3] devtools_2.4.5 httr_1.4.7
[5] RColorBrewer_1.1-3 profvis_0.4.0
[7] tools_4.5.2 sctransform_0.4.2
[9] backports_1.5.0 R6_2.6.1
[11] lazyeval_0.2.2 uwot_0.2.3
[13] ggdist_3.3.3 GetoptLong_1.1.0
[15] urlchecker_1.0.1 withr_3.0.2
[17] gridExtra_2.3 parallelDist_0.2.6
[19] progressr_0.18.0 cli_3.6.5
[21] Cairo_1.7-0 spatstat.explore_3.6-0
[23] fastDummies_1.7.5 labeling_0.4.3
[25] S7_0.2.1 spatstat.data_3.1-9
[27] proxy_0.4-29 ggridges_0.5.6
[29] pbapply_1.7-2 foreign_0.8-90
[31] sessioninfo_1.2.3 parallelly_1.46.0
[33] rstudioapi_0.18.0 shape_1.4.6.1
[35] ica_1.0-3 spatstat.random_3.4-3
[37] distributional_0.6.0 dendextend_1.19.0
[39] Matrix_1.7-4 abind_1.4-8
[41] lifecycle_1.0.4 yaml_2.3.10
[43] SparseArray_1.10.8 Rtsne_0.17
[45] glmGamPoi_1.20.0 promises_1.5.0
[47] crayon_1.5.3 miniUI_0.1.2
[49] lattice_0.22-7 beachmat_2.26.0
[51] cowplot_1.2.0 magick_2.9.0
[53] zeallot_0.2.0 pillar_1.11.1
[55] knitr_1.50 rjson_0.2.23
[57] boot_1.3-32 future.apply_1.20.0
[59] codetools_0.2-20 glue_1.8.0
[61] spatstat.univar_3.1-6 remotes_2.5.0
[63] data.table_1.18.0 vctrs_0.7.0
[65] png_0.1-8 spam_2.11-1
[67] Rdpack_2.6.4 gtable_0.3.6
[69] assertthat_0.2.1 cachem_1.1.0
[71] xfun_0.52 rbibutils_2.3
[73] S4Arrays_1.10.1 mime_0.13
[75] reformulas_0.4.1 survival_3.8-3
[77] ncdf4_1.24 ellipsis_0.3.2
[79] fitdistrplus_1.2-2 ROCR_1.0-11
[81] nlme_3.1-168 usethis_3.2.1
[83] RcppAnnoy_0.0.22 rprojroot_2.1.1
[85] GenomeInfoDb_1.44.0 irlba_2.3.5.1
[87] KernSmooth_2.23-26 otel_0.2.0
[89] rpart_4.1.24 colorspace_2.1-1
[91] nnet_7.3-20 tidyselect_1.2.1
[93] compiler_4.5.2 htmlTable_2.4.3
[95] desc_1.4.3 DelayedArray_0.36.0
[97] plotly_4.11.0 checkmate_2.3.2
[99] scales_1.4.0 lmtest_0.9-40
[101] digest_0.6.37 goftest_1.2-3
[103] spatstat.utils_3.2-1 minqa_1.2.8
[105] rmarkdown_2.29 XVector_0.50.0
[107] htmltools_0.5.8.1 pkgconfig_2.0.3
[109] base64enc_0.1-3 lme4_1.1-37
[111] sparseMatrixStats_1.20.0 fastmap_1.2.0
[113] rlang_1.1.7 GlobalOptions_0.1.2
[115] htmlwidgets_1.6.4 ggthemes_5.2.0
[117] UCSC.utils_1.4.0 shiny_1.12.1
[119] DelayedMatrixStats_1.30.0 farver_2.1.2
[121] zoo_1.8-14 jsonlite_2.0.0
[123] BiocParallel_1.44.0 BiocSingular_1.26.1
[125] magrittr_2.0.4 Formula_1.2-5
[127] GenomeInfoDbData_1.2.14 dotCall64_1.2
[129] viridis_0.6.5 reticulate_1.44.1
[131] stringi_1.8.7 brio_1.1.5
[133] MASS_7.3-65 pkgbuild_1.4.7
[135] plyr_1.8.9 listenv_0.10.0
[137] ggrepel_0.9.6 deldir_2.0-4
[139] splines_4.5.2 tensor_1.5
[141] igraph_2.2.1 spatstat.geom_3.6-1
[143] RcppHNSW_0.6.0 pkgload_1.4.0
[145] reshape2_1.4.4 ScaledMatrix_1.16.0
[147] evaluate_1.0.5 nloptr_2.2.1
[149] httpuv_1.6.16 RANN_2.6.2
[151] tidyr_1.3.1 purrr_1.2.0
[153] polyclip_1.10-7 future_1.69.0
[155] clue_0.3-66 scattermore_1.2
[157] ggplot2_4.0.1 rsvd_1.0.5
[159] xtable_1.8-4 RSpectra_0.16-2
[161] later_1.4.2 viridisLite_0.4.2
[163] tibble_3.3.0 memoise_2.0.1
[165] cluster_2.1.8.1 globals_0.18.0