library(COTAN)
library(ComplexHeatmap)
library(circlize)
library(dplyr)
library(Hmisc)
library(Seurat)
library(patchwork)
library(Rfast)
library(parallel)
library(doParallel)
library(HiClimR)
library(stringr)
library(fst)

options(parallelly.fork.enable = TRUE)

dataFile <- "Data/Brown_PBMC_Datasets/capillary_blood_samples_pbmcs-Run_77-Cleaned.RDS"
name <- str_split(dataFile,pattern = "/",simplify = T)[3]
name <- str_remove(name,pattern = "-Cleaned.RDS")
name <- str_remove(name,pattern = "capillary_blood_samples_")

project = name

setLoggingLevel(1)
outDir <- "CoexData/"
setLoggingFile(paste0(outDir, "Logs/",name,".log"))

obj <- readRDS(dataFile)
file_code = nameGene Correlation Analysis for PBMC Brown run 77
Prologue
source("src/Functions.R")To compare the ability of COTAN to asses the real correlation between genes we define some pools of genes:
- Constitutive genes
- Neural progenitor genes
- Pan neuronal genes
- Some layer marker genes
hkGenes  <- read.csv("Data/Housekeeping_TranscriptsHuman.csv", sep = ";")

genesList <- list(
  "CD4 T cells"=
    c("TRBC2","CD3D","CD3G","CD3E","IL7R","LTB","LEF1"),
  "B cells"=
    c("PAX5","MS4A1","CD19","CD74","CD79A","IGHD","HLA-DRA"),
  "hk"= hkGenes$Gene_symbol[1:20], # from https://housekeeping.unicamp.br/
  "general PBMC markers" =
  c("FOXP3","TBX21","GATA3","RUNX1","BCL6","EOMES","EOMES","TBX21","BATF3","IRF2","TCF4","STAT5A","RUNX3","STAT6","BATF","STAT3","TBX21","TBX21","IRF8","IRF4","AHR","STAT1","IRF4","RELB")
)
COTAN
genesFromListExpressed <- unlist(genesList)[unlist(genesList) %in% getGenes(obj)]
int.genes <-getGenes(obj)
obj <- proceedToCoex(obj, calcCoex = TRUE, cores = 5L, saveObj = FALSE)coexMat.big <- getGenesCoex(obj)[genesFromListExpressed,genesFromListExpressed]
coexMat <- getGenesCoex(obj)[c(genesList$`CD4 T cells`,genesList$hk,genesList$`B cells`),c(genesList$`CD4 T cells`,genesList$hk,genesList$`B cells`)]
f1 = colorRamp2(seq(-1,1, length = 3), c("#DC0000B2", "white","#3C5488B2" ))
split.genes <- base::factor(c(rep("CD4 T cells",length(genesList[["CD4 T cells"]])),
rep("HK",length(genesList[["hk"]])),
rep("B cells",length(genesList[["B cells"]]))
),
levels = c("CD4 T cells","HK","B cells"))
lgd = Legend(col_fun = f1, title = "COTAN coex")
htmp <- Heatmap(as.matrix(coexMat),
#width = ncol(coexMat)*unit(2.5, "mm"),
height = nrow(coexMat)*unit(3, "mm"),
cluster_rows = FALSE,
cluster_columns = FALSE,
col = f1,
row_names_side = "left",
row_names_gp = gpar(fontsize = 11),
column_names_gp = gpar(fontsize = 11),
column_split = split.genes,
row_split = split.genes,
cluster_row_slices = FALSE,
cluster_column_slices = FALSE,
heatmap_legend_param = list(
title = "COTAN coex", at = c(-1, 0, 1),
direction = "horizontal",
labels = c("-1", "0", "1")
)
)
draw(htmp, heatmap_legend_side="right")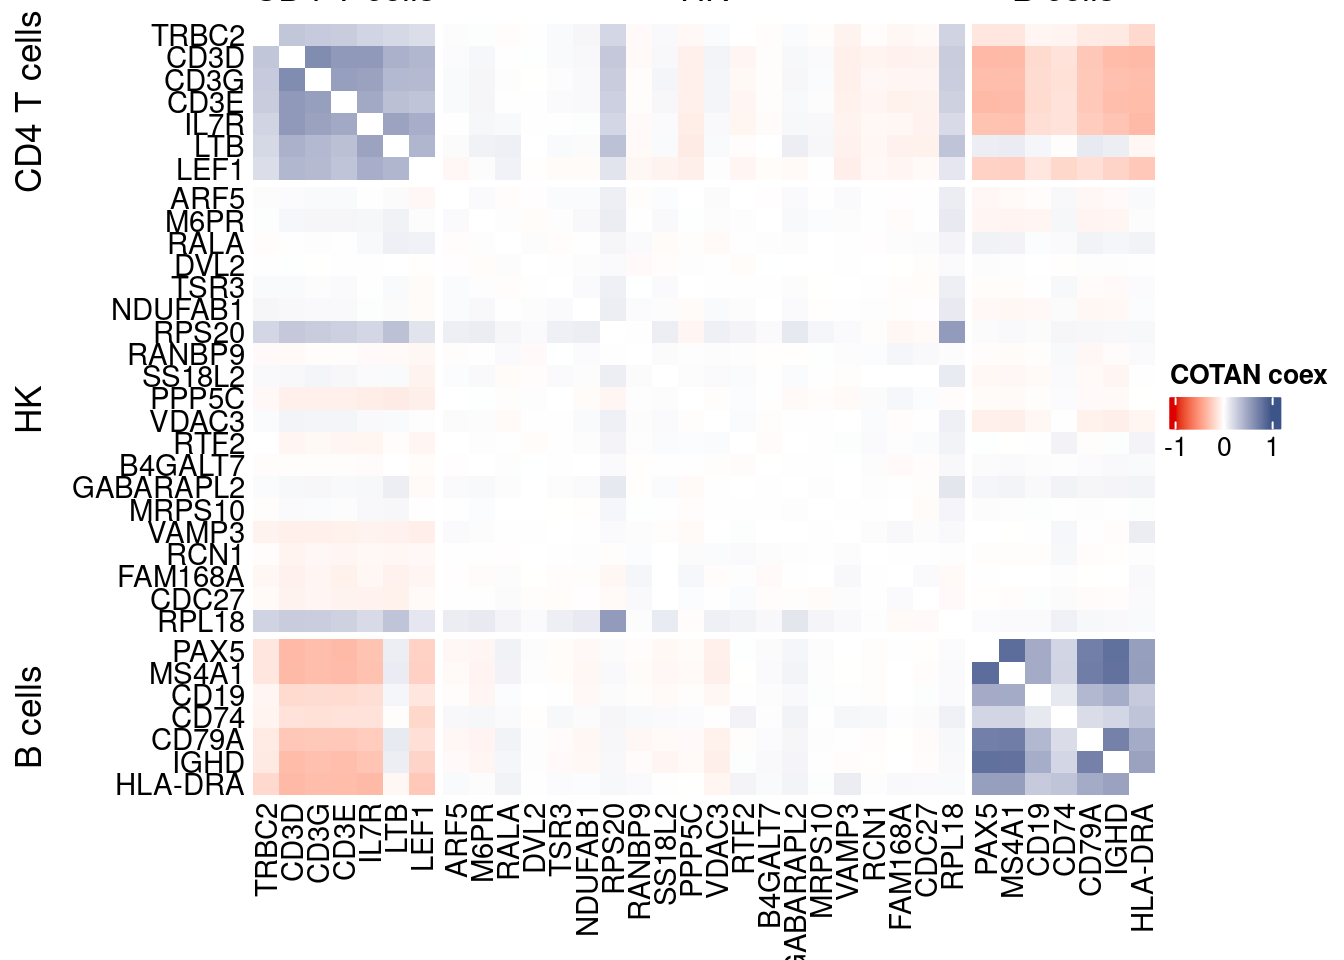
GDI_DF <- calculateGDI(obj)
GDI_DF$geneType <- NA
for (cat in names(genesList)) {
  GDI_DF[rownames(GDI_DF) %in% genesList[[cat]],]$geneType <- cat
}

GDI_DF$GDI_centered <- scale(GDI_DF$GDI,center = T,scale = T)

GDI_DF[genesFromListExpressed,]
sum.raw.norm GDI exp.cells geneType GDI_centered
TRBC2 9.827543 3.761546 70.8082658 CD4 T cells 2.6950798011
CD3D 9.778844 4.769577 71.3968088 CD4 T cells 4.1735046121
CD3G 9.669046 4.639743 69.3696050 CD4 T cells 3.9830838396
CD3E 9.578052 4.538442 70.2328015 CD4 T cells 3.8345108059
IL7R 10.107684 4.642136 66.9238818 CD4 T cells 3.9865931174
LTB 10.792764 4.646323 77.8446246 CD4 T cells 3.9927341129
LEF1 9.479637 4.498409 52.2626210 CD4 T cells 3.7757966552
PAX5 7.169109 4.092641 4.8129741 B cells 3.1806791239
MS4A1 7.292719 4.080474 5.5061470 B cells 3.1628342896
CD19 4.807077 2.992014 1.3994245 B cells 1.5664477002
CD74 9.853542 3.413808 47.0442061 B cells 2.1850706428
CD79A 7.840331 3.862701 7.5202720 B cells 2.8434388149
IGHD 7.430302 4.026343 4.6821868 B cells 3.0834432197
HLA-DRA 9.400513 4.612909 13.5757259 B cells 3.9437282798
ARF5 7.597360 1.973838 22.6654460 hk 0.0731440153
M6PR 8.194703 2.167348 36.3196443 hk 0.3569542456
RALA 8.173787 2.243266 31.6636150 hk 0.4682994860
DVL2 5.843259 1.288774 4.2375098 hk -0.9316026813
TSR3 7.424432 1.779133 19.5657860 hk -0.2124194832
NDUFAB1 7.969073 1.821111 31.8990322 hk -0.1508524613
RPS20 11.124966 3.696027 94.1276484 hk 2.5989856929
RANBP9 8.414616 2.282111 36.4504316 hk 0.5252709830
SS18L2 7.825754 1.923889 27.5568925 hk -0.0001137941
PPP5C 6.575832 2.119319 8.0434214 hk 0.2865129513
VDAC3 7.935373 1.844222 29.3617578 hk -0.1169578163
RTF2 8.085778 1.932721 33.3115354 hk 0.0128394004
B4GALT7 5.829414 1.403685 4.1982736 hk -0.7630700391
GABARAPL2 8.155099 2.046467 36.6466126 hk 0.1796654193
MRPS10 7.343016 1.444524 17.4862673 hk -0.7031734145
VAMP3 6.659895 2.544993 9.5867120 hk 0.9108254598
RCN1 6.043942 1.774021 5.1791787 hk -0.2199168344
FAM168A 7.811950 2.030865 17.6955271 hk 0.1567818351
CDC27 8.174439 2.301988 31.0489145 hk 0.5544234586
RPL18 11.777527 3.755186 95.4878368 hk 2.6857510614
FOXP3 4.960187 1.766541 1.2947947 general PBMC markers -0.2308877370
TBX21 7.097741 3.560250 9.6259482 general PBMC markers 2.3998499190
GATA3 7.831934 2.696178 21.0959979 general PBMC markers 1.1325605550
RUNX1 9.727092 2.661026 71.6453047 general PBMC markers 1.0810056749
BCL6 6.537284 3.042924 7.2586974 general PBMC markers 1.6411144725
EOMES 5.509615 2.236876 2.5503531 general PBMC markers 0.4589281094
EOMES.1 5.509615 2.236876 2.5503531 general PBMC markers 0.4589281094
TBX21.1 7.097741 3.560250 9.6259482 general PBMC markers 2.3998499190
BATF3 3.789194 3.039733 0.6800942 general PBMC markers 1.6364355925
IRF2 7.651172 1.609696 23.1101229 general PBMC markers -0.4609245587
TCF4 7.124340 3.857217 5.8592728 general PBMC markers 2.8353944687
STAT5A 7.030153 1.622988 12.7648444 general PBMC markers -0.4414300417
RUNX3 9.143328 3.594426 49.7907403 general PBMC markers 2.4499730437
STAT6 7.229371 2.449092 15.2759613 general PBMC markers 0.7701735559
BATF 6.918326 2.028569 10.7768768 general PBMC markers 0.1534147306
STAT3 9.334644 2.403912 65.3544337 general PBMC markers 0.7039094915
TBX21.2 7.097741 3.560250 9.6259482 general PBMC markers 2.3998499190
TBX21.3 7.097741 3.560250 9.6259482 general PBMC markers 2.3998499190
IRF8 6.795002 3.974535 6.7878629 general PBMC markers 3.0074593146
IRF4 6.130864 2.536698 3.6358880 general PBMC markers 0.8986601925
AHR 7.759098 3.258241 16.3484175 general PBMC markers 1.9569084223
STAT1 8.156932 2.202716 29.0217107 general PBMC markers 0.4088267629
IRF4.1 6.130864 2.536698 3.6358880 general PBMC markers 0.8986601925
RELB 8.671981 3.198585 39.9947685 general PBMC markers 1.8694145785GDIPlot(obj,GDIIn = GDI_DF, genes = genesList,GDIThreshold = 1.4)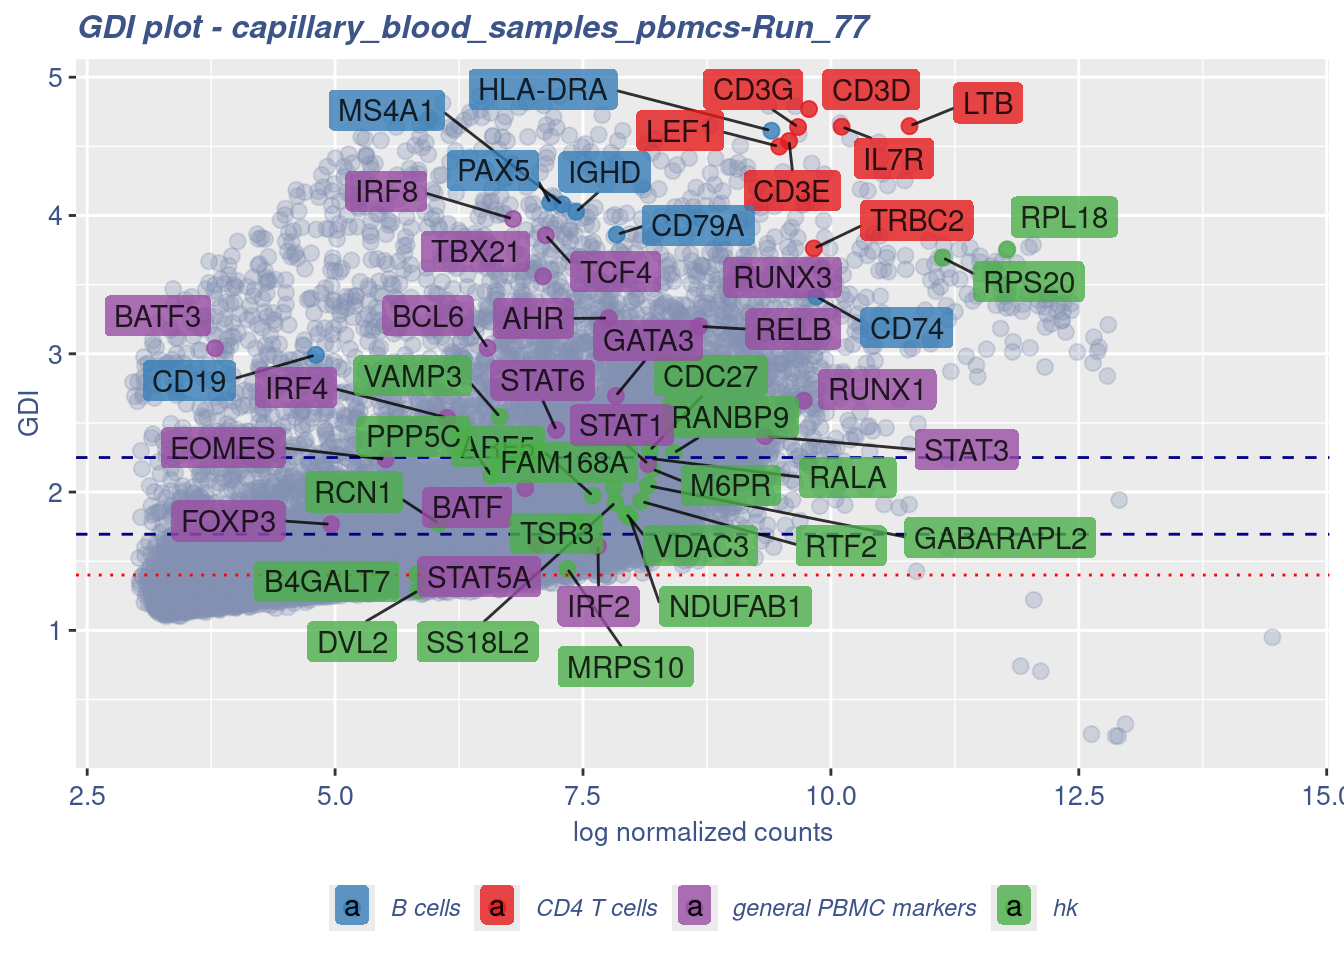
Seurat correlation
srat<- CreateSeuratObject(counts = getRawData(obj),
                          project = project,
                          min.cells = 3,
                          min.features = 200)
srat[["percent.mt"]] <- PercentageFeatureSet(srat, pattern = "^MT-")
srat <- NormalizeData(srat)
srat <- FindVariableFeatures(srat, selection.method = "vst", nfeatures = 2000)

# plot variable features with and without labels
plot1 <- VariableFeaturePlot(srat)

plot1$data$centered_variance <- scale(plot1$data$variance.standardized,
                                      center = T,scale = F)

write.csv(plot1$data,paste0("CoexData/",
                            "Variance_Seurat_genes",
                            file_code,".csv"))

LabelPoints(plot = plot1, points = c(genesList$`CD4 T cells`,genesList$`B cells`,genesList$hk), repel = TRUE)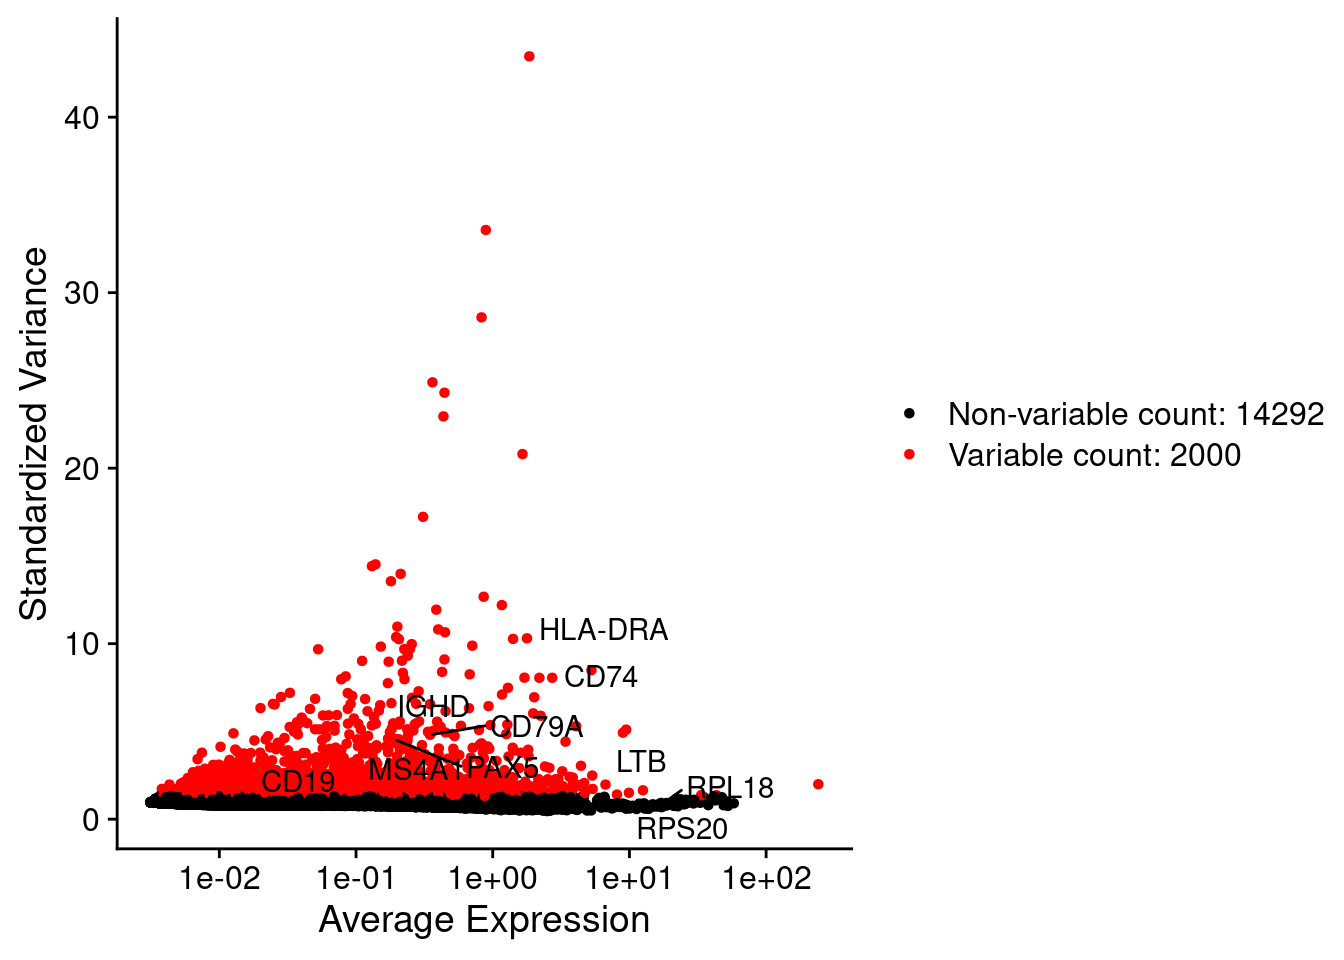
LabelPoints(plot = plot1, points = c(genesList$hk), repel = TRUE)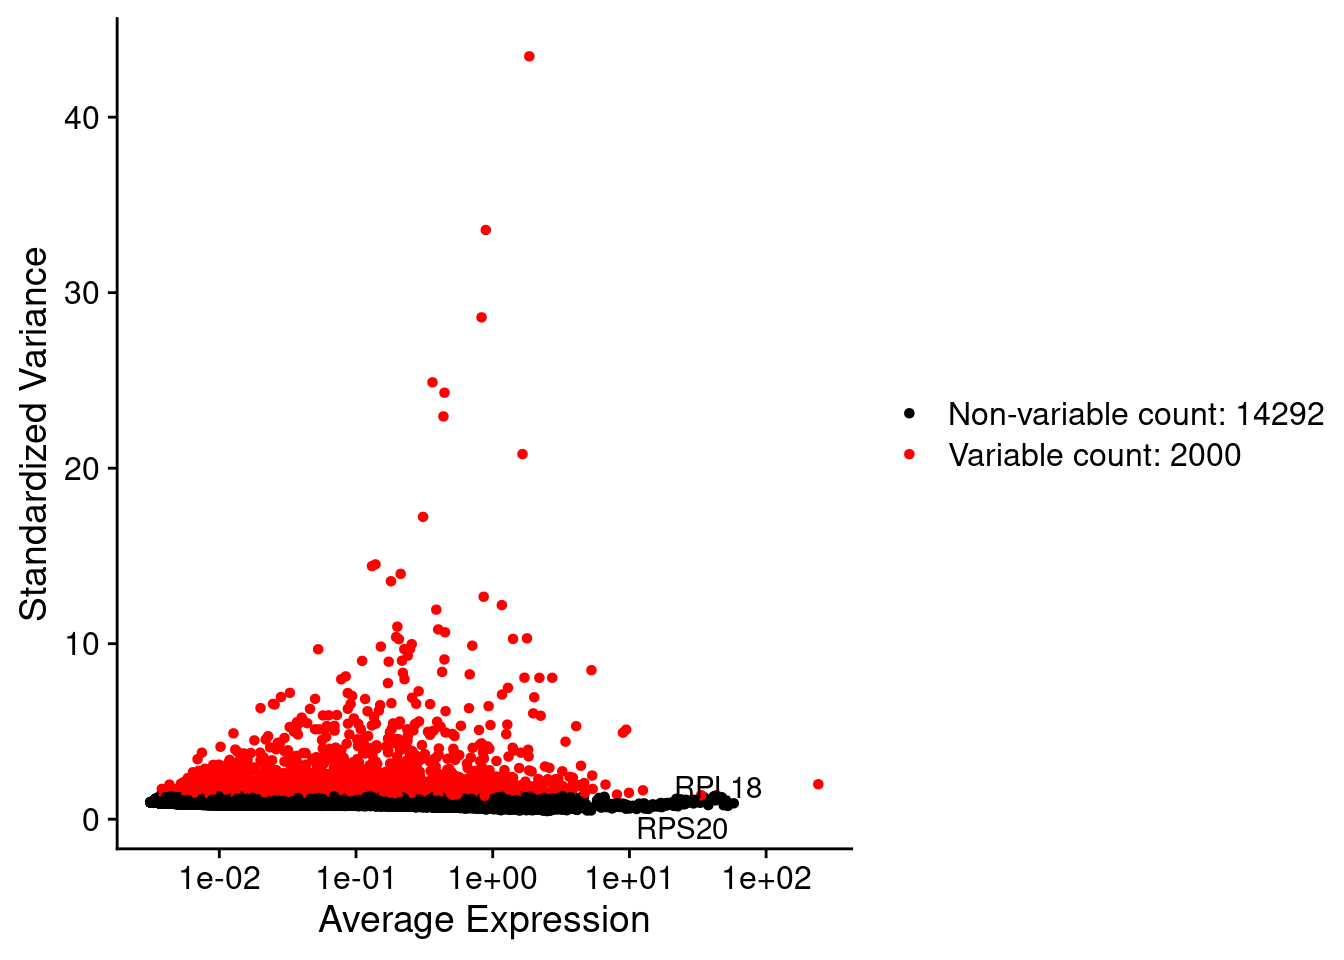
all.genes <- rownames(srat)
srat <- ScaleData(srat, features = all.genes)
seurat.data = GetAssayData(srat[["RNA"]],layer = "data")
corr.pval.list <- correlation_pvalues(data = seurat.data,
genesFromListExpressed,
n.cells = getNumCells(obj))
seurat.data.cor.big <- as.matrix(Matrix::forceSymmetric(corr.pval.list$data.cor, uplo = "U"))
htmp <- correlation_plotPBMC(seurat.data.cor.big,
genesList, title="Seurat corr")
p_values.fromSeurat <- corr.pval.list$p_values
seurat.data.cor.big <- corr.pval.list$data.cor
rm(corr.pval.list)
gc() used (Mb) gc trigger (Mb) max used (Mb)
Ncells 10573514 564.7 17840498 952.8 17840498 952.8
Vcells 377157946 2877.5 674458976 5145.8 1635875174 12480.8draw(htmp, heatmap_legend_side="right")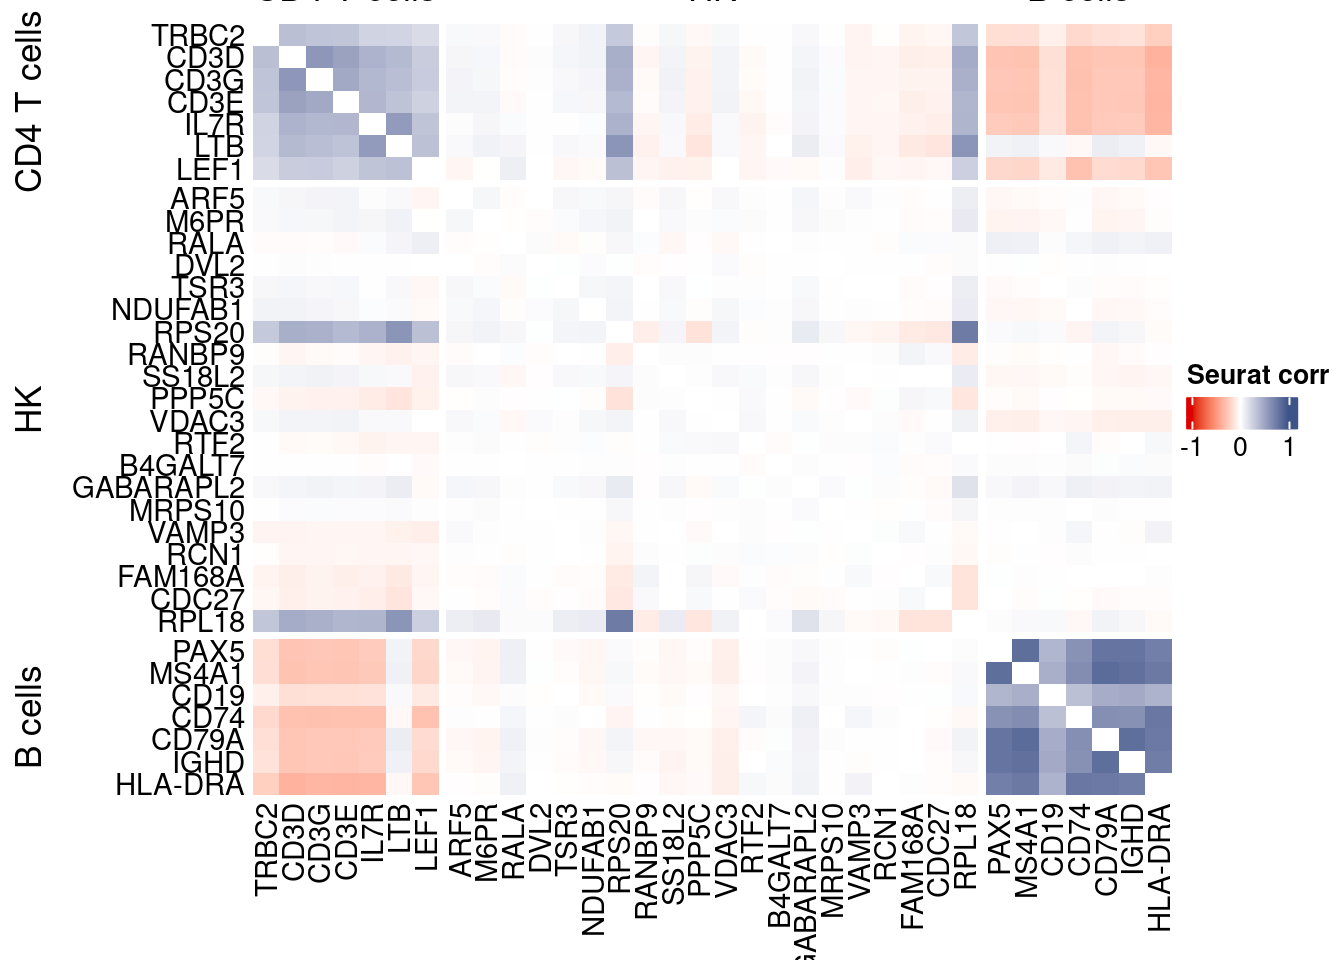
rm(seurat.data.cor.big)
rm(p_values.fromSeurat)

sratbase <- srat
Seurat SC Transform
srat <-  SCTransform(srat,
                     method = "glmGamPoi",
                     vars.to.regress = "percent.mt",
                     verbose = FALSE)

seurat.data <- GetAssayData(srat[["SCT"]],layer = "data")

#Remove genes with all zeros
seurat.data <-seurat.data[rowSums(seurat.data) > 0,]


corr.pval.list <- correlation_pvalues(seurat.data,
                                      genesFromListExpressed,
                                      n.cells = getNumCells(obj))


seurat.data.cor.big <- as.matrix(Matrix::forceSymmetric(corr.pval.list$data.cor, uplo = "U"))

htmp <- correlation_plotPBMC(seurat.data.cor.big,
                         genesList, title="Seurat corr SCT")


p_values.fromSeurat <- corr.pval.list$p_values
seurat.data.cor.big <- corr.pval.list$data.cor

rm(corr.pval.list)
gc()
used (Mb) gc trigger (Mb) max used (Mb)
Ncells 10901727 582.3 17840498 952.8 17840498 952.8
Vcells 450266656 3435.3 1165756310 8894.1 1635875174 12480.8draw(htmp, heatmap_legend_side="right")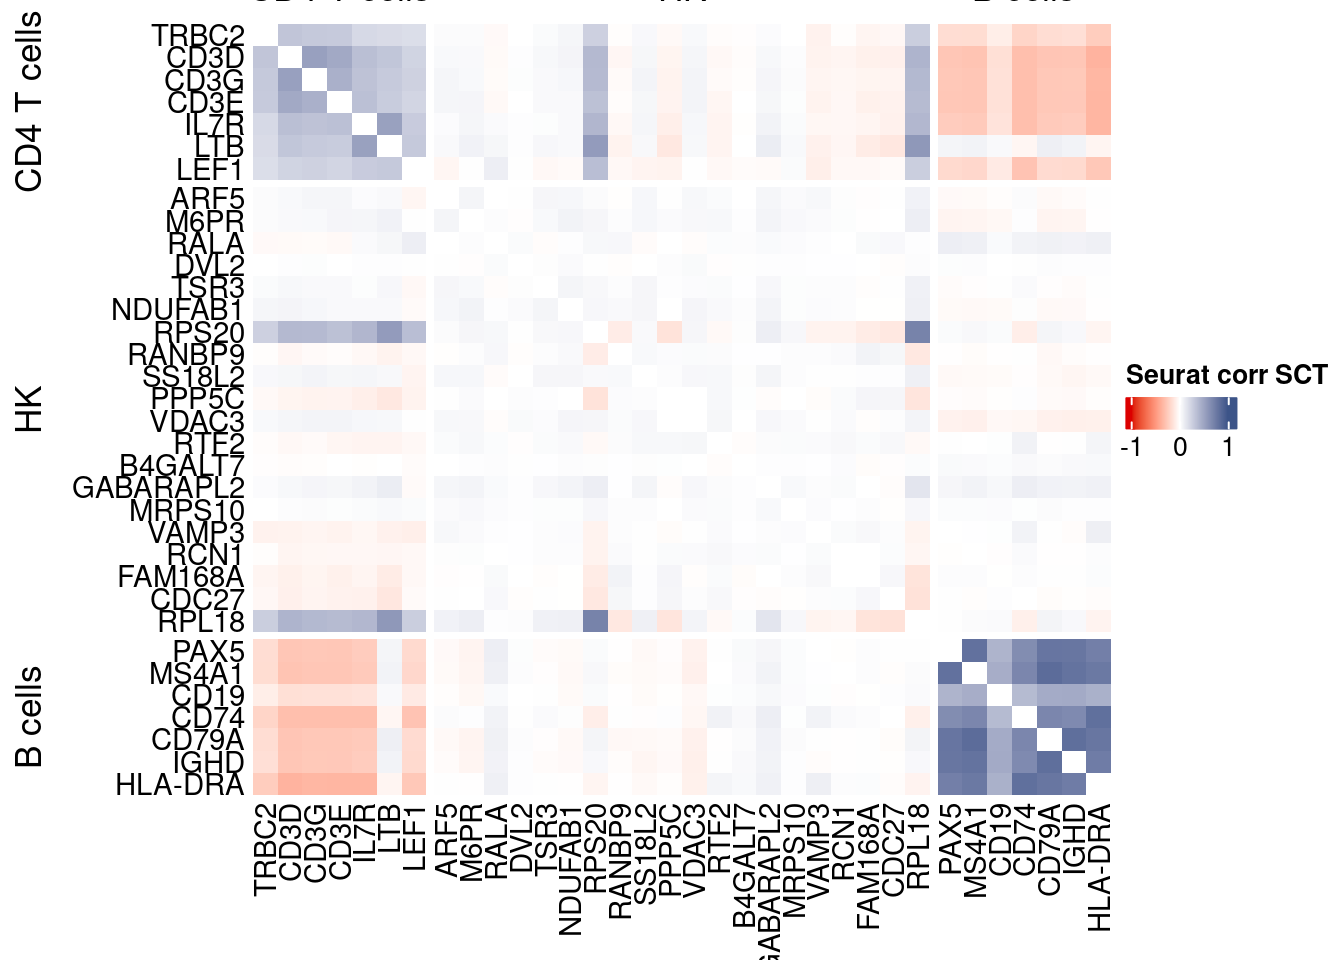
plot1 <- VariableFeaturePlot(srat)

plot1$data$centered_variance <- scale(plot1$data$residual_variance,
center = T,scale = F)write.csv(plot1$data,paste0("CoexData/",
"Variance_SeuratSCT_genes",
file_code,".csv"))
write_fst(as.data.frame(seurat.data.cor.big),path = paste0("CoexData/SeuratCorrSCT_",file_code,".fst"), compress = 100)
write_fst(as.data.frame(p_values.fromSeurat),path = paste0("CoexData/SeuratPValuesSCT_", file_code,".fst"))
write.csv(as.data.frame(p_values.fromSeurat),paste0("CoexData/SeuratPValuesSCT_", file_code,".csv"))
rm(seurat.data.cor.big)
rm(p_values.fromSeurat)Monocle
library(monocle3)cds <- new_cell_data_set(getRawData(obj),
#cell_metadata = getMetadataCells(obj),
#gene_metadata = getMetadataGenes(obj)
)
cds <- preprocess_cds(cds, num_dim = 100)
normalized_counts <- normalized_counts(cds)#Remove genes with all zeros
normalized_counts <- normalized_counts[rowSums(normalized_counts) > 0,]
corr.pval.list <- correlation_pvalues(normalized_counts,
genesFromListExpressed,
n.cells = getNumCells(obj))
rm(normalized_counts)
monocle.data.cor.big <- as.matrix(Matrix::forceSymmetric(corr.pval.list$data.cor, uplo = "U"))
htmp <- correlation_plotPBMC(data.cor.big = monocle.data.cor.big,
genesList,
title = "Monocle corr")
p_values.from.monocle <- corr.pval.list$p_values
monocle.data.cor.big <- corr.pval.list$data.cor
rm(corr.pval.list)
gc() used (Mb) gc trigger (Mb) max used (Mb)
Ncells 11087846 592.2 17840498 952.8 17840498 952.8
Vcells 453025837 3456.4 1165756310 8894.1 1635875174 12480.8draw(htmp, heatmap_legend_side="right")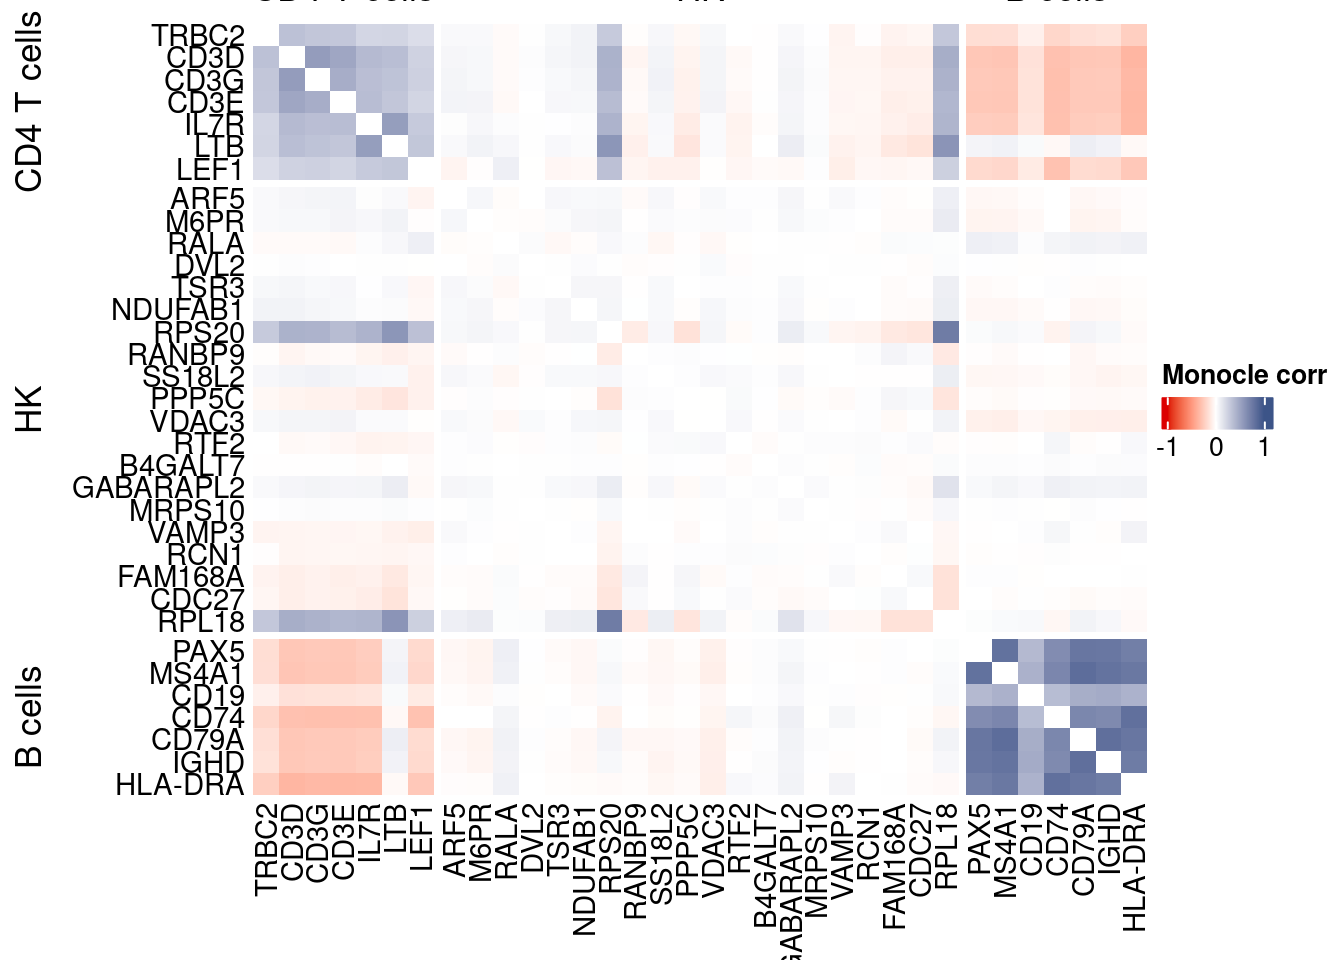
Cs-Core
devtools::load_all("../CS-CORE/")Extract CS_CORE corr matrix
#seuratObj@assays$RNA@counts <- ceiling(seuratObj@assays$RNA@counts)
csCoreRes <- CSCORE(sratbase, genes = genesFromListExpressed)
[INFO] IRLS converged after 2 iterations.
[INFO] Starting WLS for covariance at Thu Jan 22 14:09:32 2026
[INFO] 3 among 58 genes have invalid variance estimates. Their co-expressions with other genes were set to 0.
[INFO] 0.9074% co-expression estimates were greater than 1 and were set to 1.
[INFO] 0.0605% co-expression estimates were smaller than -1 and were set to -1.
[INFO] Finished WLS. Elapsed time: 1.0239 seconds.mat <- as.matrix(csCoreRes$est)
diag(mat) <- 0
split.genes <- base::factor(c(rep("CD4 T cells",sum(genesList[["CD4 T cells"]] %in% genesFromListExpressed)),
rep("HK",sum(genesList[["hk"]] %in% genesFromListExpressed)),
rep("B cells",sum(genesList[["B cells"]] %in% genesFromListExpressed))
),
levels = c("CD4 T cells","HK","B cells"))
f1 = colorRamp2(seq(-1,1, length = 3), c("#DC0000B2", "white","#3C5488B2" ))
htmp <- Heatmap(as.matrix(mat[c(genesList$`CD4 T cells`,genesList$hk,genesList$`B cells`),c(genesList$`CD4 T cells`,genesList$hk,genesList$`B cells`)]),
#width = ncol(coexMat)*unit(2.5, "mm"),
height = nrow(mat)*unit(3, "mm"),
cluster_rows = FALSE,
cluster_columns = FALSE,
col = f1,
row_names_side = "left",
row_names_gp = gpar(fontsize = 11),
column_names_gp = gpar(fontsize = 11),
column_split = split.genes,
row_split = split.genes,
cluster_row_slices = FALSE,
cluster_column_slices = FALSE,
heatmap_legend_param = list(
title = "CS-CORE", at = c(-1, 0, 1),
direction = "horizontal",
labels = c("-1", "0", "1")
)
)
draw(htmp, heatmap_legend_side="right")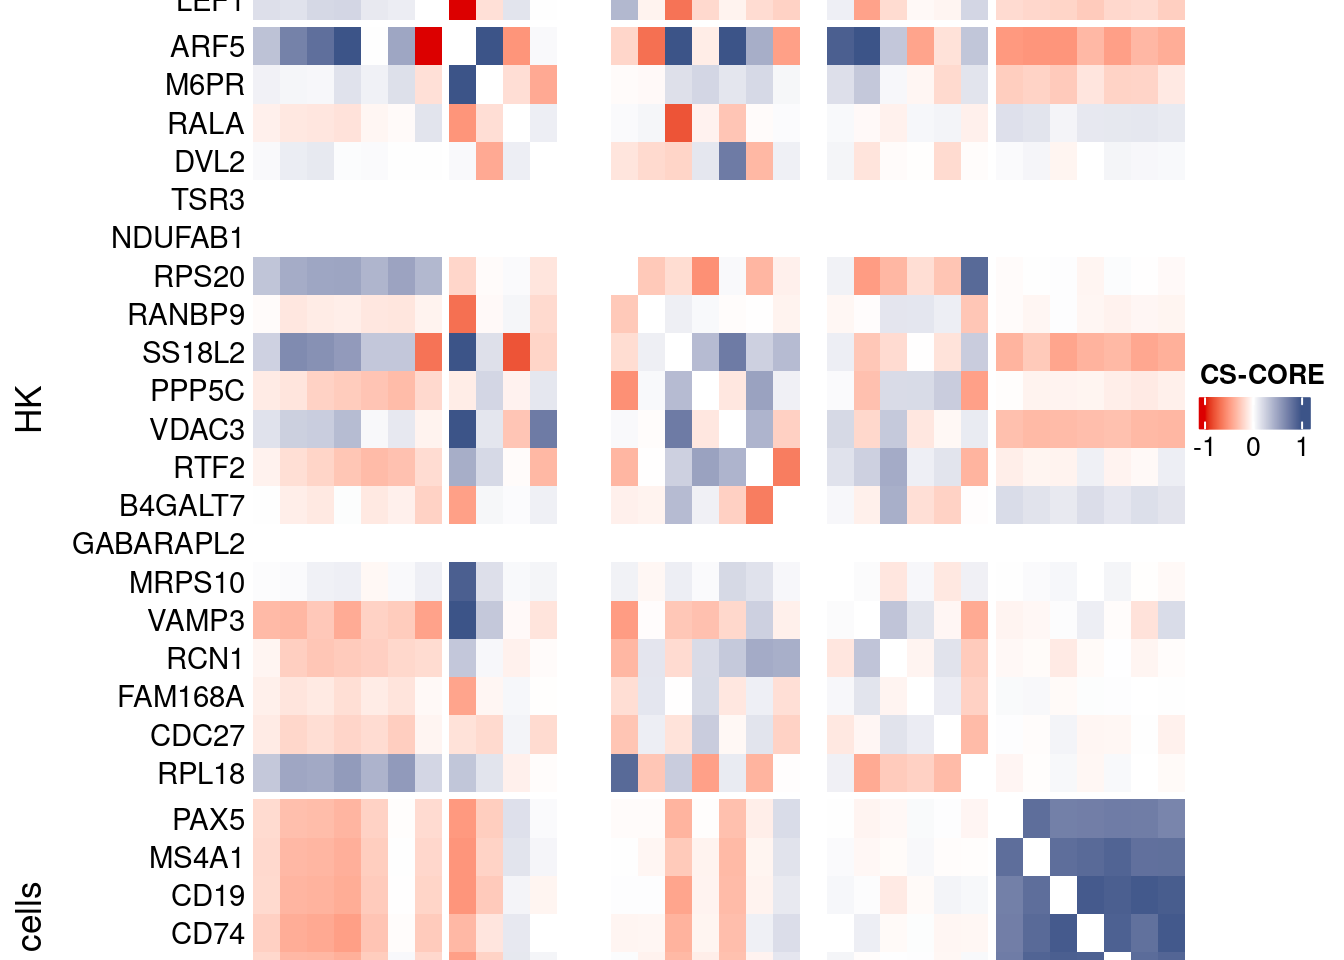
Save CS_CORE matrix
write_fst(as.data.frame(csCoreRes$est), path = paste0("CoexData/CS_CORECorr_", file_code,".fst"),compress = 100)
write_fst(as.data.frame(csCoreRes$p_value), path = paste0("CoexData/CS_COREPValues_", file_code,".fst"),compress = 100)
write.csv(as.data.frame(csCoreRes$p_value), paste0("CoexData/CS_COREPValues_", file_code,".csv"))
Baseline: Spearman on UMI counts
corr.pval.list <- correlation_pvaluesSpearman(data = getRawData(obj),
                                      genesFromListExpressed,
                                      n.cells = getNumCells(obj))

data.cor.big <- as.matrix(Matrix::forceSymmetric(corr.pval.list$data.cor, uplo = "U"))

htmp <- correlation_plot(data.cor.big,
                         genesList, title="UMI baseline S. corr")


p_values.fromSp.C <- corr.pval.list$p_values
data.cor.bigSp.C <- corr.pval.list$data.cor

rm(corr.pval.list)
gc()
used (Mb) gc trigger (Mb) max used (Mb)
Ncells 11208982 598.7 17840498 952.8 17840498 952.8
Vcells 453255067 3458.1 1165756310 8894.1 1635875174 12480.8draw(htmp, heatmap_legend_side="right")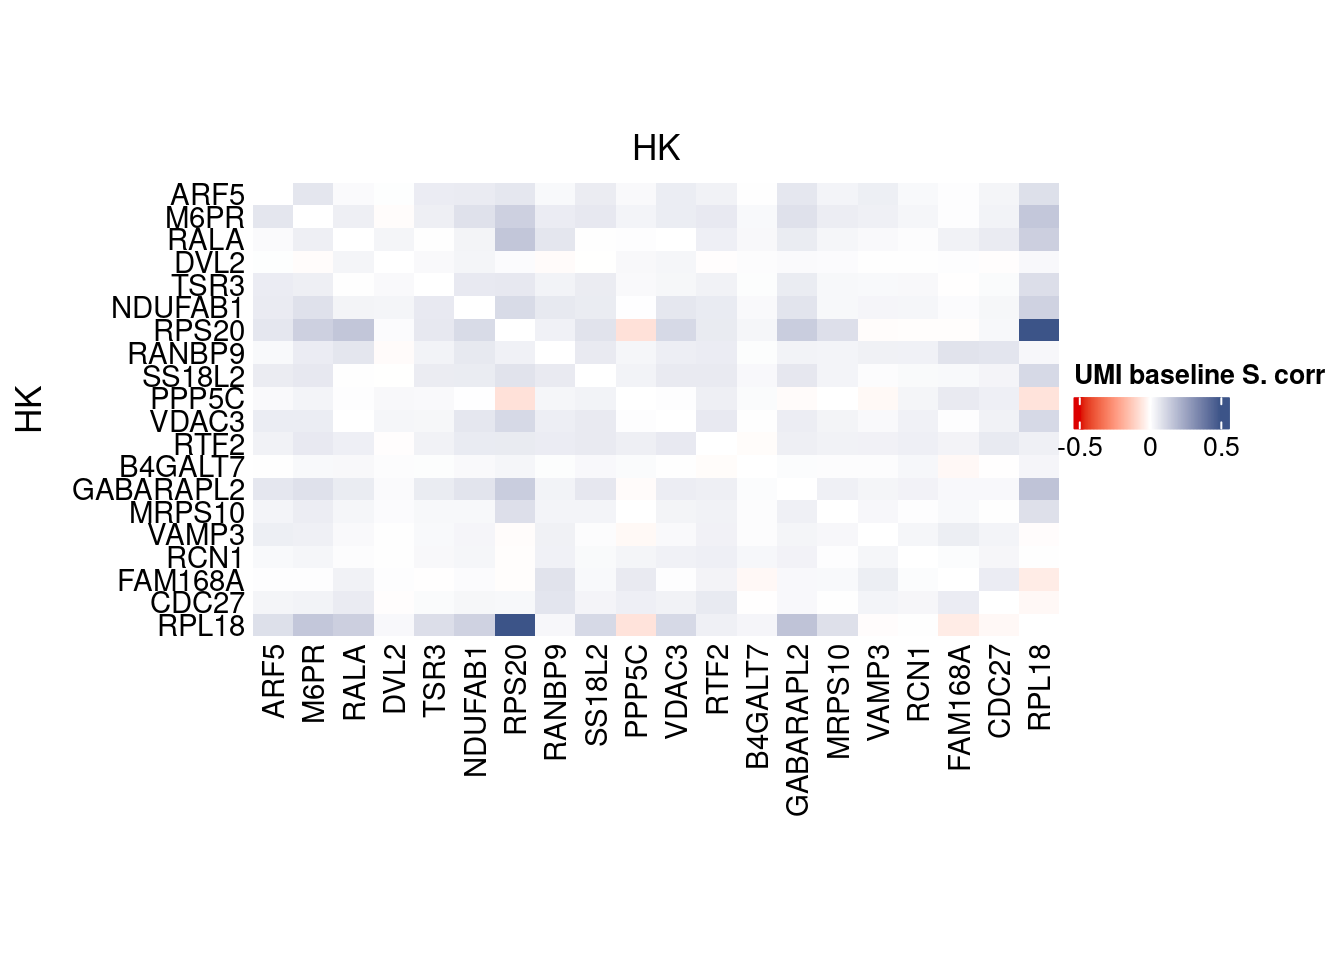
write.csv(as.data.frame(p_values.fromSp.C), paste0("CoexData/BaselineUMISpCorrPValues_", file_code,".csv"))Baseline: Pearson on binarized counts
corr.pval.list <- correlation_pvalues(data = getZeroOneProj(obj),
                                      genesFromListExpressed,
                                      n.cells = getNumCells(obj))

data.cor.big <- as.matrix(Matrix::forceSymmetric(corr.pval.list$data.cor, uplo = "U"))

htmp <- correlation_plotPBMC(data.cor.big,
                         genesList, title="Zero-one P. corr")


p_values.fromSp.C <- corr.pval.list$p_values
data.cor.bigSp.C <- corr.pval.list$data.cor

rm(corr.pval.list)
gc()
used (Mb) gc trigger (Mb) max used (Mb)
Ncells 11209049 598.7 17840498 952.8 17840498 952.8
Vcells 453256108 3458.1 1165756310 8894.1 1635875174 12480.8draw(htmp, heatmap_legend_side="right")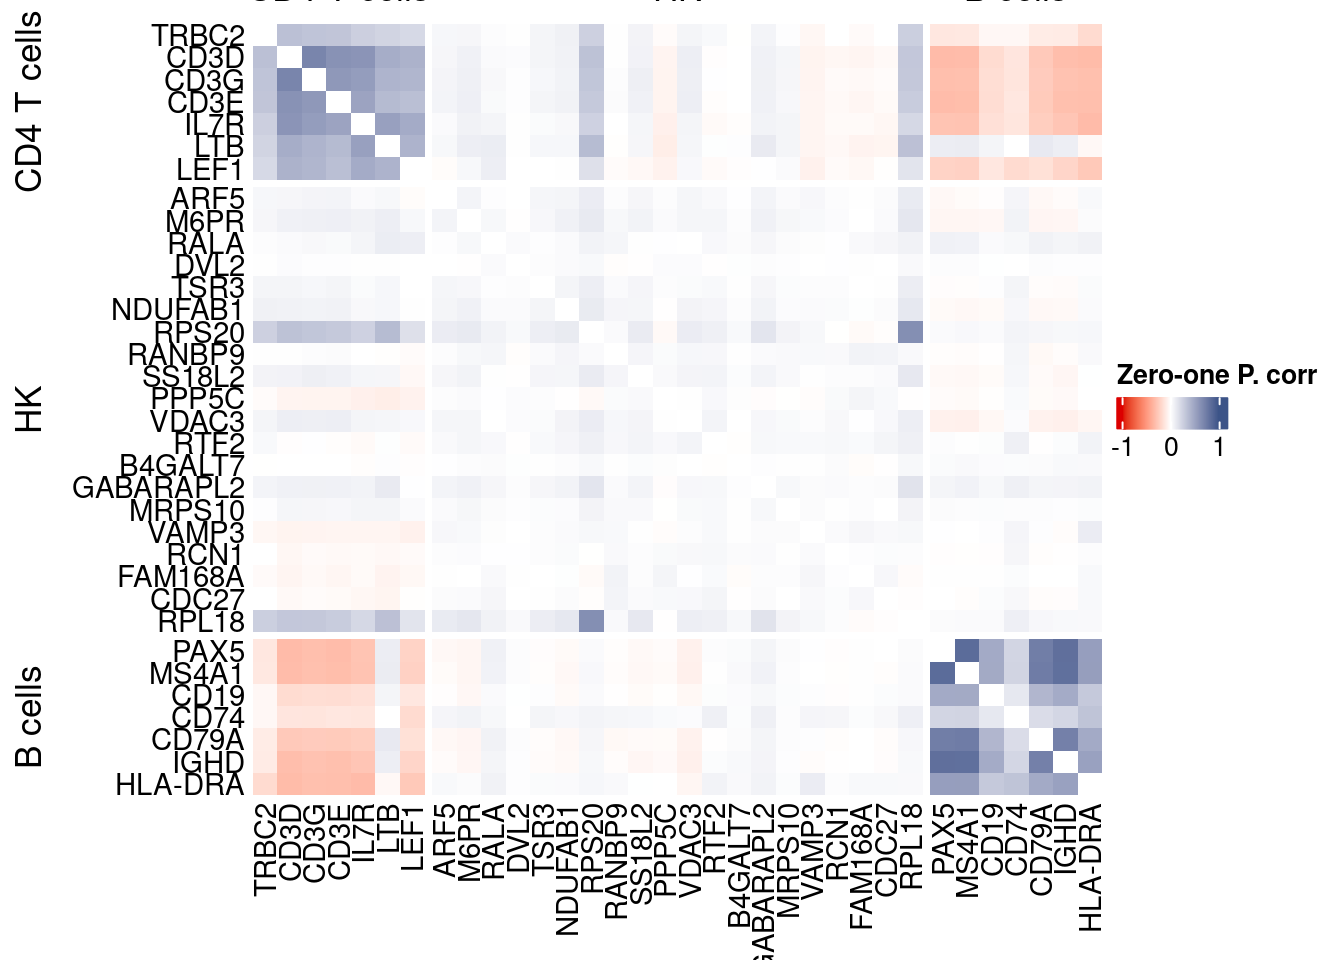
write.csv(as.data.frame(p_values.fromSp.C), paste0("CoexData/ZeroOnePCorrPValues_", file_code,".csv"))Sys.time()[1] "2026-01-22 14:09:41 CET"sessionInfo()R version 4.5.2 (2025-10-31)
Platform: x86_64-pc-linux-gnu
Running under: Ubuntu 22.04.5 LTS
Matrix products: default
BLAS: /usr/lib/x86_64-linux-gnu/blas/libblas.so.3.10.0
LAPACK: /usr/lib/x86_64-linux-gnu/lapack/liblapack.so.3.10.0 LAPACK version 3.10.0
locale:
[1] LC_CTYPE=C.UTF-8 LC_NUMERIC=C LC_TIME=C.UTF-8
[4] LC_COLLATE=C.UTF-8 LC_MONETARY=C.UTF-8 LC_MESSAGES=C.UTF-8
[7] LC_PAPER=C.UTF-8 LC_NAME=C LC_ADDRESS=C
[10] LC_TELEPHONE=C LC_MEASUREMENT=C.UTF-8 LC_IDENTIFICATION=C
time zone: Europe/Rome
tzcode source: system (glibc)
attached base packages:
[1] stats4 parallel grid stats graphics grDevices utils
[8] datasets methods base
other attached packages:
[1] CSCORE_1.0.2 testthat_3.3.2
[3] monocle3_1.3.7 SingleCellExperiment_1.32.0
[5] SummarizedExperiment_1.38.1 GenomicRanges_1.62.1
[7] Seqinfo_1.0.0 IRanges_2.44.0
[9] S4Vectors_0.48.0 MatrixGenerics_1.22.0
[11] matrixStats_1.5.0 Biobase_2.70.0
[13] BiocGenerics_0.56.0 generics_0.1.3
[15] fstcore_0.10.0 fst_0.9.8
[17] stringr_1.6.0 HiClimR_2.2.1
[19] doParallel_1.0.17 iterators_1.0.14
[21] foreach_1.5.2 Rfast_2.1.5.1
[23] RcppParallel_5.1.10 zigg_0.0.2
[25] Rcpp_1.1.0 patchwork_1.3.2
[27] Seurat_5.4.0 SeuratObject_5.3.0
[29] sp_2.2-0 Hmisc_5.2-3
[31] dplyr_1.1.4 circlize_0.4.16
[33] ComplexHeatmap_2.26.0 COTAN_2.11.1
loaded via a namespace (and not attached):
[1] fs_1.6.6 spatstat.sparse_3.1-0
[3] devtools_2.4.5 httr_1.4.7
[5] RColorBrewer_1.1-3 profvis_0.4.0
[7] tools_4.5.2 sctransform_0.4.2
[9] backports_1.5.0 R6_2.6.1
[11] lazyeval_0.2.2 uwot_0.2.3
[13] ggdist_3.3.3 GetoptLong_1.1.0
[15] urlchecker_1.0.1 withr_3.0.2
[17] gridExtra_2.3 parallelDist_0.2.6
[19] progressr_0.18.0 cli_3.6.5
[21] Cairo_1.7-0 spatstat.explore_3.6-0
[23] fastDummies_1.7.5 labeling_0.4.3
[25] S7_0.2.1 spatstat.data_3.1-9
[27] proxy_0.4-29 ggridges_0.5.6
[29] pbapply_1.7-2 foreign_0.8-90
[31] sessioninfo_1.2.3 parallelly_1.46.0
[33] torch_0.16.3 rstudioapi_0.18.0
[35] shape_1.4.6.1 ica_1.0-3
[37] spatstat.random_3.4-3 distributional_0.6.0
[39] dendextend_1.19.0 Matrix_1.7-4
[41] abind_1.4-8 lifecycle_1.0.4
[43] yaml_2.3.10 SparseArray_1.10.8
[45] Rtsne_0.17 glmGamPoi_1.20.0
[47] promises_1.5.0 crayon_1.5.3
[49] miniUI_0.1.2 lattice_0.22-7
[51] beachmat_2.26.0 cowplot_1.2.0
[53] magick_2.9.0 zeallot_0.2.0
[55] pillar_1.11.1 knitr_1.50
[57] rjson_0.2.23 boot_1.3-32
[59] future.apply_1.20.0 codetools_0.2-20
[61] glue_1.8.0 spatstat.univar_3.1-6
[63] remotes_2.5.0 data.table_1.18.0
[65] Rdpack_2.6.4 vctrs_0.7.0
[67] png_0.1-8 spam_2.11-1
[69] gtable_0.3.6 assertthat_0.2.1
[71] cachem_1.1.0 xfun_0.52
[73] rbibutils_2.3 S4Arrays_1.10.1
[75] mime_0.13 reformulas_0.4.1
[77] survival_3.8-3 ncdf4_1.24
[79] ellipsis_0.3.2 fitdistrplus_1.2-2
[81] ROCR_1.0-11 nlme_3.1-168
[83] usethis_3.2.1 bit64_4.6.0-1
[85] RcppAnnoy_0.0.22 rprojroot_2.1.1
[87] GenomeInfoDb_1.44.0 irlba_2.3.5.1
[89] KernSmooth_2.23-26 otel_0.2.0
[91] rpart_4.1.24 colorspace_2.1-1
[93] nnet_7.3-20 tidyselect_1.2.1
[95] processx_3.8.6 bit_4.6.0
[97] compiler_4.5.2 htmlTable_2.4.3
[99] desc_1.4.3 DelayedArray_0.36.0
[101] plotly_4.11.0 checkmate_2.3.2
[103] scales_1.4.0 lmtest_0.9-40
[105] callr_3.7.6 digest_0.6.37
[107] goftest_1.2-3 spatstat.utils_3.2-1
[109] minqa_1.2.8 rmarkdown_2.29
[111] XVector_0.50.0 htmltools_0.5.8.1
[113] pkgconfig_2.0.3 base64enc_0.1-3
[115] coro_1.1.0 lme4_1.1-37
[117] sparseMatrixStats_1.20.0 fastmap_1.2.0
[119] rlang_1.1.7 GlobalOptions_0.1.2
[121] htmlwidgets_1.6.4 ggthemes_5.2.0
[123] UCSC.utils_1.4.0 shiny_1.12.1
[125] DelayedMatrixStats_1.30.0 farver_2.1.2
[127] zoo_1.8-14 jsonlite_2.0.0
[129] BiocParallel_1.44.0 BiocSingular_1.26.1
[131] magrittr_2.0.4 Formula_1.2-5
[133] GenomeInfoDbData_1.2.14 dotCall64_1.2
[135] viridis_0.6.5 reticulate_1.44.1
[137] stringi_1.8.7 brio_1.1.5
[139] MASS_7.3-65 pkgbuild_1.4.7
[141] plyr_1.8.9 listenv_0.10.0
[143] ggrepel_0.9.6 deldir_2.0-4
[145] splines_4.5.2 tensor_1.5
[147] ps_1.9.1 igraph_2.2.1
[149] spatstat.geom_3.6-1 RcppHNSW_0.6.0
[151] pkgload_1.4.0 reshape2_1.4.4
[153] ScaledMatrix_1.16.0 evaluate_1.0.5
[155] nloptr_2.2.1 httpuv_1.6.16
[157] RANN_2.6.2 tidyr_1.3.1
[159] purrr_1.2.0 polyclip_1.10-7
[161] future_1.69.0 clue_0.3-66
[163] scattermore_1.2 ggplot2_4.0.1
[165] rsvd_1.0.5 xtable_1.8-4
[167] RSpectra_0.16-2 later_1.4.2
[169] viridisLite_0.4.2 tibble_3.3.0
[171] memoise_2.0.1 cluster_2.1.8.1
[173] globals_0.18.0