library(COTAN)
library(ComplexHeatmap)
library(circlize)
library(dplyr)
library(Hmisc)
library(Seurat)
library(patchwork)
library(Rfast)
library(parallel)
library(doParallel)
library(HiClimR)
library(stringr)
library(fst)

options(parallelly.fork.enable = TRUE)

dataFile <- "Data/PBMC2/filtered/PBMC2.cotan.RDS"
name <- str_split(dataFile,pattern = "/",simplify = T)[4]
name <- str_remove(name,pattern = ".cotan.RDS")

project = name

setLoggingLevel(1)
outDir <- "CoexData/"
setLoggingFile(paste0(outDir, "Logs/",name,".log"))

obj <- readRDS(dataFile)
file_code = nameGene Correlation Analysis for PBMC 2
Prologue
source("src/Functions.R")To compare the ability of COTAN to asses the real correlation between genes we define some pools of genes:
- Constitutive genes
- Neural progenitor genes
- Pan neuronal genes
- Some layer marker genes
hkGenes  <- read.csv("Data/Housekeeping_TranscriptsHuman.csv", sep = ";")

genesList <- list(
  "CD4 T cells"=
    c("TRBC2","CD3D","CD3G","CD3E","IL7R","LTB","LEF1"),
  "B cells"=
    c("PAX5","MS4A1","CD19","CD74","CD79A","IGHD","HLA-DRA"),
  "hk"= hkGenes$Gene_symbol[1:20], # from https://housekeeping.unicamp.br/
  "general PBMC markers" =
  c("FOXP3","TBX21","GATA3","RUNX1","BCL6","EOMES","EOMES","TBX21","BATF3","IRF2","TCF4","STAT5A","RUNX3","STAT6","BATF","STAT3","TBX21","TBX21","IRF8","IRF4","AHR","STAT1","IRF4","RELB")
)
COTAN
genesFromListExpressed <- unlist(genesList)[unlist(genesList) %in% getGenes(obj)]
int.genes <-getGenes(obj)
#obj <- proceedToCoex(obj, calcCoex = TRUE, cores = 5L, saveObj = FALSE)coexMat.big <- getGenesCoex(obj)[genesFromListExpressed,genesFromListExpressed]
coexMat <- getGenesCoex(obj)[c(genesList$`CD4 T cells`,genesList$hk,genesList$`B cells`),c(genesList$`CD4 T cells`,genesList$hk,genesList$`B cells`)]
f1 = colorRamp2(seq(-1,1, length = 3), c("#DC0000B2", "white","#3C5488B2" ))
split.genes <- base::factor(c(rep("CD4 T cells",length(genesList[["CD4 T cells"]])),
rep("HK",length(genesList[["hk"]])),
rep("B cells",length(genesList[["B cells"]]))
),
levels = c("CD4 T cells","HK","B cells"))
lgd = Legend(col_fun = f1, title = "COTAN coex")
htmp <- Heatmap(as.matrix(coexMat),
#width = ncol(coexMat)*unit(2.5, "mm"),
height = nrow(coexMat)*unit(3, "mm"),
cluster_rows = FALSE,
cluster_columns = FALSE,
col = f1,
row_names_side = "left",
row_names_gp = gpar(fontsize = 11),
column_names_gp = gpar(fontsize = 11),
column_split = split.genes,
row_split = split.genes,
cluster_row_slices = FALSE,
cluster_column_slices = FALSE,
heatmap_legend_param = list(
title = "COTAN coex", at = c(-1, 0, 1),
direction = "horizontal",
labels = c("-1", "0", "1")
)
)
draw(htmp, heatmap_legend_side="right")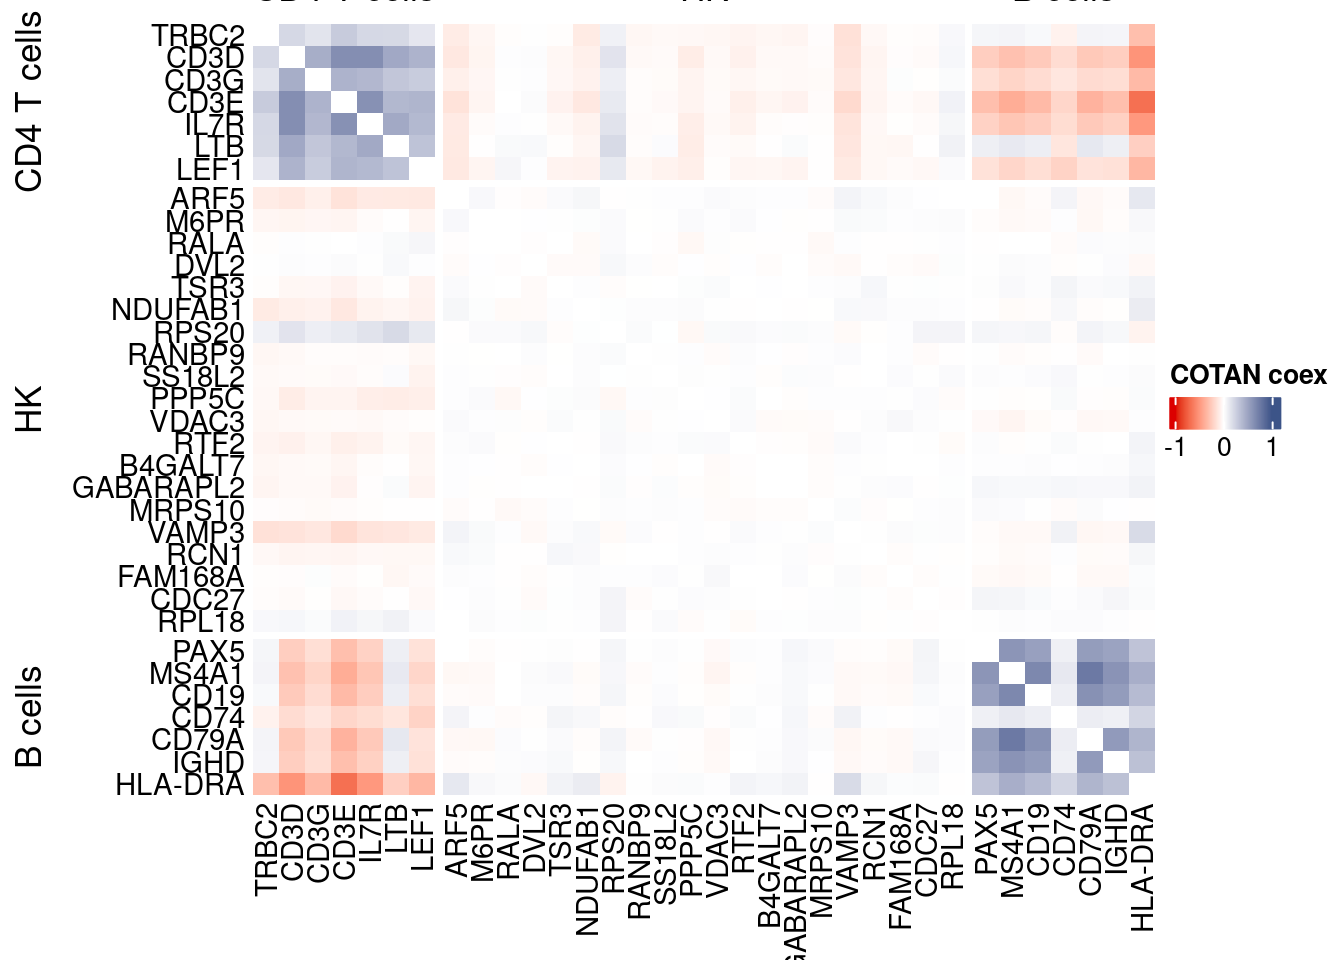
GDI_DF <- calculateGDI(obj)
GDI_DF$geneType <- NA
for (cat in names(genesList)) {
  GDI_DF[rownames(GDI_DF) %in% genesList[[cat]],]$geneType <- cat
}

GDI_DF$GDI_centered <- scale(GDI_DF$GDI,center = T,scale = T)

GDI_DF[genesFromListExpressed,]
sum.raw.norm GDI exp.cells geneType GDI_centered
TRBC2 9.268317 4.235730 66.107327 CD4 T cells 3.254735265
CD3D 9.287078 4.682107 60.774215 CD4 T cells 3.875268462
CD3G 8.346540 3.960945 41.136401 CD4 T cells 2.872741434
CD3E 10.118213 5.013350 74.214986 CD4 T cells 4.335747296
IL7R 9.988188 4.549567 61.388935 CD4 T cells 3.691017877
LTB 10.512466 4.328119 79.066290 CD4 T cells 3.383170388
LEF1 8.530189 4.178575 39.026416 CD4 T cells 3.175280307
PAX5 5.663890 3.385440 3.621864 B cells 2.072700245
MS4A1 7.860168 3.764062 8.340256 B cells 2.599043574
CD19 6.118075 3.476141 4.585479 B cells 2.198787663
CD74 11.586538 2.965525 84.249875 B cells 1.488952647
CD79A 8.326966 3.638378 10.333943 B cells 2.424323052
IGHD 6.215234 3.460462 4.352883 B cells 2.176992102
HLA-DRA 9.940785 5.069079 25.020768 B cells 4.413219922
ARF5 8.563852 2.764955 53.214820 hk 1.210128321
M6PR 8.109273 1.974448 40.521681 hk 0.111201816
RALA 7.091094 1.485644 17.743811 hk -0.568312957
DVL2 6.294122 1.629314 8.273800 hk -0.368588242
TSR3 6.766440 1.660841 13.390929 hk -0.324760837
NDUFAB1 7.836478 2.365630 34.108656 hk 0.655004578
RPS20 9.808344 2.495299 85.878053 hk 0.835265447
RANBP9 6.051715 1.479756 6.462868 hk -0.576497224
SS18L2 7.424429 1.449109 24.173451 hk -0.619102198
PPP5C 6.693324 1.669007 11.496926 hk -0.313408563
VDAC3 7.620449 1.512049 27.629174 hk -0.531605309
RTF2 7.706813 1.850551 30.586476 hk -0.061034856
B4GALT7 5.962397 1.557339 6.113972 hk -0.468645637
GABARAPL2 8.264321 1.829995 45.871407 hk -0.089610300
MRPS10 6.725642 1.372117 12.543612 hk -0.726132831
VAMP3 6.672157 3.415034 12.311015 hk 2.113839573
RCN1 5.479894 1.900039 3.887689 hk 0.007760737
FAM168A 5.181261 1.441315 2.857618 hk -0.629936856
CDC27 6.518552 1.504954 10.533311 hk -0.541467710
RPL18 11.765343 1.500865 99.568035 hk -0.547152265
FOXP3 5.328925 1.717890 1.694634 general PBMC markers -0.245454100
TBX21 7.506181 3.363727 12.377471 general PBMC markers 2.042515240
GATA3 7.754832 3.175327 25.386277 general PBMC markers 1.780609377
RUNX1 6.830552 1.818871 13.922579 general PBMC markers -0.105074634
BCL6 5.573306 3.801613 3.804619 general PBMC markers 2.651244912
EOMES 6.740963 2.786757 7.941519 general PBMC markers 1.240436944
EOMES.1 6.740963 2.786757 7.941519 general PBMC markers 1.240436944
TBX21.1 7.506181 3.363727 12.377471 general PBMC markers 2.042515240
BATF3 4.928381 3.949598 2.525336 general PBMC markers 2.856966822
IRF2 7.405137 1.636393 22.030238 general PBMC markers -0.358747504
TCF4 6.485344 3.713117 6.396411 general PBMC markers 2.528221533
STAT5A 7.204020 1.693463 19.355375 general PBMC markers -0.279411377
RUNX3 7.518136 2.211928 21.299219 general PBMC markers 0.441335435
STAT6 7.748654 2.848655 30.254195 general PBMC markers 1.326485148
BATF 6.882812 1.671873 13.025420 general PBMC markers -0.309424467
STAT3 8.160649 1.638273 40.937033 general PBMC markers -0.356133606
TBX21.2 7.506181 3.363727 12.377471 general PBMC markers 2.042515240
TBX21.3 7.506181 3.363727 12.377471 general PBMC markers 2.042515240
IRF8 7.315179 4.073089 11.895664 general PBMC markers 3.028639312
IRF4 5.033643 2.640743 2.641635 general PBMC markers 1.037454696
AHR 6.302230 3.262612 8.290414 general PBMC markers 1.901949759
STAT1 7.896645 1.689712 26.964612 general PBMC markers -0.284625773
IRF4.1 5.033643 2.640743 2.641635 general PBMC markers 1.037454696
RELB 7.201781 3.294886 18.009636 general PBMC markers 1.946815081GDIPlot(obj,GDIIn = GDI_DF, genes = genesList,GDIThreshold = 1.4)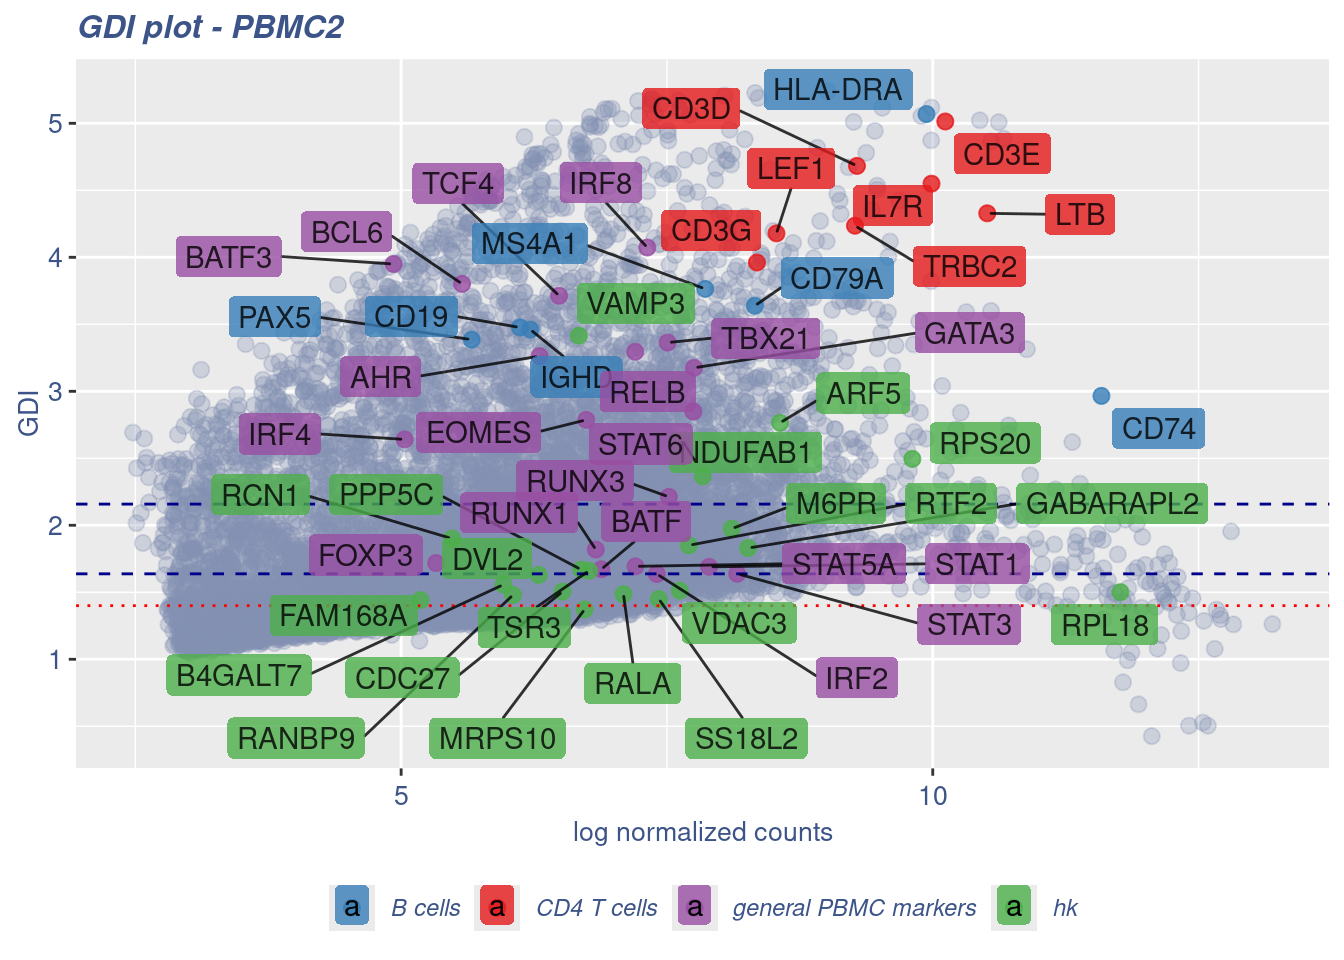
Seurat correlation
srat<- CreateSeuratObject(counts = getRawData(obj),
                          project = project,
                          min.cells = 3,
                          min.features = 200)
srat[["percent.mt"]] <- PercentageFeatureSet(srat, pattern = "^MT-")
srat <- NormalizeData(srat)
srat <- FindVariableFeatures(srat, selection.method = "vst", nfeatures = 2000)

# plot variable features with and without labels
plot1 <- VariableFeaturePlot(srat)

plot1$data$centered_variance <- scale(plot1$data$variance.standardized,
                                      center = T,scale = F)

write.csv(plot1$data,paste0("CoexData/",
                            "Variance_Seurat_genes",
                            getMetadataElement(obj,
                                               datasetTags()[["cond"]]),".csv"))

LabelPoints(plot = plot1, points = c(genesList$`CD4 T cells`,genesList$`B cells`,genesList$hk), repel = TRUE)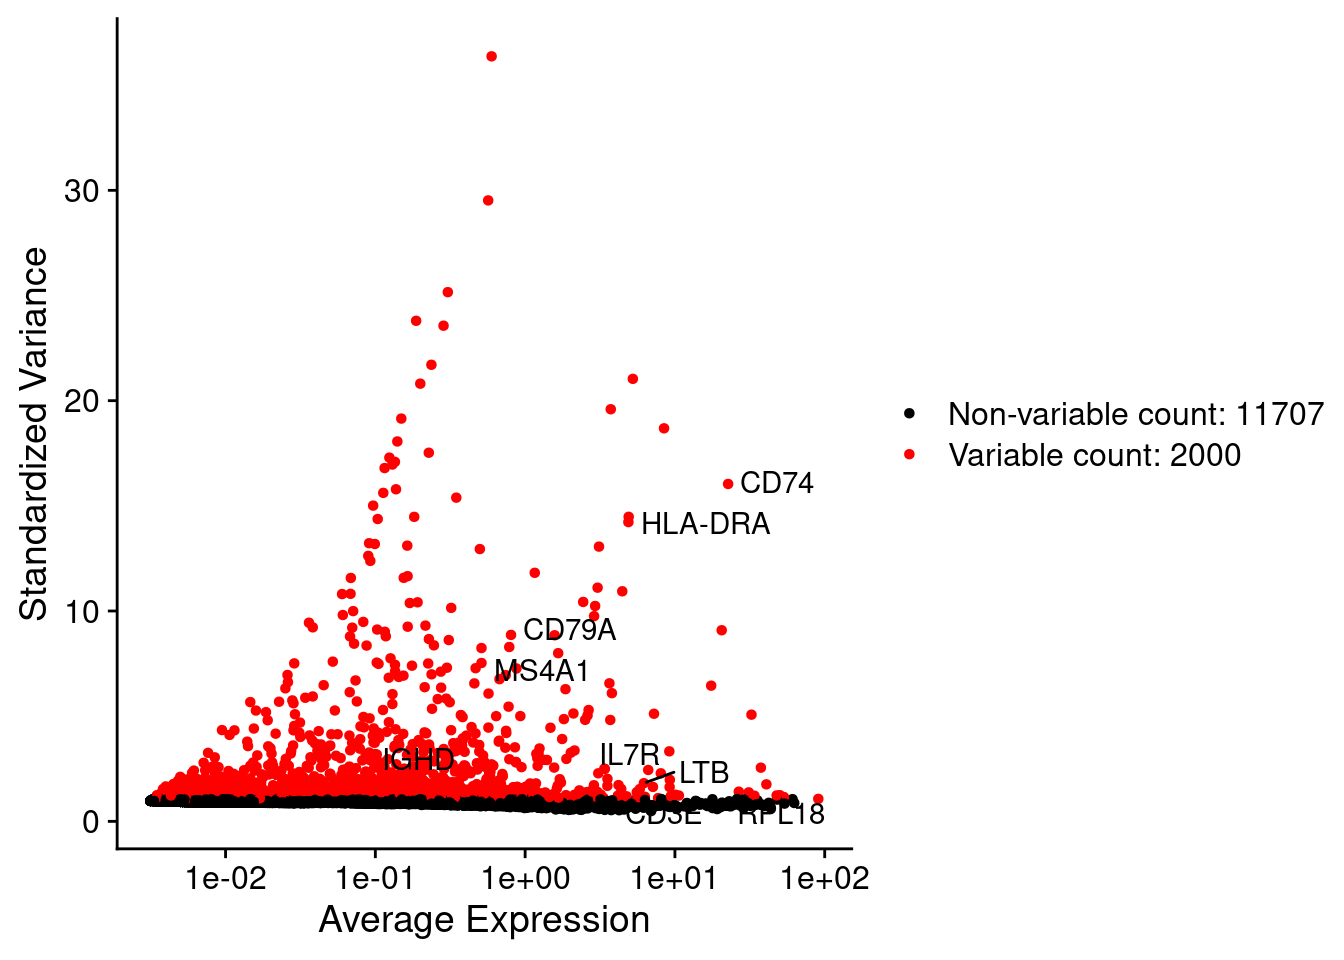
LabelPoints(plot = plot1, points = c(genesList$hk), repel = TRUE)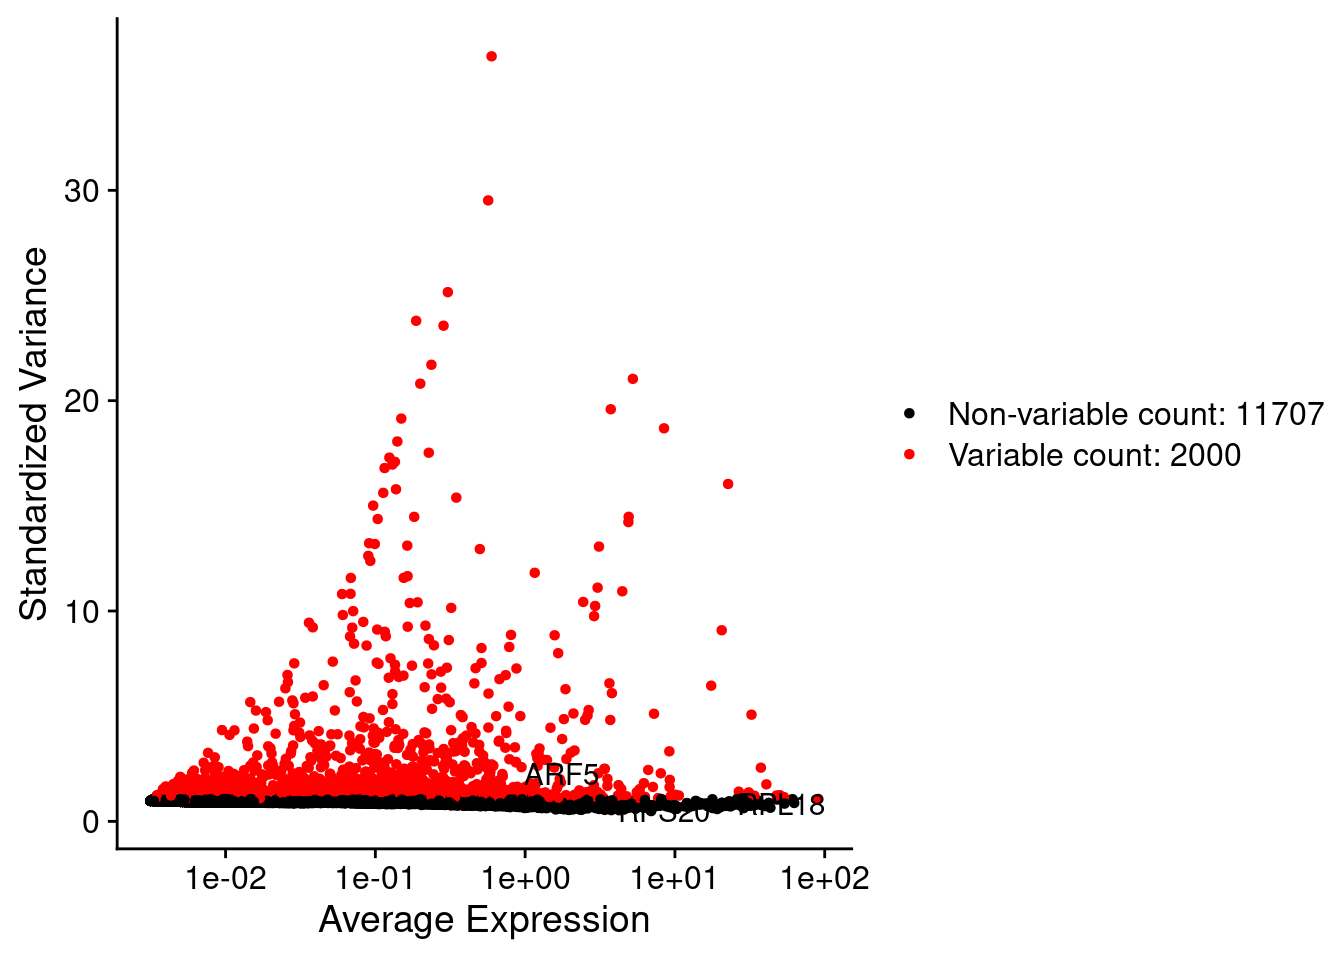
all.genes <- rownames(srat)
srat <- ScaleData(srat, features = all.genes)
seurat.data = GetAssayData(srat[["RNA"]],layer = "data")
corr.pval.list <- correlation_pvalues(data = seurat.data,
genesFromListExpressed,
n.cells = getNumCells(obj))
seurat.data.cor.big <- as.matrix(Matrix::forceSymmetric(corr.pval.list$data.cor, uplo = "U"))
htmp <- correlation_plotPBMC(seurat.data.cor.big,
genesList, title="Seurat corr")
p_values.fromSeurat <- corr.pval.list$p_values
seurat.data.cor.big <- corr.pval.list$data.cor
rm(corr.pval.list)
gc() used (Mb) gc trigger (Mb) max used (Mb)
Ncells 10153227 542.3 17840920 952.9 17840920 952.9
Vcells 251444104 1918.4 579083856 4418.1 723346931 5518.7draw(htmp, heatmap_legend_side="right")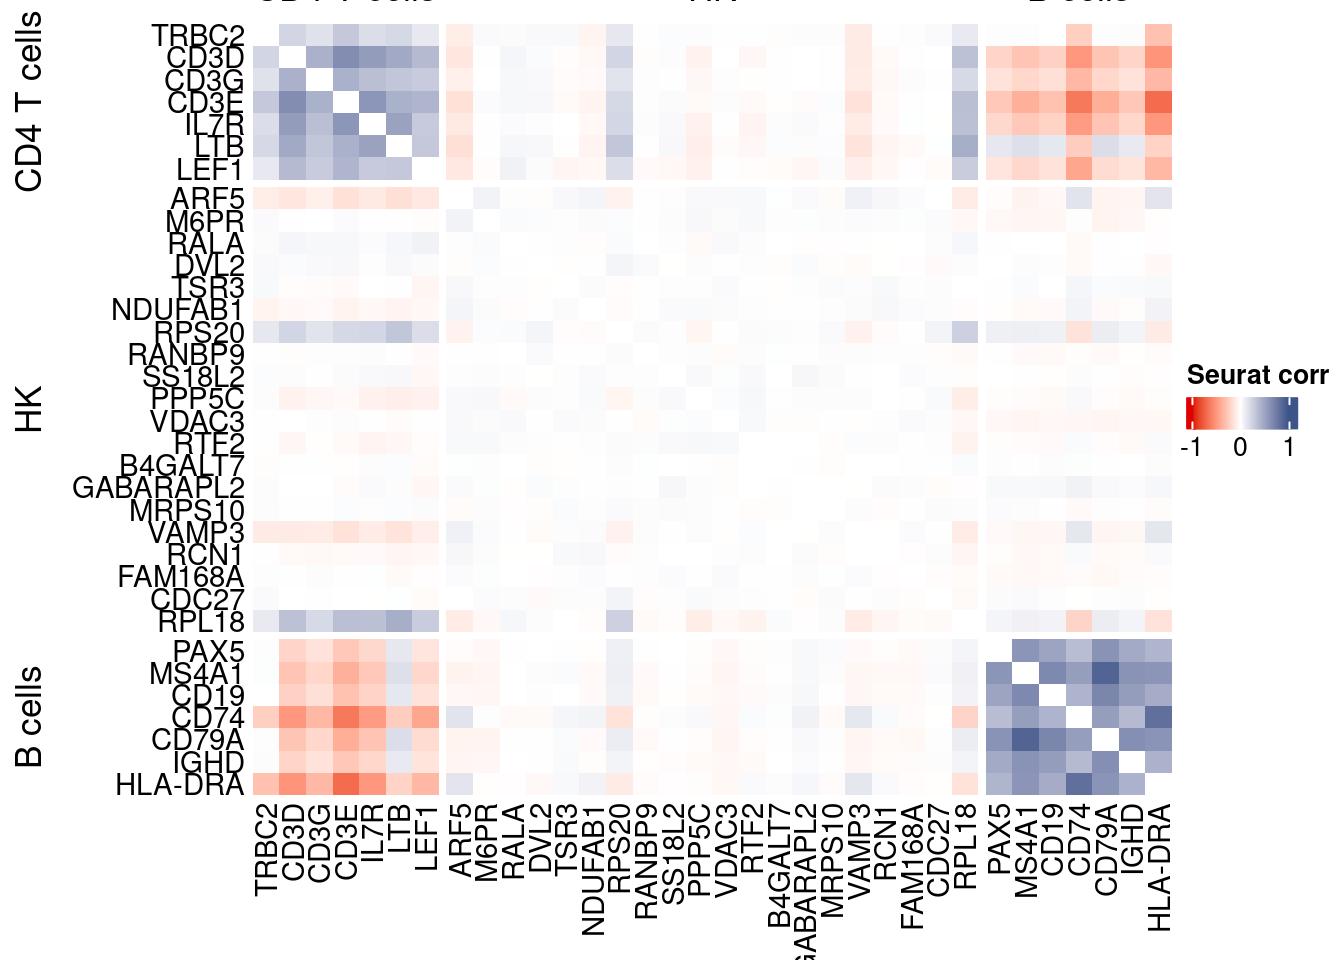
rm(seurat.data.cor.big)
rm(p_values.fromSeurat)
Seurat SC Transform
srat <-  SCTransform(srat,
                     method = "glmGamPoi",
                     vars.to.regress = "percent.mt",
                     verbose = FALSE)

seurat.data <- GetAssayData(srat[["SCT"]],layer = "data")

#Remove genes with all zeros
seurat.data <-seurat.data[rowSums(seurat.data) > 0,]


corr.pval.list <- correlation_pvalues(seurat.data,
                                      genesFromListExpressed,
                                      n.cells = getNumCells(obj))


seurat.data.cor.big <- as.matrix(Matrix::forceSymmetric(corr.pval.list$data.cor, uplo = "U"))

htmp <- correlation_plotPBMC(seurat.data.cor.big,
                         genesList, title="Seurat corr SCT")


p_values.fromSeurat <- corr.pval.list$p_values
seurat.data.cor.big <- corr.pval.list$data.cor

rm(corr.pval.list)
gc()
used (Mb) gc trigger (Mb) max used (Mb)
Ncells 10481752 559.8 17840920 952.9 17840920 952.9
Vcells 297059143 2266.4 694980627 5302.3 723346931 5518.7draw(htmp, heatmap_legend_side="right")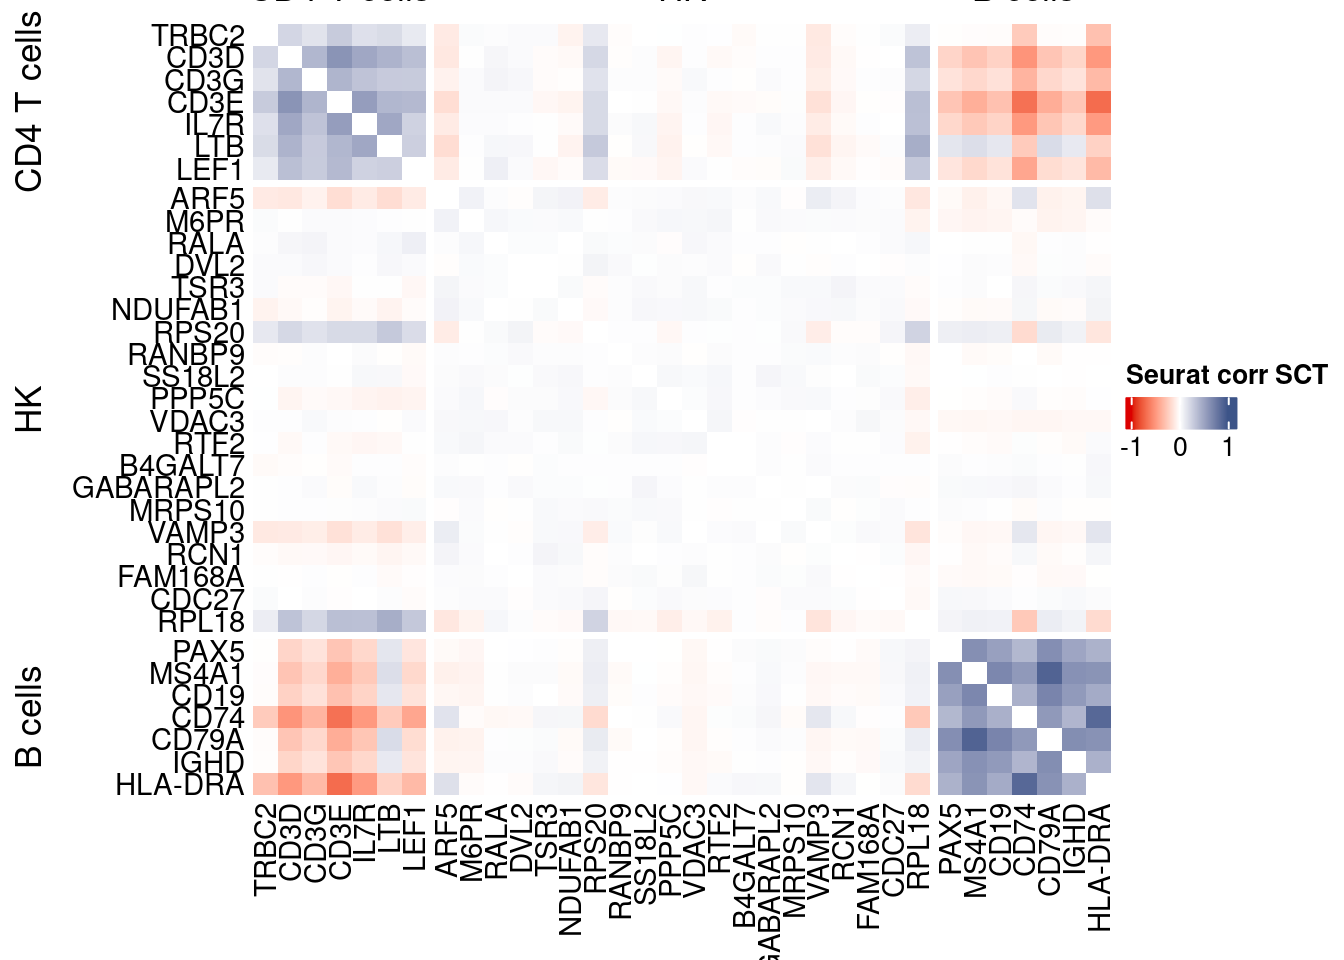
plot1 <- VariableFeaturePlot(srat)

plot1$data$centered_variance <- scale(plot1$data$residual_variance,
center = T,scale = F)write.csv(plot1$data,paste0("CoexData/",
"Variance_SeuratSCT_genes",
getMetadataElement(obj,
datasetTags()[["cond"]]),".csv"))
write_fst(as.data.frame(seurat.data.cor.big),path = paste0("CoexData/SeuratCorrSCT_",file_code,".fst"), compress = 100)
write_fst(as.data.frame(p_values.fromSeurat),path = paste0("CoexData/SeuratPValuesSCT_", file_code,".fst"))
write.csv(as.data.frame(p_values.fromSeurat),paste0("CoexData/SeuratPValuesSCT_", file_code,".csv"))
rm(seurat.data.cor.big)
rm(p_values.fromSeurat)Monocle
library(monocle3)cds <- new_cell_data_set(getRawData(obj),
cell_metadata = getMetadataCells(obj),
gene_metadata = getMetadataGenes(obj)
)
cds <- preprocess_cds(cds, num_dim = 100)
normalized_counts <- normalized_counts(cds)#Remove genes with all zeros
normalized_counts <- normalized_counts[rowSums(normalized_counts) > 0,]
corr.pval.list <- correlation_pvalues(normalized_counts,
genesFromListExpressed,
n.cells = getNumCells(obj))
rm(normalized_counts)
monocle.data.cor.big <- as.matrix(Matrix::forceSymmetric(corr.pval.list$data.cor, uplo = "U"))
htmp <- correlation_plotPBMC(data.cor.big = monocle.data.cor.big,
genesList,
title = "Monocle corr")
p_values.from.monocle <- corr.pval.list$p_values
monocle.data.cor.big <- corr.pval.list$data.cor
rm(corr.pval.list)
gc() used (Mb) gc trigger (Mb) max used (Mb)
Ncells 10668005 569.8 17840920 952.9 17840920 952.9
Vcells 299389405 2284.2 694980627 5302.3 723346931 5518.7draw(htmp, heatmap_legend_side="right")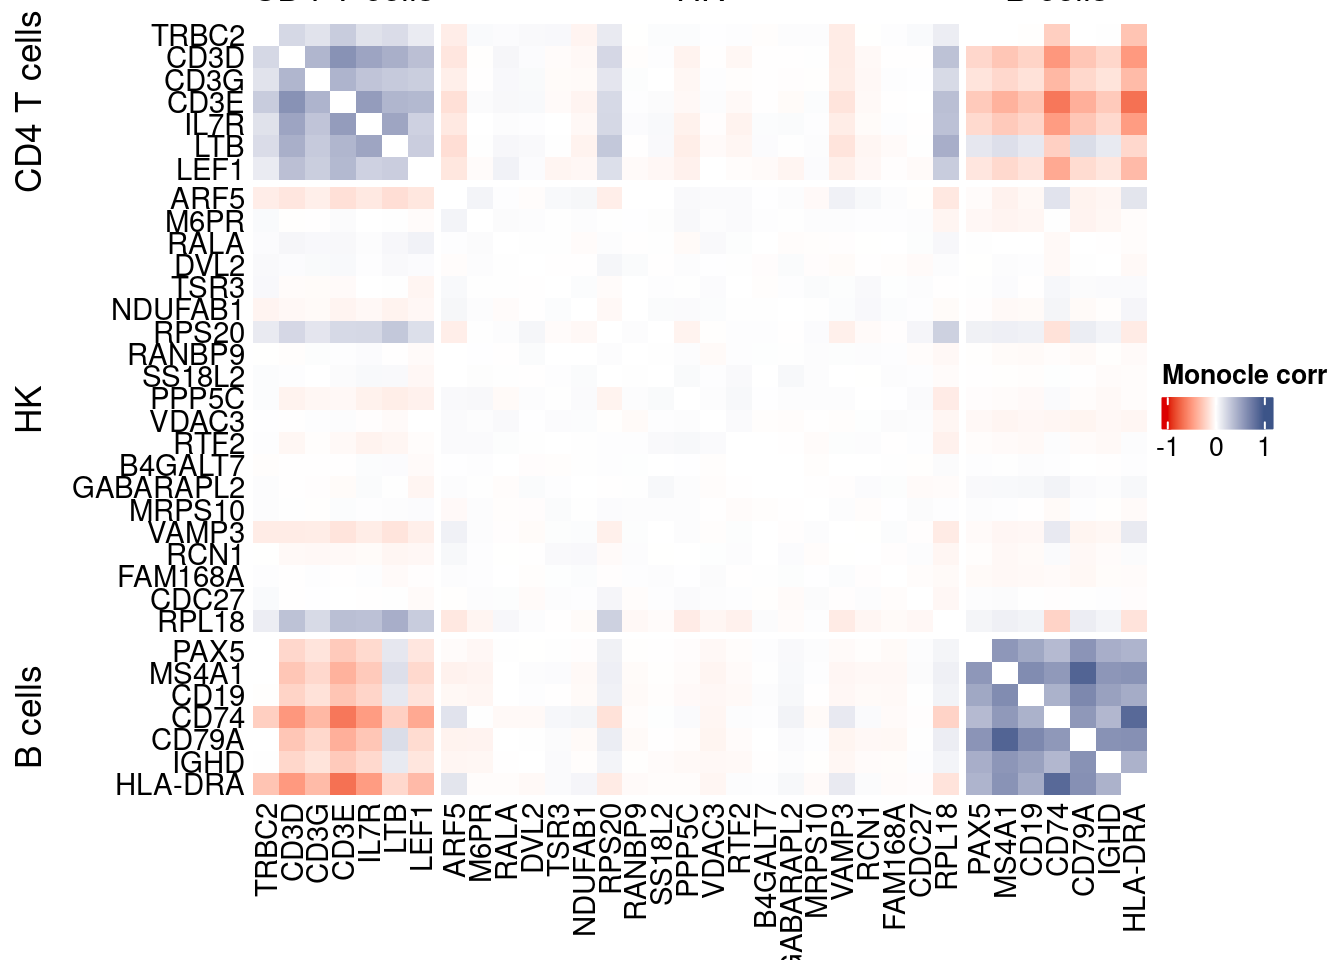
Cs-Core
devtools::load_all("../CS-CORE/")Convert to Seurat obj
sceObj <- convertToSingleCellExperiment(obj)

# Correct: assay=NULL (or omit), data=NULL (since no logcounts)
seuratObj <- as.Seurat(
  x       = sceObj,
  counts  = "counts",
  data    = NULL,
  assay   = NULL,      # IMPORTANT: do NOT set to "RNA" here
  project = "COTAN"
)

# as.Seurat(SCE) creates assay "originalexp" by default; rename it to RNA
seuratObj <- RenameAssays(seuratObj, originalexp = "RNA", verbose = FALSE)
DefaultAssay(seuratObj) <- "RNA"

# Optional: keep COTAN payload
seuratObj@misc$COTAN <- S4Vectors::metadata(sceObj)
Extract CS_CORE corr matrix
#seuratObj@assays$RNA@counts <- ceiling(seuratObj@assays$RNA@counts)
csCoreRes <- CSCORE(seuratObj, genes = genesFromListExpressed)
[INFO] IRLS converged after 3 iterations.
[INFO] Starting WLS for covariance at Wed Jan 21 12:10:24 2026
[INFO] 10 among 58 genes have invalid variance estimates. Their co-expressions with other genes were set to 0.
[INFO] 1.3309% co-expression estimates were greater than 1 and were set to 1.
[INFO] 0.4840% co-expression estimates were smaller than -1 and were set to -1.
[INFO] Finished WLS. Elapsed time: 0.6535 seconds.mat <- as.matrix(csCoreRes$est)
diag(mat) <- 0
split.genes <- base::factor(c(rep("CD4 T cells",sum(genesList[["CD4 T cells"]] %in% genesFromListExpressed)),
rep("HK",sum(genesList[["hk"]] %in% genesFromListExpressed)),
rep("B cells",sum(genesList[["B cells"]] %in% genesFromListExpressed))
),
levels = c("CD4 T cells","HK","B cells"))
f1 = colorRamp2(seq(-1,1, length = 3), c("#DC0000B2", "white","#3C5488B2" ))
htmp <- Heatmap(as.matrix(mat[c(genesList$`CD4 T cells`,genesList$hk,genesList$`B cells`),c(genesList$`CD4 T cells`,genesList$hk,genesList$`B cells`)]),
#width = ncol(coexMat)*unit(2.5, "mm"),
height = nrow(mat)*unit(3, "mm"),
cluster_rows = FALSE,
cluster_columns = FALSE,
col = f1,
row_names_side = "left",
row_names_gp = gpar(fontsize = 11),
column_names_gp = gpar(fontsize = 11),
column_split = split.genes,
row_split = split.genes,
cluster_row_slices = FALSE,
cluster_column_slices = FALSE,
heatmap_legend_param = list(
title = "CS-CORE", at = c(-1, 0, 1),
direction = "horizontal",
labels = c("-1", "0", "1")
)
)
draw(htmp, heatmap_legend_side="right")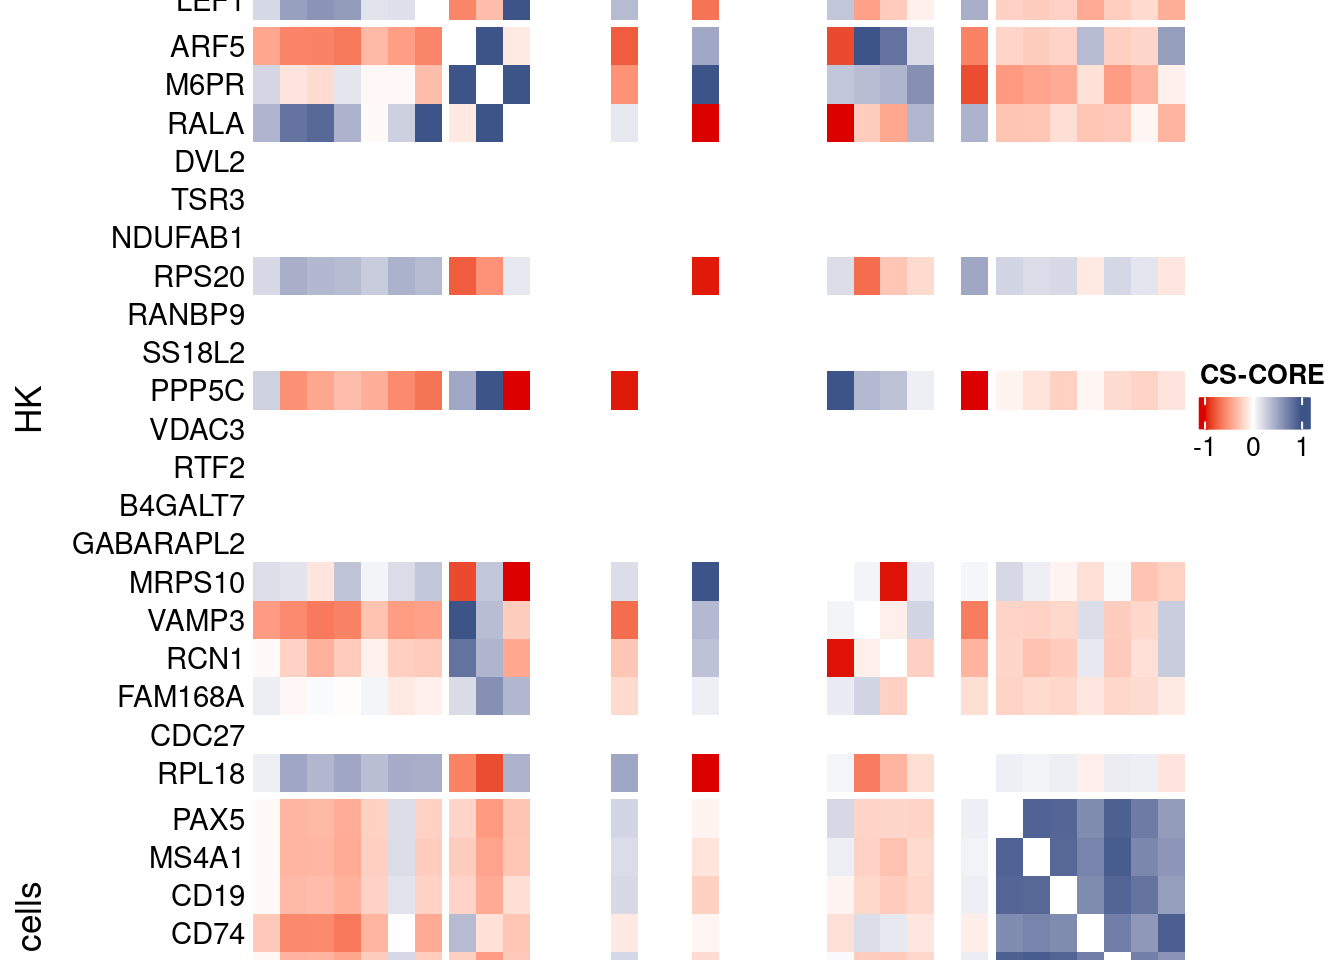
Save CS_CORE matrix
write_fst(as.data.frame(csCoreRes$est), path = paste0("CoexData/CS_CORECorr_", file_code,".fst"),compress = 100)
write_fst(as.data.frame(csCoreRes$p_value), path = paste0("CoexData/CS_COREPValues_", file_code,".fst"),compress = 100)
write.csv(as.data.frame(csCoreRes$p_value), paste0("CoexData/CS_COREPValues_", file_code,".csv"))
Baseline: Spearman on UMI counts
corr.pval.list <- correlation_pvaluesSpearman(data = getRawData(obj),
                                      genesFromListExpressed,
                                      n.cells = getNumCells(obj))

data.cor.big <- as.matrix(Matrix::forceSymmetric(corr.pval.list$data.cor, uplo = "U"))

htmp <- correlation_plot(data.cor.big,
                         genesList, title="UMI baseline S. corr")


p_values.fromSp.C <- corr.pval.list$p_values
data.cor.bigSp.C <- corr.pval.list$data.cor

rm(corr.pval.list)
gc()
used (Mb) gc trigger (Mb) max used (Mb)
Ncells 10795403 576.6 17840920 952.9 17840920 952.9
Vcells 299710423 2286.7 694980627 5302.3 723346931 5518.7draw(htmp, heatmap_legend_side="right")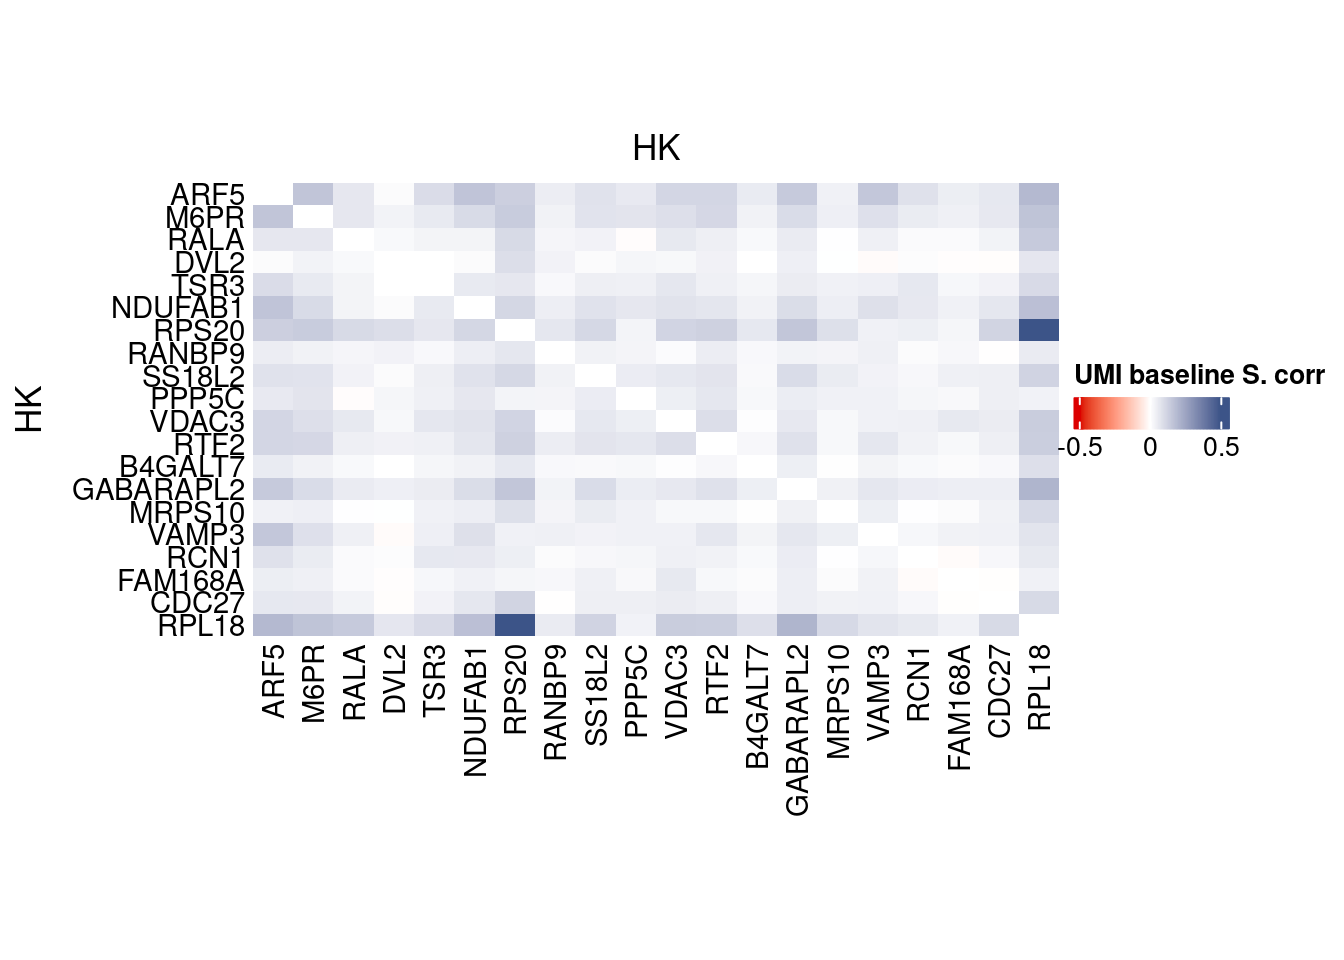
write.csv(as.data.frame(p_values.fromSp.C), paste0("CoexData/BaselineUMISpCorrPValues_", file_code,".csv"))Baseline: Pearson on binarized counts
corr.pval.list <- correlation_pvalues(data = getZeroOneProj(obj),
                                      genesFromListExpressed,
                                      n.cells = getNumCells(obj))

data.cor.big <- as.matrix(Matrix::forceSymmetric(corr.pval.list$data.cor, uplo = "U"))

htmp <- correlation_plotPBMC(data.cor.big,
                         genesList, title="Zero-one P. corr")


p_values.fromSp.C <- corr.pval.list$p_values
data.cor.bigSp.C <- corr.pval.list$data.cor

rm(corr.pval.list)
gc()
used (Mb) gc trigger (Mb) max used (Mb)
Ncells 10795467 576.6 17840920 952.9 17840920 952.9
Vcells 299711453 2286.7 694980627 5302.3 723346931 5518.7draw(htmp, heatmap_legend_side="right")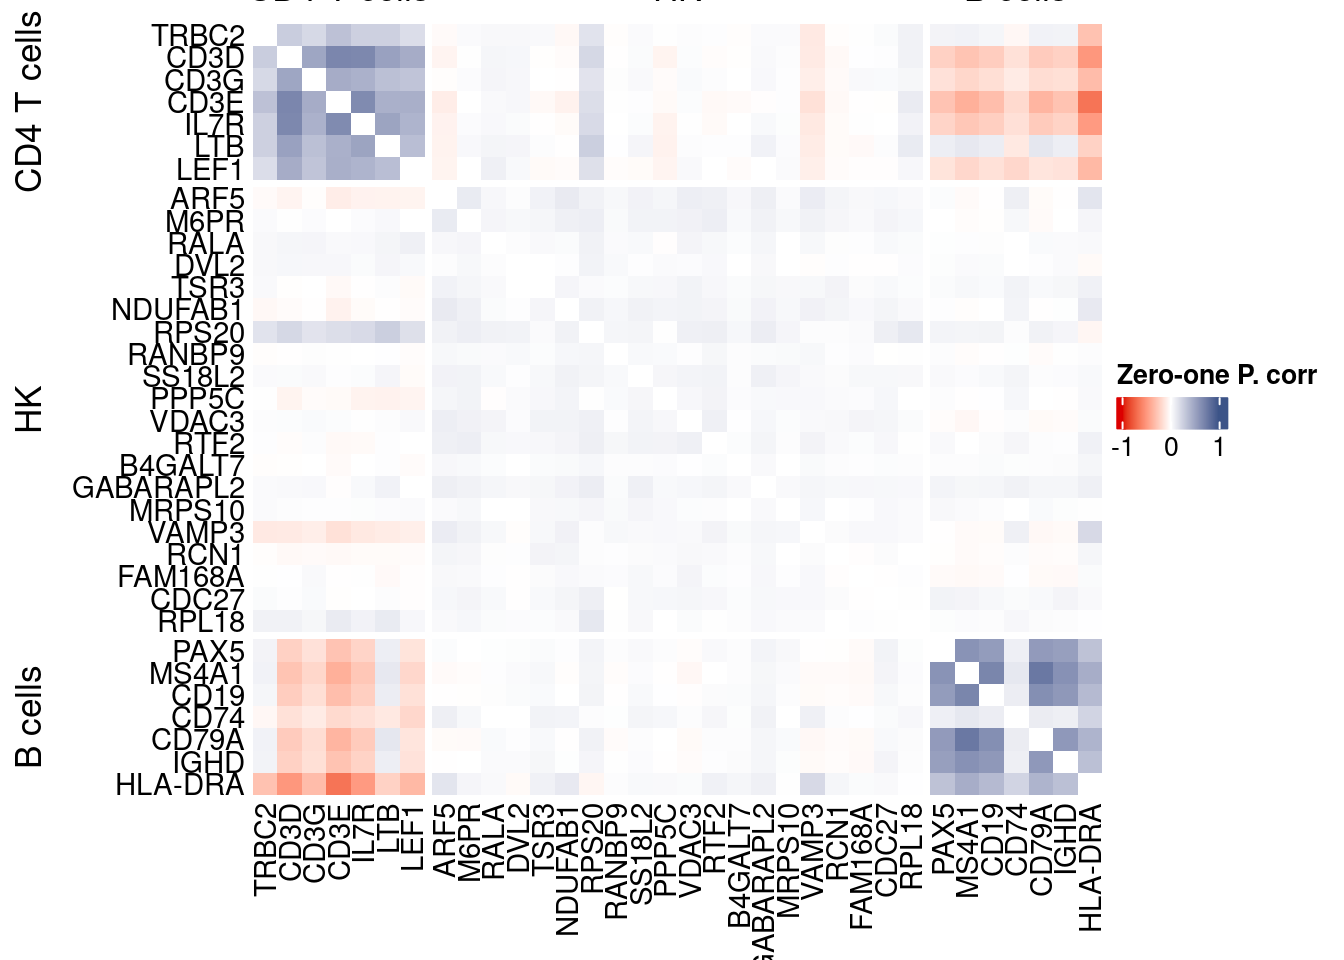
write.csv(as.data.frame(p_values.fromSp.C), paste0("CoexData/ZeroOnePCorrPValues_", file_code,".csv"))Sys.time()[1] "2026-01-21 12:10:32 CET"sessionInfo()R version 4.5.2 (2025-10-31)
Platform: x86_64-pc-linux-gnu
Running under: Ubuntu 22.04.5 LTS
Matrix products: default
BLAS: /usr/lib/x86_64-linux-gnu/blas/libblas.so.3.10.0
LAPACK: /usr/lib/x86_64-linux-gnu/lapack/liblapack.so.3.10.0 LAPACK version 3.10.0
locale:
[1] LC_CTYPE=C.UTF-8 LC_NUMERIC=C LC_TIME=C.UTF-8
[4] LC_COLLATE=C.UTF-8 LC_MONETARY=C.UTF-8 LC_MESSAGES=C.UTF-8
[7] LC_PAPER=C.UTF-8 LC_NAME=C LC_ADDRESS=C
[10] LC_TELEPHONE=C LC_MEASUREMENT=C.UTF-8 LC_IDENTIFICATION=C
time zone: Europe/Rome
tzcode source: system (glibc)
attached base packages:
[1] stats4 parallel grid stats graphics grDevices utils
[8] datasets methods base
other attached packages:
[1] CSCORE_1.0.2 testthat_3.3.2
[3] monocle3_1.3.7 SingleCellExperiment_1.32.0
[5] SummarizedExperiment_1.38.1 GenomicRanges_1.62.1
[7] Seqinfo_1.0.0 IRanges_2.44.0
[9] S4Vectors_0.48.0 MatrixGenerics_1.22.0
[11] matrixStats_1.5.0 Biobase_2.70.0
[13] BiocGenerics_0.56.0 generics_0.1.3
[15] fstcore_0.10.0 fst_0.9.8
[17] stringr_1.6.0 HiClimR_2.2.1
[19] doParallel_1.0.17 iterators_1.0.14
[21] foreach_1.5.2 Rfast_2.1.5.1
[23] RcppParallel_5.1.10 zigg_0.0.2
[25] Rcpp_1.1.0 patchwork_1.3.2
[27] Seurat_5.4.0 SeuratObject_5.3.0
[29] sp_2.2-0 Hmisc_5.2-3
[31] dplyr_1.1.4 circlize_0.4.16
[33] ComplexHeatmap_2.26.0 COTAN_2.11.1
loaded via a namespace (and not attached):
[1] fs_1.6.6 spatstat.sparse_3.1-0
[3] devtools_2.4.5 httr_1.4.7
[5] RColorBrewer_1.1-3 profvis_0.4.0
[7] tools_4.5.2 sctransform_0.4.2
[9] backports_1.5.0 R6_2.6.1
[11] lazyeval_0.2.2 uwot_0.2.3
[13] ggdist_3.3.3 GetoptLong_1.1.0
[15] urlchecker_1.0.1 withr_3.0.2
[17] gridExtra_2.3 parallelDist_0.2.6
[19] progressr_0.18.0 cli_3.6.5
[21] Cairo_1.7-0 spatstat.explore_3.6-0
[23] fastDummies_1.7.5 labeling_0.4.3
[25] S7_0.2.1 spatstat.data_3.1-9
[27] proxy_0.4-29 ggridges_0.5.6
[29] pbapply_1.7-2 foreign_0.8-90
[31] sessioninfo_1.2.3 parallelly_1.46.0
[33] rstudioapi_0.18.0 shape_1.4.6.1
[35] ica_1.0-3 spatstat.random_3.4-3
[37] distributional_0.6.0 dendextend_1.19.0
[39] Matrix_1.7-4 abind_1.4-8
[41] lifecycle_1.0.4 yaml_2.3.10
[43] SparseArray_1.10.8 Rtsne_0.17
[45] glmGamPoi_1.20.0 promises_1.5.0
[47] crayon_1.5.3 miniUI_0.1.2
[49] lattice_0.22-7 beachmat_2.26.0
[51] cowplot_1.2.0 magick_2.9.0
[53] zeallot_0.2.0 pillar_1.11.1
[55] knitr_1.50 rjson_0.2.23
[57] boot_1.3-32 future.apply_1.20.0
[59] codetools_0.2-20 glue_1.8.0
[61] spatstat.univar_3.1-6 remotes_2.5.0
[63] data.table_1.18.0 vctrs_0.7.0
[65] png_0.1-8 spam_2.11-1
[67] Rdpack_2.6.4 gtable_0.3.6
[69] assertthat_0.2.1 cachem_1.1.0
[71] xfun_0.52 rbibutils_2.3
[73] S4Arrays_1.10.1 mime_0.13
[75] reformulas_0.4.1 survival_3.8-3
[77] ncdf4_1.24 ellipsis_0.3.2
[79] fitdistrplus_1.2-2 ROCR_1.0-11
[81] nlme_3.1-168 usethis_3.2.1
[83] RcppAnnoy_0.0.22 rprojroot_2.1.1
[85] GenomeInfoDb_1.44.0 irlba_2.3.5.1
[87] KernSmooth_2.23-26 otel_0.2.0
[89] rpart_4.1.24 colorspace_2.1-1
[91] nnet_7.3-20 tidyselect_1.2.1
[93] compiler_4.5.2 htmlTable_2.4.3
[95] desc_1.4.3 DelayedArray_0.36.0
[97] plotly_4.11.0 checkmate_2.3.2
[99] scales_1.4.0 lmtest_0.9-40
[101] digest_0.6.37 goftest_1.2-3
[103] spatstat.utils_3.2-1 minqa_1.2.8
[105] rmarkdown_2.29 XVector_0.50.0
[107] htmltools_0.5.8.1 pkgconfig_2.0.3
[109] base64enc_0.1-3 lme4_1.1-37
[111] sparseMatrixStats_1.20.0 fastmap_1.2.0
[113] rlang_1.1.7 GlobalOptions_0.1.2
[115] htmlwidgets_1.6.4 ggthemes_5.2.0
[117] UCSC.utils_1.4.0 shiny_1.12.1
[119] DelayedMatrixStats_1.30.0 farver_2.1.2
[121] zoo_1.8-14 jsonlite_2.0.0
[123] BiocParallel_1.44.0 BiocSingular_1.26.1
[125] magrittr_2.0.4 Formula_1.2-5
[127] GenomeInfoDbData_1.2.14 dotCall64_1.2
[129] viridis_0.6.5 reticulate_1.44.1
[131] stringi_1.8.7 brio_1.1.5
[133] MASS_7.3-65 pkgbuild_1.4.7
[135] plyr_1.8.9 listenv_0.10.0
[137] ggrepel_0.9.6 deldir_2.0-4
[139] splines_4.5.2 tensor_1.5
[141] igraph_2.2.1 spatstat.geom_3.6-1
[143] RcppHNSW_0.6.0 pkgload_1.4.0
[145] reshape2_1.4.4 ScaledMatrix_1.16.0
[147] evaluate_1.0.5 nloptr_2.2.1
[149] httpuv_1.6.16 RANN_2.6.2
[151] tidyr_1.3.1 purrr_1.2.0
[153] polyclip_1.10-7 future_1.69.0
[155] clue_0.3-66 scattermore_1.2
[157] ggplot2_4.0.1 rsvd_1.0.5
[159] xtable_1.8-4 RSpectra_0.16-2
[161] later_1.4.2 viridisLite_0.4.2
[163] tibble_3.3.0 memoise_2.0.1
[165] cluster_2.1.8.1 globals_0.18.0