library(COTAN)
library(ComplexHeatmap)
library(circlize)
library(dplyr)
library(Hmisc)
library(Seurat)
library(patchwork)
library(Rfast)
library(parallel)
library(doParallel)
library(HiClimR)
library(stringr)
library(fst)

options(parallelly.fork.enable = TRUE)

dataFile <- "Data/PBMC1/COTAN/PBMC1.cotan.RDS"
name <- str_split(dataFile,pattern = "/",simplify = T)[4]
name <- str_remove(name,pattern = ".cotan.RDS")

project = name

setLoggingLevel(1)
outDir <- "CoexData/"
setLoggingFile(paste0(outDir, "Logs/",name,".log"))

obj <- readRDS(dataFile)
file_code = nameGene Correlation Analysis for PBMC 1
Prologue
source("src/Functions.R")To compare the ability of COTAN to asses the real correlation between genes we define some pools of genes:
- Constitutive genes
- Neural progenitor genes
- Pan neuronal genes
- Some layer marker genes
hkGenes  <- read.csv("Data/Housekeeping_TranscriptsHuman.csv", sep = ";")

genesList <- list(
  "CD4 T cells"=
    c("TRBC2","CD3D","CD3G","CD3E","IL7R","LTB","LEF1"),
  "B cells"=
    c("PAX5","MS4A1","CD19","CD74","CD79A","IGHD","HLA-DRA"),
  "hk"= hkGenes$Gene_symbol[1:20], # from https://housekeeping.unicamp.br/
  "general PBMC markers" =
  c("FOXP3","TBX21","GATA3","RUNX1","BCL6","EOMES","EOMES","TBX21","BATF3","IRF2","TCF4","STAT5A","RUNX3","STAT6","BATF","STAT3","TBX21","TBX21","IRF8","IRF4","AHR","STAT1","IRF4","RELB")
)
COTAN
genesFromListExpressed <- unlist(genesList)[unlist(genesList) %in% getGenes(obj)]
int.genes <-getGenes(obj)
obj <- proceedToCoex(obj, calcCoex = TRUE, cores = 5L, saveObj = FALSE)coexMat.big <- getGenesCoex(obj)[genesFromListExpressed,genesFromListExpressed]
coexMat <- getGenesCoex(obj)[c(genesList$`CD4 T cells`,genesList$hk,genesList$`B cells`),c(genesList$`CD4 T cells`,genesList$hk,genesList$`B cells`)]
f1 = colorRamp2(seq(-1,1, length = 3), c("#DC0000B2", "white","#3C5488B2" ))
split.genes <- base::factor(c(rep("CD4 T cells",length(genesList[["CD4 T cells"]])),
rep("HK",length(genesList[["hk"]])),
rep("B cells",length(genesList[["B cells"]]))
),
levels = c("CD4 T cells","HK","B cells"))
lgd = Legend(col_fun = f1, title = "COTAN coex")
htmp <- Heatmap(as.matrix(coexMat),
#width = ncol(coexMat)*unit(2.5, "mm"),
height = nrow(coexMat)*unit(3, "mm"),
cluster_rows = FALSE,
cluster_columns = FALSE,
col = f1,
row_names_side = "left",
row_names_gp = gpar(fontsize = 11),
column_names_gp = gpar(fontsize = 11),
column_split = split.genes,
row_split = split.genes,
cluster_row_slices = FALSE,
cluster_column_slices = FALSE,
heatmap_legend_param = list(
title = "COTAN coex", at = c(-1, 0, 1),
direction = "horizontal",
labels = c("-1", "0", "1")
)
)
draw(htmp, heatmap_legend_side="right")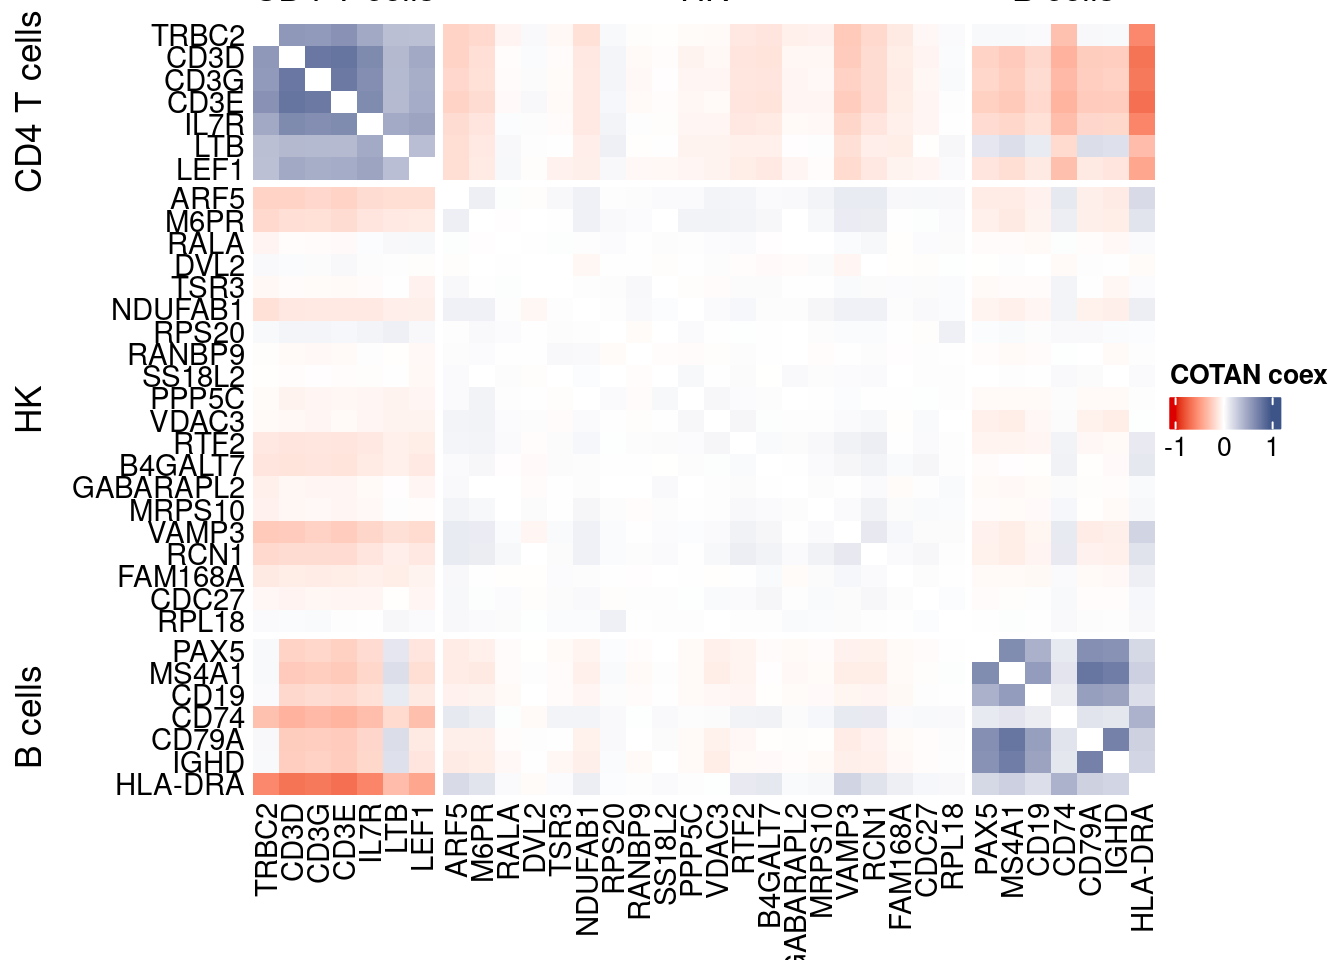
GDI_DF <- calculateGDI(obj)
GDI_DF$geneType <- NA
for (cat in names(genesList)) {
  GDI_DF[rownames(GDI_DF) %in% genesList[[cat]],]$geneType <- cat
}

GDI_DF$GDI_centered <- scale(GDI_DF$GDI,center = T,scale = T)

GDI_DF[genesFromListExpressed,]
sum.raw.norm GDI exp.cells geneType GDI_centered
TRBC2 9.318648 5.019290 59.002770 CD4 T cells 3.60686078
CD3D 9.174123 4.958775 54.626039 CD4 T cells 3.53414007
CD3G 8.717750 4.892975 49.833795 CD4 T cells 3.45506807
CD3E 9.121150 5.019421 55.595568 CD4 T cells 3.60701788
IL7R 9.431567 4.659392 46.232687 CD4 T cells 3.17437355
LTB 10.179037 4.250804 70.166205 CD4 T cells 2.68337770
LEF1 7.777441 4.261671 29.224377 CD4 T cells 2.69643600
PAX5 5.838880 3.154456 4.792244 B cells 1.36590578
MS4A1 7.978576 3.482523 9.972299 B cells 1.76014130
CD19 5.387194 2.886280 3.822715 B cells 1.04364118
CD74 10.829797 3.831775 78.337950 B cells 2.17983331
CD79A 8.237178 3.457366 10.554017 B cells 1.72990959
IGHD 7.365299 3.384814 6.398892 B cells 1.64272415
HLA-DRA 10.618674 4.866629 52.299169 B cells 3.42340886
ARF5 7.878454 3.413407 47.617729 hk 1.67708456
M6PR 7.947537 3.197207 50.415512 hk 1.41727937
RALA 6.998925 1.736058 24.875346 hk -0.33857059
DVL2 5.790818 1.486203 8.088643 hk -0.63882011
TSR3 7.082538 1.610244 28.282548 hk -0.48976097
NDUFAB1 7.780724 2.612335 47.423823 hk 0.71444357
RPS20 10.601140 1.411652 99.058172 hk -0.72840751
RANBP9 6.322084 1.447280 13.850416 hk -0.68559335
SS18L2 7.283227 1.426617 32.465374 hk -0.71042379
PPP5C 6.045464 1.649275 10.886427 hk -0.44285718
VDAC3 7.434245 1.896815 36.703601 hk -0.14539065
RTF2 7.680190 2.575363 44.349030 hk 0.67001389
B4GALT7 6.046041 2.346140 11.191136 hk 0.39455938
GABARAPL2 8.034618 1.647753 55.290859 hk -0.44468639
MRPS10 7.070890 1.777199 26.454294 hk -0.28913189
VAMP3 6.865062 3.612492 21.772853 hk 1.91632300
RCN1 5.777433 3.244676 8.919668 hk 1.47432253
FAM168A 5.448435 2.086499 6.149584 hk 0.08255083
CDC27 6.622200 1.702828 18.116343 hk -0.37850287
RPL18 11.459360 1.201743 99.750693 hk -0.98065323
FOXP3 4.295358 1.769448 1.218837 general PBMC markers -0.29844654
TBX21 6.623233 3.330908 10.332410 general PBMC markers 1.57794613
GATA3 7.025946 3.615094 20.415512 general PBMC markers 1.91945055
RUNX1 7.110799 1.886179 26.398892 general PBMC markers -0.15817246
BCL6 6.303498 3.637011 12.493075 general PBMC markers 1.94578717
EOMES 6.046419 2.889267 6.675900 general PBMC markers 1.04722963
EOMES.1 6.046419 2.889267 6.675900 general PBMC markers 1.04722963
TBX21.1 6.623233 3.330908 10.332410 general PBMC markers 1.57794613
BATF3 5.272880 3.852294 5.595568 general PBMC markers 2.20449110
IRF2 7.399057 2.600365 33.878116 general PBMC markers 0.70005937
TCF4 7.119605 3.325291 13.462604 general PBMC markers 1.57119582
STAT5A 6.985411 2.919544 24.542936 general PBMC markers 1.08361390
RUNX3 7.766113 2.908153 37.036011 general PBMC markers 1.06992544
STAT6 7.501164 3.876722 34.709141 general PBMC markers 2.23384613
BATF 6.690977 2.111175 16.952909 general PBMC markers 0.11220332
STAT3 8.247052 1.510000 58.642659 general PBMC markers -0.61022274
TBX21.2 6.623233 3.330908 10.332410 general PBMC markers 1.57794613
TBX21.3 6.623233 3.330908 10.332410 general PBMC markers 1.57794613
IRF8 7.473205 4.206197 24.819945 general PBMC markers 2.62977301
IRF4 5.666437 2.390369 6.592798 general PBMC markers 0.44770921
AHR 7.047946 3.897268 23.518006 general PBMC markers 2.25853661
STAT1 8.006755 2.583814 41.024931 general PBMC markers 0.68016993
IRF4.1 5.666437 2.390369 6.592798 general PBMC markers 0.44770921
RELB 6.407635 2.723722 14.349030 general PBMC markers 0.84829566GDIPlot(obj,GDIIn = GDI_DF, genes = genesList,GDIThreshold = 1.4)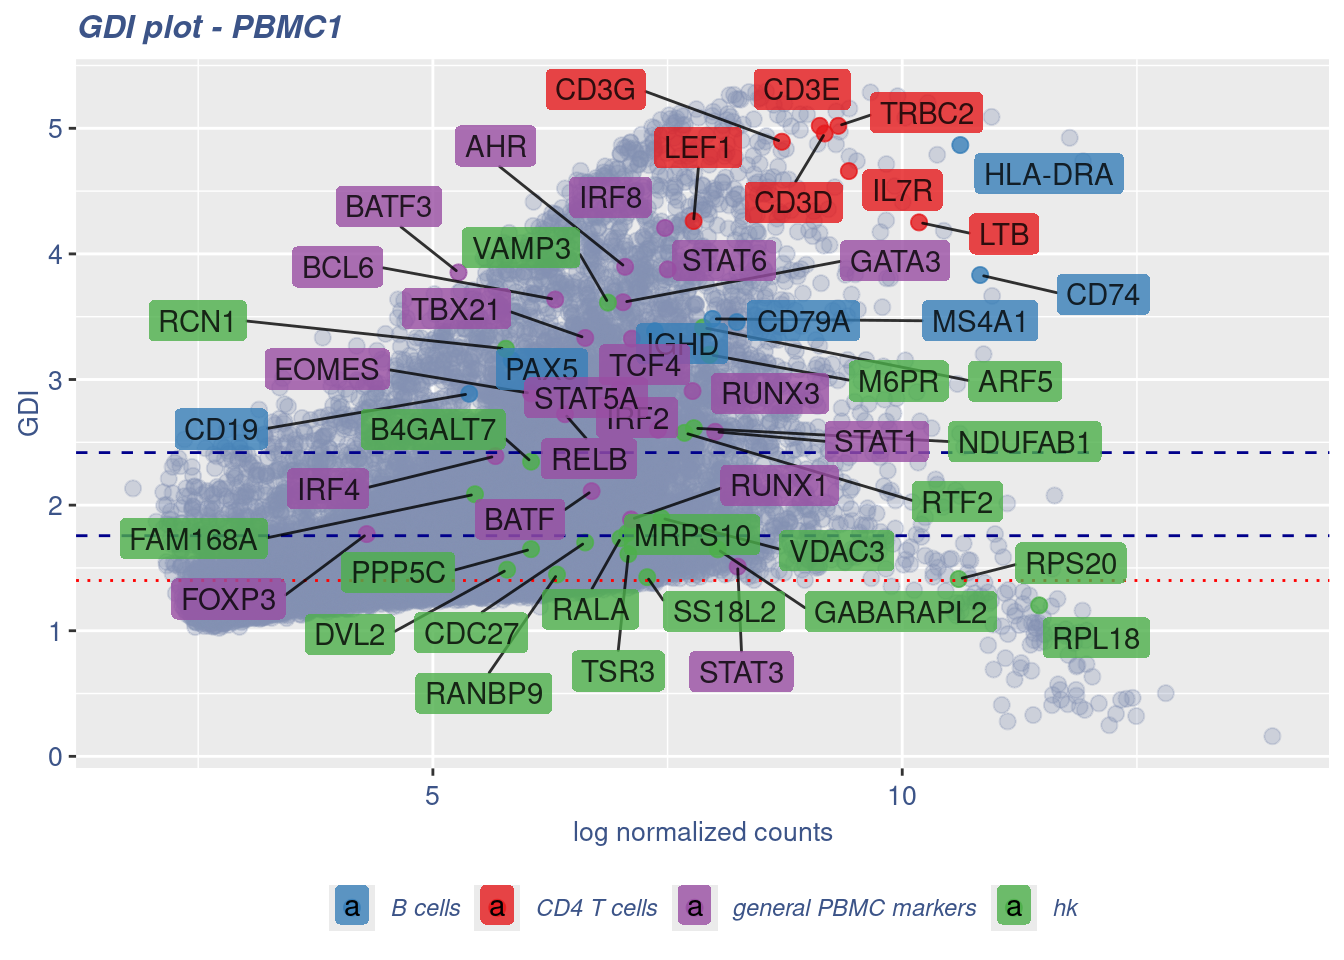
Seurat correlation
srat<- CreateSeuratObject(counts = getRawData(obj),
                          project = project,
                          min.cells = 3,
                          min.features = 200)
srat[["percent.mt"]] <- PercentageFeatureSet(srat, pattern = "^MT-")
srat <- NormalizeData(srat)
srat <- FindVariableFeatures(srat, selection.method = "vst", nfeatures = 2000)

# plot variable features with and without labels
plot1 <- VariableFeaturePlot(srat)

plot1$data$centered_variance <- scale(plot1$data$variance.standardized,
                                      center = T,scale = F)

write.csv(plot1$data,paste0("CoexData/",
                            "Variance_Seurat_genes",
                            getMetadataElement(obj,
                                               datasetTags()[["cond"]]),".csv"))

LabelPoints(plot = plot1, points = c(genesList$`CD4 T cells`,genesList$`B cells`,genesList$hk), repel = TRUE)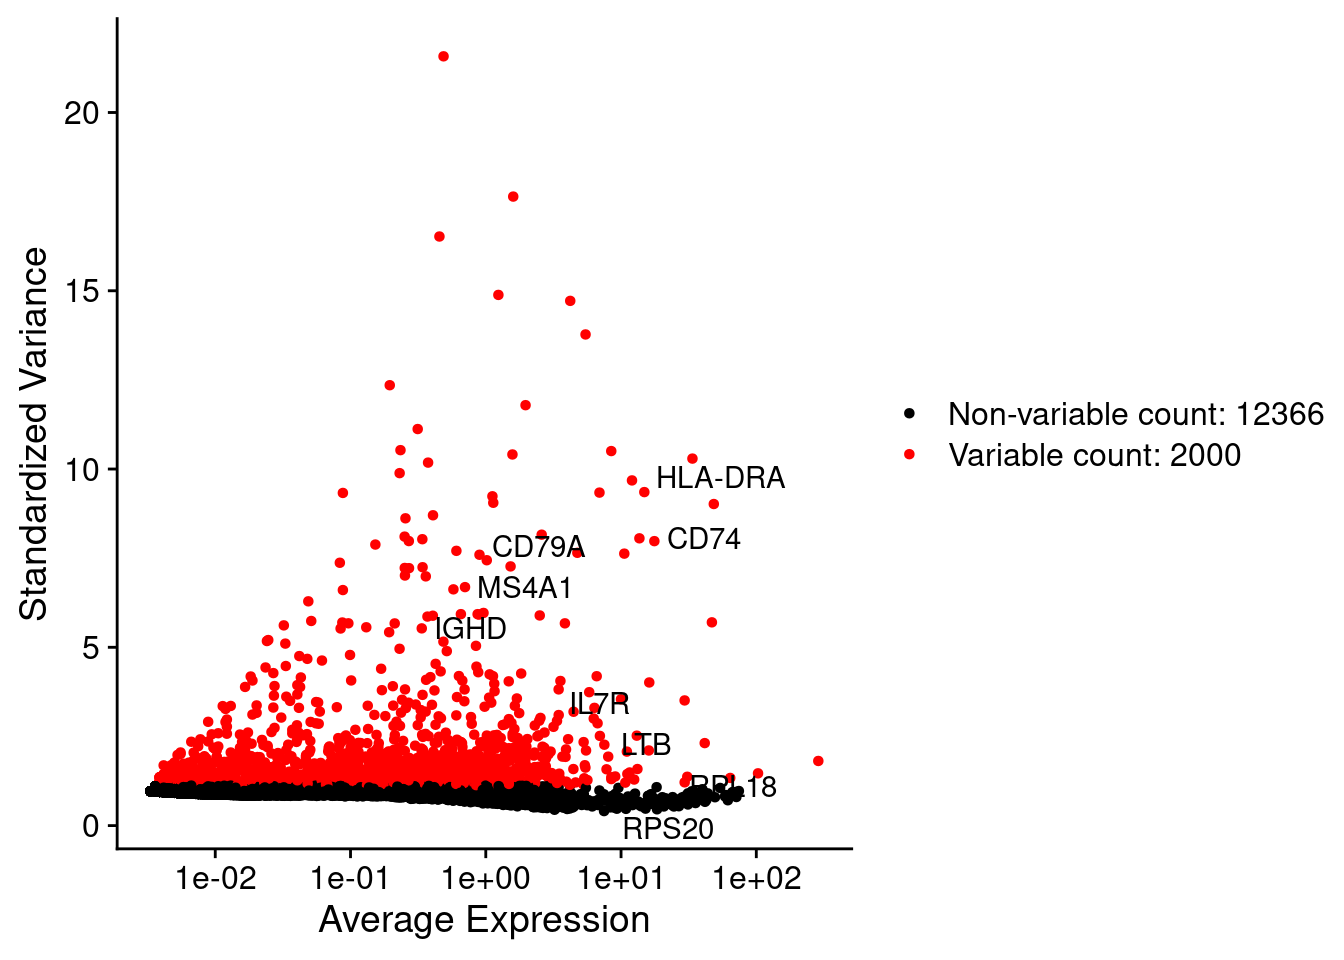
LabelPoints(plot = plot1, points = c(genesList$hk), repel = TRUE)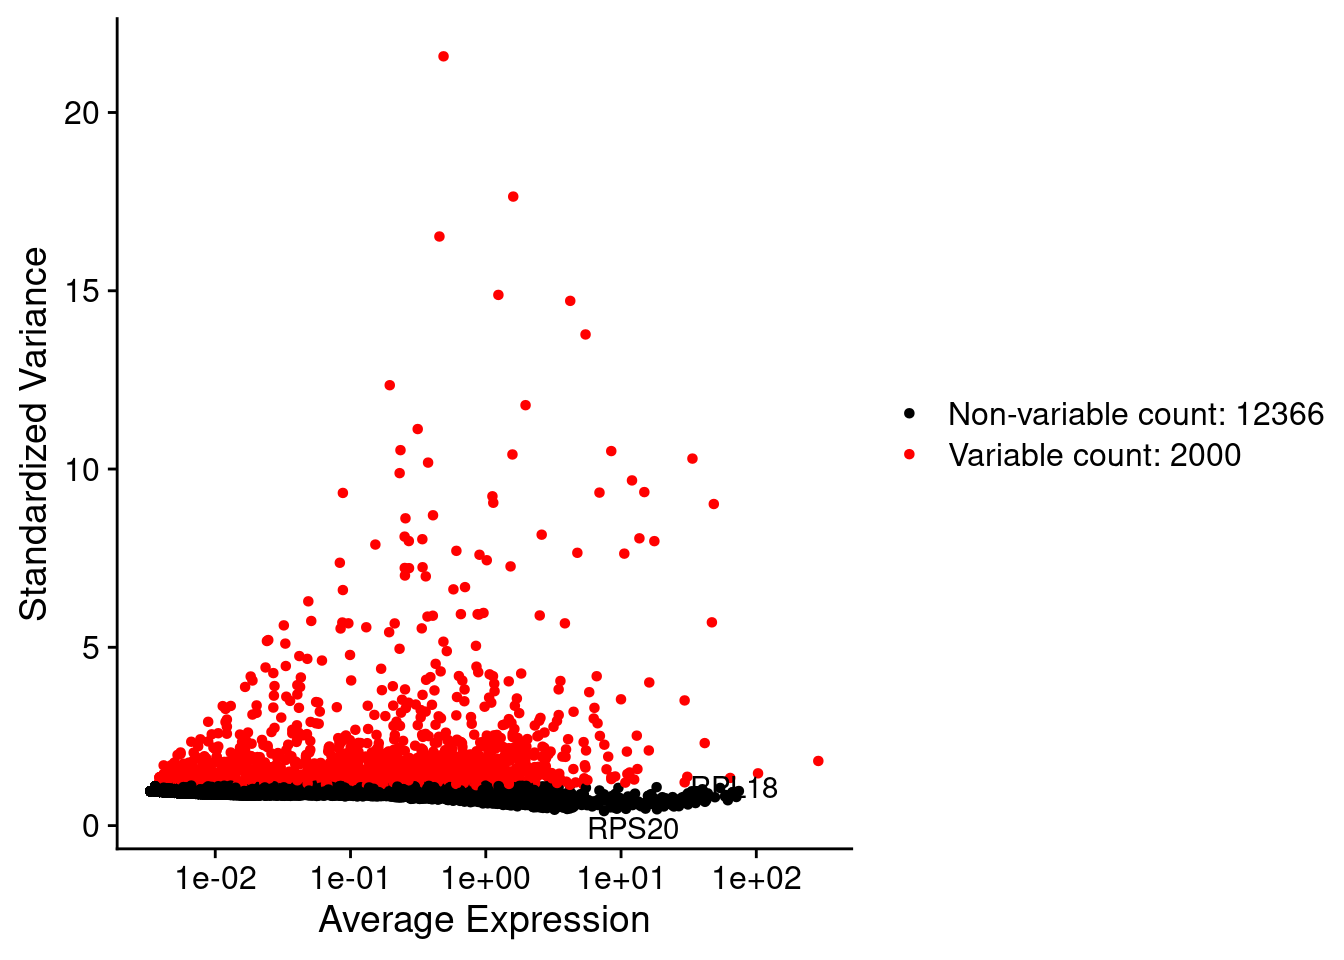
all.genes <- rownames(srat)
srat <- ScaleData(srat, features = all.genes)
seurat.data = GetAssayData(srat[["RNA"]],layer = "data")
corr.pval.list <- correlation_pvalues(data = seurat.data,
genesFromListExpressed,
n.cells = getNumCells(obj))
seurat.data.cor.big <- as.matrix(Matrix::forceSymmetric(corr.pval.list$data.cor, uplo = "U"))
htmp <- correlation_plotPBMC(seurat.data.cor.big,
genesList, title="Seurat corr")
p_values.fromSeurat <- corr.pval.list$p_values
seurat.data.cor.big <- corr.pval.list$data.cor
rm(corr.pval.list)
gc() used (Mb) gc trigger (Mb) max used (Mb)
Ncells 10438805 557.5 17840924 952.9 17840924 952.9
Vcells 222547013 1697.9 551020551 4204.0 1372332893 10470.1draw(htmp, heatmap_legend_side="right")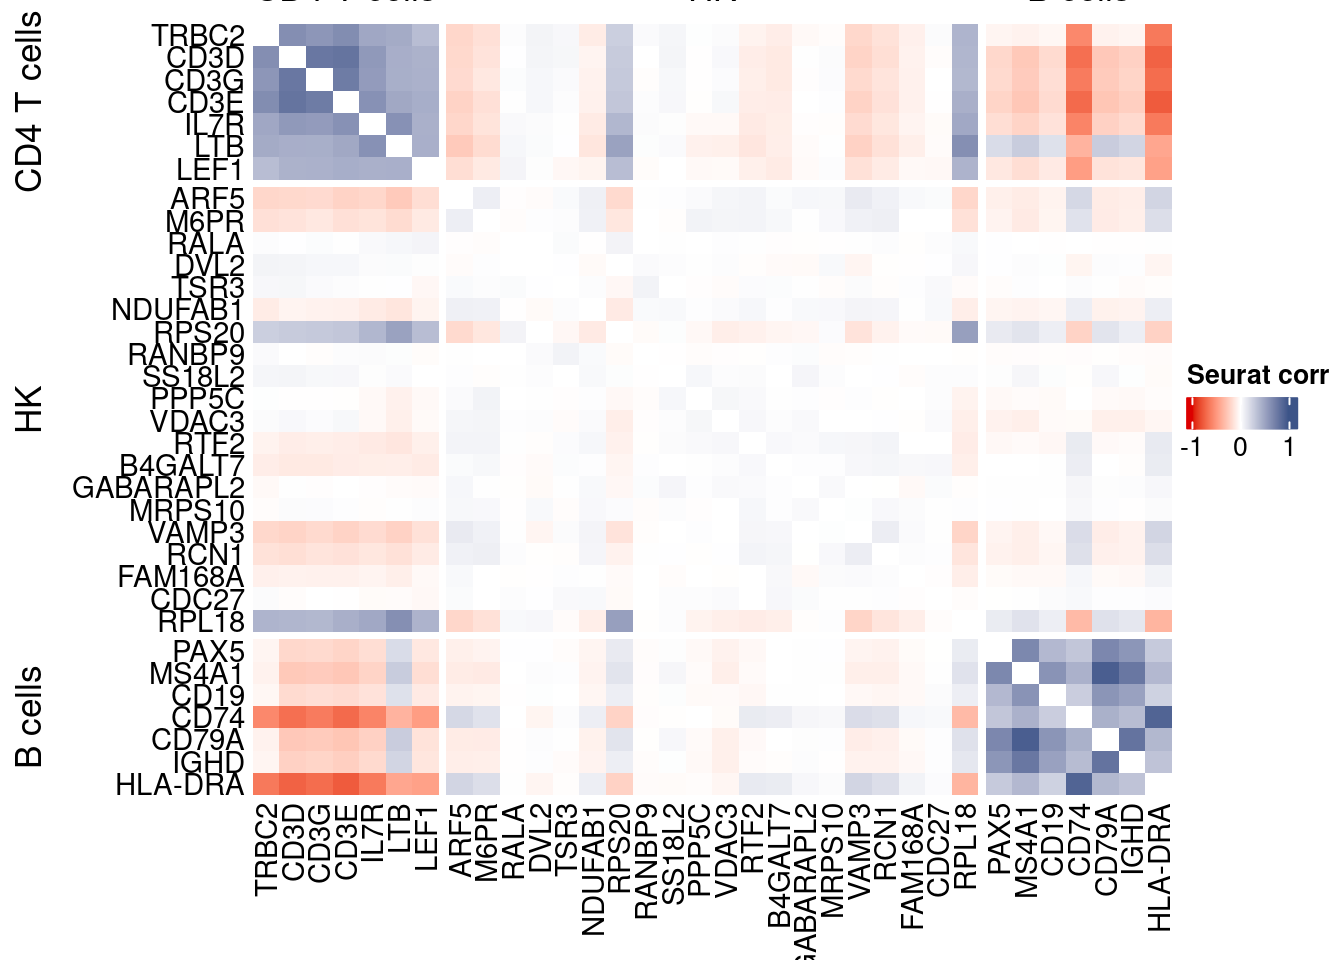
rm(seurat.data.cor.big)
rm(p_values.fromSeurat)
Seurat SC Transform
srat <-  SCTransform(srat,
                     method = "glmGamPoi",
                     vars.to.regress = "percent.mt",
                     verbose = FALSE)

seurat.data <- GetAssayData(srat[["SCT"]],layer = "data")

#Remove genes with all zeros
seurat.data <-seurat.data[rowSums(seurat.data) > 0,]


corr.pval.list <- correlation_pvalues(seurat.data,
                                      genesFromListExpressed,
                                      n.cells = getNumCells(obj))


seurat.data.cor.big <- as.matrix(Matrix::forceSymmetric(corr.pval.list$data.cor, uplo = "U"))

htmp <- correlation_plotPBMC(seurat.data.cor.big,
                         genesList, title="Seurat corr SCT")


p_values.fromSeurat <- corr.pval.list$p_values
seurat.data.cor.big <- corr.pval.list$data.cor

rm(corr.pval.list)
gc()
used (Mb) gc trigger (Mb) max used (Mb)
Ncells 10766967 575.1 17840924 952.9 17840924 952.9
Vcells 256479856 1956.8 551020551 4204.0 1372332893 10470.1draw(htmp, heatmap_legend_side="right")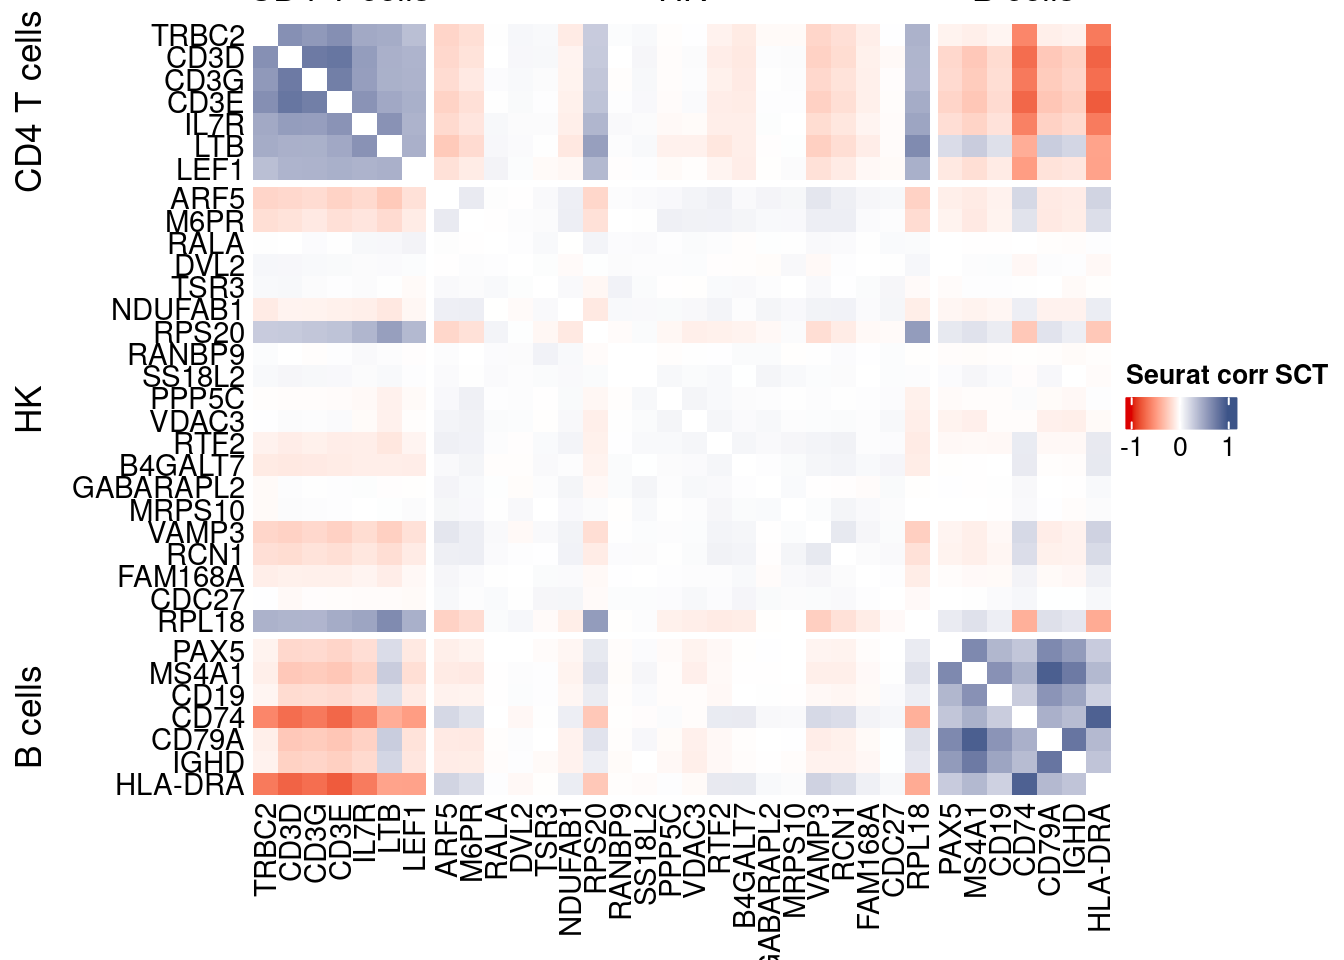
plot1 <- VariableFeaturePlot(srat)

plot1$data$centered_variance <- scale(plot1$data$residual_variance,
center = T,scale = F)write.csv(plot1$data,paste0("CoexData/",
"Variance_SeuratSCT_genes",
getMetadataElement(obj,
datasetTags()[["cond"]]),".csv"))
write_fst(as.data.frame(seurat.data.cor.big),path = paste0("CoexData/SeuratCorrSCT_",file_code,".fst"), compress = 100)
write_fst(as.data.frame(p_values.fromSeurat),path = paste0("CoexData/SeuratPValuesSCT_", file_code,".fst"))
write.csv(as.data.frame(p_values.fromSeurat),paste0("CoexData/SeuratPValuesSCT_", file_code,".csv"))
rm(seurat.data.cor.big)
rm(p_values.fromSeurat)Monocle
library(monocle3)cds <- new_cell_data_set(getRawData(obj),
cell_metadata = getMetadataCells(obj),
gene_metadata = getMetadataGenes(obj)
)
cds <- preprocess_cds(cds, num_dim = 100)
normalized_counts <- normalized_counts(cds)#Remove genes with all zeros
normalized_counts <- normalized_counts[rowSums(normalized_counts) > 0,]
corr.pval.list <- correlation_pvalues(normalized_counts,
genesFromListExpressed,
n.cells = getNumCells(obj))
rm(normalized_counts)
monocle.data.cor.big <- as.matrix(Matrix::forceSymmetric(corr.pval.list$data.cor, uplo = "U"))
htmp <- correlation_plotPBMC(data.cor.big = monocle.data.cor.big,
genesList,
title = "Monocle corr")
p_values.from.monocle <- corr.pval.list$p_values
monocle.data.cor.big <- corr.pval.list$data.cor
rm(corr.pval.list)
gc() used (Mb) gc trigger (Mb) max used (Mb)
Ncells 10953146 585.0 17840924 952.9 17840924 952.9
Vcells 258634127 1973.3 551020551 4204.0 1372332893 10470.1draw(htmp, heatmap_legend_side="right")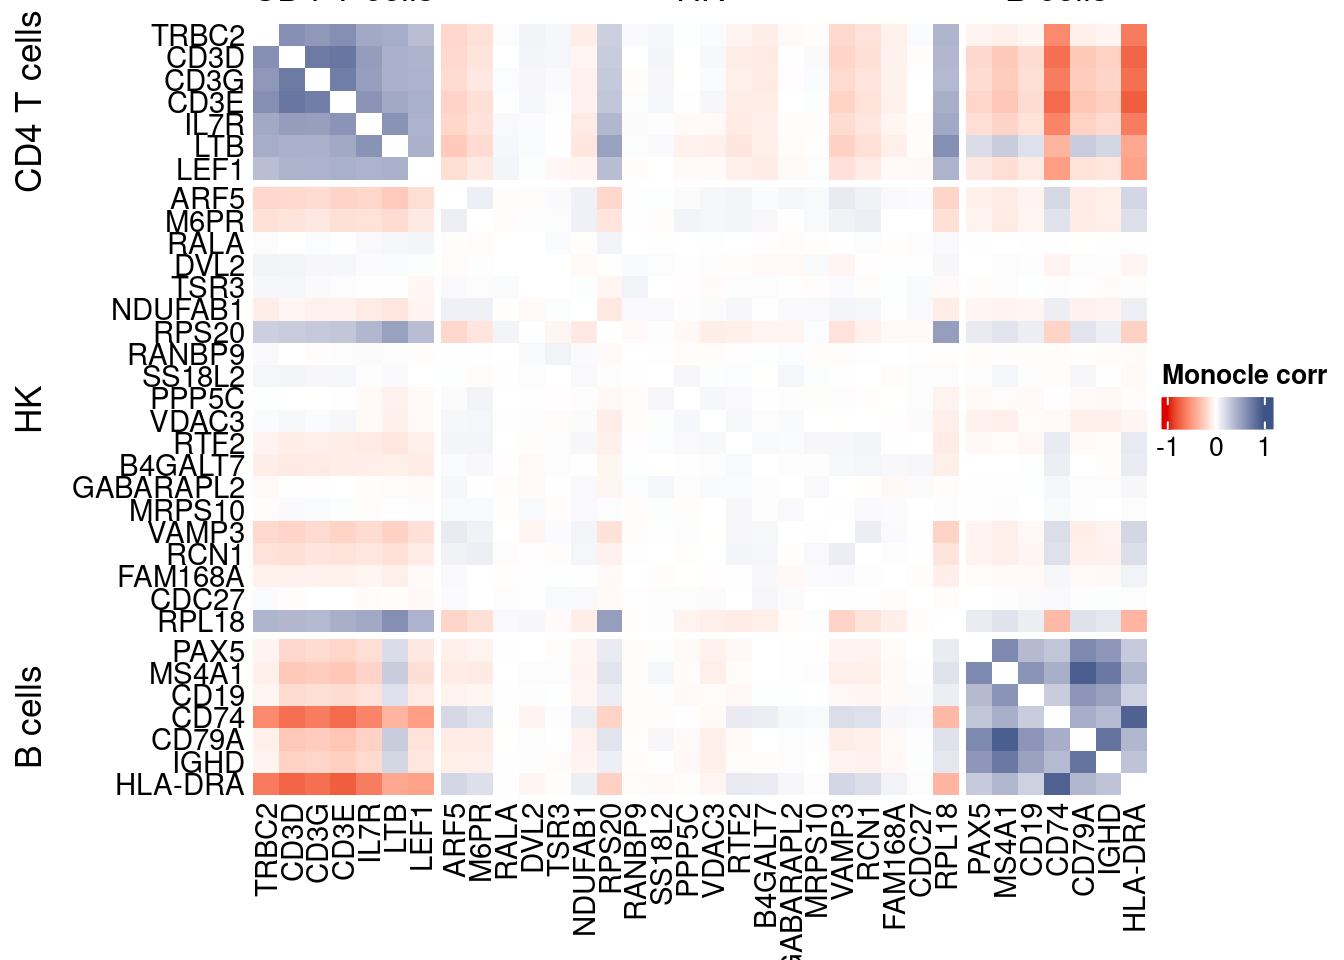
Cs-Core
devtools::load_all("../CS-CORE/")Convert to Seurat obj
sceObj <- convertToSingleCellExperiment(obj)

# Correct: assay=NULL (or omit), data=NULL (since no logcounts)
seuratObj <- as.Seurat(
  x       = sceObj,
  counts  = "counts",
  data    = NULL,
  assay   = NULL,      # IMPORTANT: do NOT set to "RNA" here
  project = "COTAN"
)

# as.Seurat(SCE) creates assay "originalexp" by default; rename it to RNA
seuratObj <- RenameAssays(seuratObj, originalexp = "RNA", verbose = FALSE)
DefaultAssay(seuratObj) <- "RNA"

# Optional: keep COTAN payload
seuratObj@misc$COTAN <- S4Vectors::metadata(sceObj)
Extract CS_CORE corr matrix
#seuratObj@assays$RNA@counts <- ceiling(seuratObj@assays$RNA@counts)
csCoreRes <- CSCORE(seuratObj, genes = genesFromListExpressed)
[INFO] IRLS converged after 3 iterations.
[INFO] Starting WLS for covariance at Wed Jan 21 12:04:25 2026
[INFO] 7 among 58 genes have invalid variance estimates. Their co-expressions with other genes were set to 0.
[INFO] 1.1494% co-expression estimates were greater than 1 and were set to 1.
[INFO] 0.0000% co-expression estimates were smaller than -1 and were set to -1.
[INFO] Finished WLS. Elapsed time: 0.5124 seconds.mat <- as.matrix(csCoreRes$est)
diag(mat) <- 0
split.genes <- base::factor(c(rep("CD4 T cells",sum(genesList[["CD4 T cells"]] %in% genesFromListExpressed)),
rep("HK",sum(genesList[["hk"]] %in% genesFromListExpressed)),
rep("B cells",sum(genesList[["B cells"]] %in% genesFromListExpressed))
),
levels = c("CD4 T cells","HK","B cells"))
f1 = colorRamp2(seq(-1,1, length = 3), c("#DC0000B2", "white","#3C5488B2" ))
htmp <- Heatmap(as.matrix(mat[c(genesList$`CD4 T cells`,genesList$hk,genesList$`B cells`),c(genesList$`CD4 T cells`,genesList$hk,genesList$`B cells`)]),
#width = ncol(coexMat)*unit(2.5, "mm"),
height = nrow(mat)*unit(3, "mm"),
cluster_rows = FALSE,
cluster_columns = FALSE,
col = f1,
row_names_side = "left",
row_names_gp = gpar(fontsize = 11),
column_names_gp = gpar(fontsize = 11),
column_split = split.genes,
row_split = split.genes,
cluster_row_slices = FALSE,
cluster_column_slices = FALSE,
heatmap_legend_param = list(
title = "CS-CORE", at = c(-1, 0, 1),
direction = "horizontal",
labels = c("-1", "0", "1")
)
)
draw(htmp, heatmap_legend_side="right")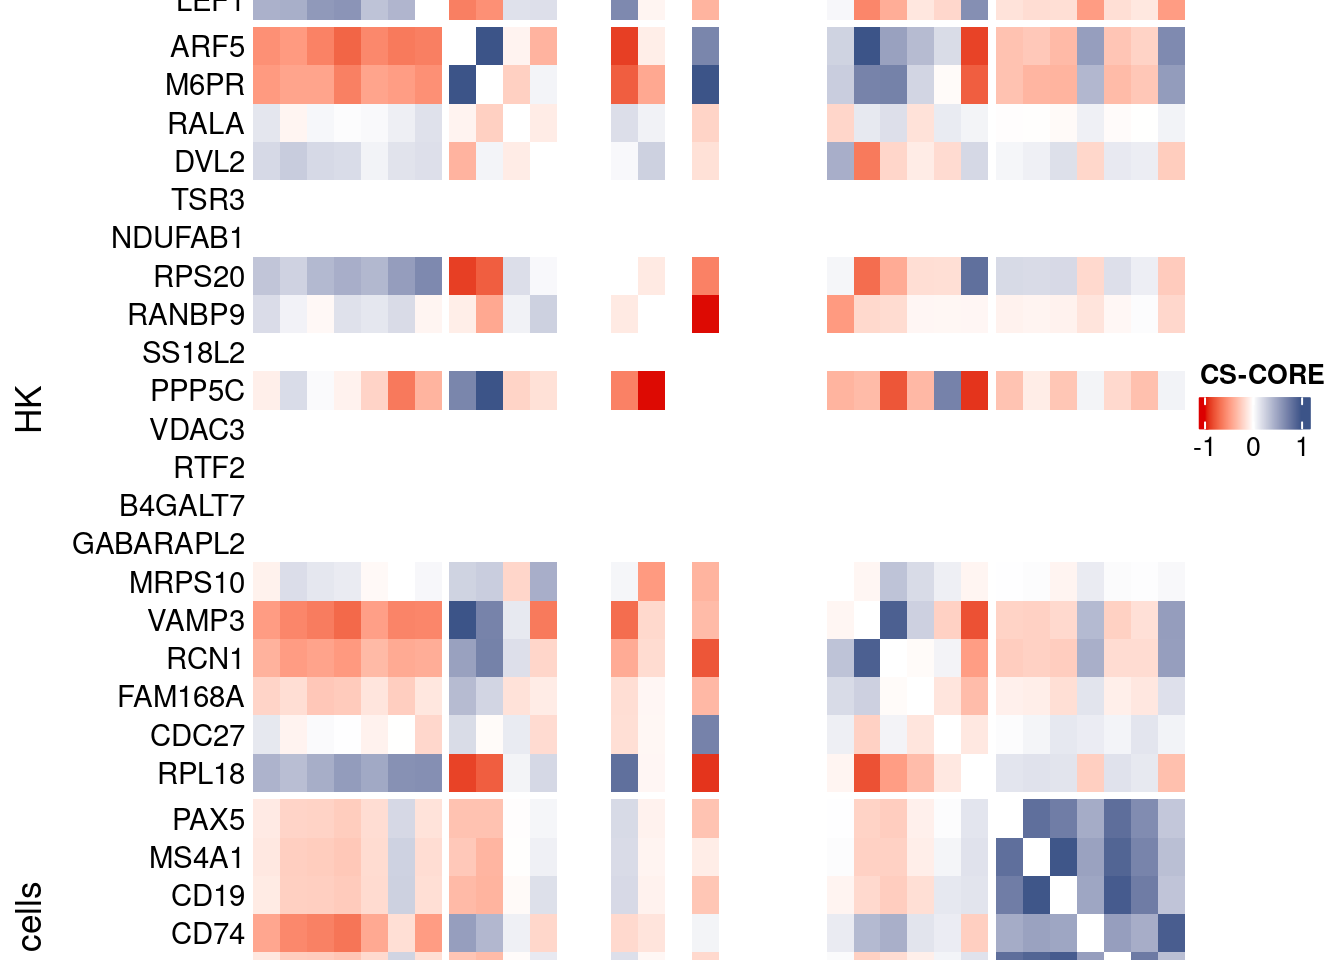
Save CS_CORE matrix
write_fst(as.data.frame(csCoreRes$est), path = paste0("CoexData/CS_CORECorr_", file_code,".fst"),compress = 100)
write_fst(as.data.frame(csCoreRes$p_value), path = paste0("CoexData/CS_COREPValues_", file_code,".fst"),compress = 100)
write.csv(as.data.frame(csCoreRes$p_value), paste0("CoexData/CS_COREPValues_", file_code,".csv"))
Baseline: Spearman on UMI counts
corr.pval.list <- correlation_pvaluesSpearman(data = getRawData(obj),
                                      genesFromListExpressed,
                                      n.cells = getNumCells(obj))

data.cor.big <- as.matrix(Matrix::forceSymmetric(corr.pval.list$data.cor, uplo = "U"))

htmp <- correlation_plotPBMC(data.cor.big,
                         genesList, title="UMI baseline S. corr")


p_values.fromSp.C <- corr.pval.list$p_values
data.cor.bigSp.C <- corr.pval.list$data.cor

rm(corr.pval.list)
gc()
used (Mb) gc trigger (Mb) max used (Mb)
Ncells 11080425 591.8 17840924 952.9 17840924 952.9
Vcells 258949216 1975.7 551020551 4204.0 1372332893 10470.1draw(htmp, heatmap_legend_side="right")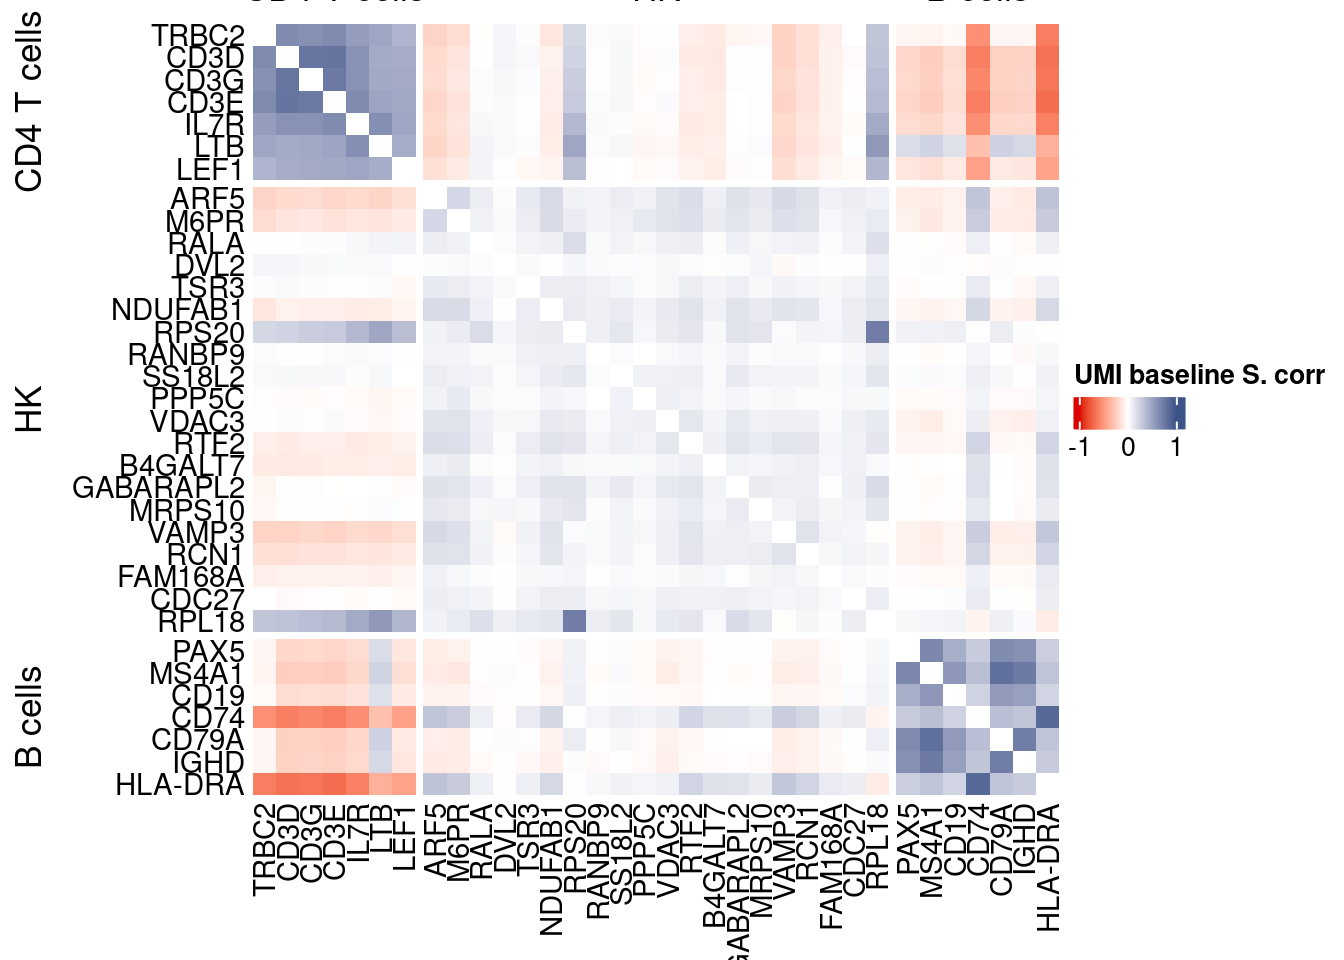
write.csv(as.data.frame(p_values.fromSp.C), paste0("CoexData/BaselineUMISpCorrPValues_", file_code,".csv"))Baseline: Pearson on binarized counts
corr.pval.list <- correlation_pvalues(data = getZeroOneProj(obj),
                                      genesFromListExpressed,
                                      n.cells = getNumCells(obj))

data.cor.big <- as.matrix(Matrix::forceSymmetric(corr.pval.list$data.cor, uplo = "U"))

htmp <- correlation_plotPBMC(data.cor.big,
                         genesList, title="Zero-one P. corr")


p_values.fromSp.C <- corr.pval.list$p_values
data.cor.bigSp.C <- corr.pval.list$data.cor

rm(corr.pval.list)
gc()
used (Mb) gc trigger (Mb) max used (Mb)
Ncells 11080555 591.8 17840924 952.9 17840924 952.9
Vcells 258949512 1975.7 551020551 4204.0 1372332893 10470.1draw(htmp, heatmap_legend_side="right")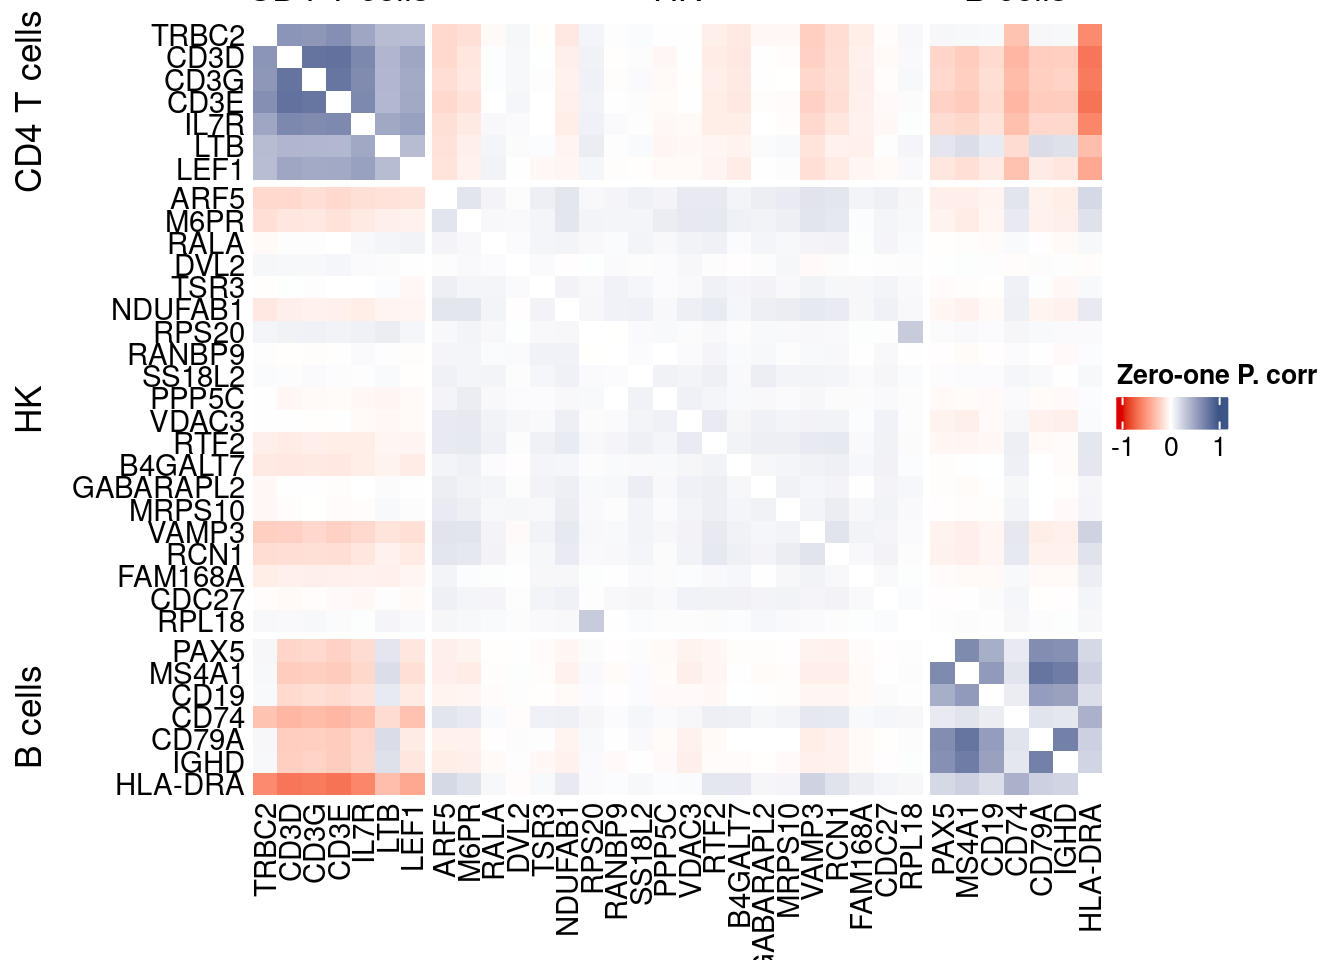
write.csv(as.data.frame(p_values.fromSp.C), paste0("CoexData/ZeroOnePCorrPValues_", file_code,".csv"))Sys.time()[1] "2026-01-21 12:04:32 CET"sessionInfo()R version 4.5.2 (2025-10-31)
Platform: x86_64-pc-linux-gnu
Running under: Ubuntu 22.04.5 LTS
Matrix products: default
BLAS: /usr/lib/x86_64-linux-gnu/blas/libblas.so.3.10.0
LAPACK: /usr/lib/x86_64-linux-gnu/lapack/liblapack.so.3.10.0 LAPACK version 3.10.0
locale:
[1] LC_CTYPE=C.UTF-8 LC_NUMERIC=C LC_TIME=C.UTF-8
[4] LC_COLLATE=C.UTF-8 LC_MONETARY=C.UTF-8 LC_MESSAGES=C.UTF-8
[7] LC_PAPER=C.UTF-8 LC_NAME=C LC_ADDRESS=C
[10] LC_TELEPHONE=C LC_MEASUREMENT=C.UTF-8 LC_IDENTIFICATION=C
time zone: Europe/Rome
tzcode source: system (glibc)
attached base packages:
[1] stats4 parallel grid stats graphics grDevices utils
[8] datasets methods base
other attached packages:
[1] CSCORE_1.0.2 testthat_3.3.2
[3] monocle3_1.3.7 SingleCellExperiment_1.32.0
[5] SummarizedExperiment_1.38.1 GenomicRanges_1.62.1
[7] Seqinfo_1.0.0 IRanges_2.44.0
[9] S4Vectors_0.48.0 MatrixGenerics_1.22.0
[11] matrixStats_1.5.0 Biobase_2.70.0
[13] BiocGenerics_0.56.0 generics_0.1.3
[15] fstcore_0.10.0 fst_0.9.8
[17] stringr_1.6.0 HiClimR_2.2.1
[19] doParallel_1.0.17 iterators_1.0.14
[21] foreach_1.5.2 Rfast_2.1.5.1
[23] RcppParallel_5.1.10 zigg_0.0.2
[25] Rcpp_1.1.0 patchwork_1.3.2
[27] Seurat_5.4.0 SeuratObject_5.3.0
[29] sp_2.2-0 Hmisc_5.2-3
[31] dplyr_1.1.4 circlize_0.4.16
[33] ComplexHeatmap_2.26.0 COTAN_2.11.1
loaded via a namespace (and not attached):
[1] fs_1.6.6 spatstat.sparse_3.1-0
[3] devtools_2.4.5 httr_1.4.7
[5] RColorBrewer_1.1-3 profvis_0.4.0
[7] tools_4.5.2 sctransform_0.4.2
[9] backports_1.5.0 R6_2.6.1
[11] lazyeval_0.2.2 uwot_0.2.3
[13] ggdist_3.3.3 GetoptLong_1.1.0
[15] urlchecker_1.0.1 withr_3.0.2
[17] gridExtra_2.3 parallelDist_0.2.6
[19] progressr_0.18.0 cli_3.6.5
[21] Cairo_1.7-0 spatstat.explore_3.6-0
[23] fastDummies_1.7.5 labeling_0.4.3
[25] S7_0.2.1 spatstat.data_3.1-9
[27] proxy_0.4-29 ggridges_0.5.6
[29] pbapply_1.7-2 foreign_0.8-90
[31] sessioninfo_1.2.3 parallelly_1.46.0
[33] torch_0.16.3 rstudioapi_0.18.0
[35] shape_1.4.6.1 ica_1.0-3
[37] spatstat.random_3.4-3 distributional_0.6.0
[39] dendextend_1.19.0 Matrix_1.7-4
[41] abind_1.4-8 lifecycle_1.0.4
[43] yaml_2.3.10 SparseArray_1.10.8
[45] Rtsne_0.17 glmGamPoi_1.20.0
[47] promises_1.5.0 crayon_1.5.3
[49] miniUI_0.1.2 lattice_0.22-7
[51] beachmat_2.26.0 cowplot_1.2.0
[53] magick_2.9.0 zeallot_0.2.0
[55] pillar_1.11.1 knitr_1.50
[57] rjson_0.2.23 boot_1.3-32
[59] future.apply_1.20.0 codetools_0.2-20
[61] glue_1.8.0 spatstat.univar_3.1-6
[63] remotes_2.5.0 data.table_1.18.0
[65] Rdpack_2.6.4 vctrs_0.7.0
[67] png_0.1-8 spam_2.11-1
[69] gtable_0.3.6 assertthat_0.2.1
[71] cachem_1.1.0 xfun_0.52
[73] rbibutils_2.3 S4Arrays_1.10.1
[75] mime_0.13 reformulas_0.4.1
[77] survival_3.8-3 ncdf4_1.24
[79] ellipsis_0.3.2 fitdistrplus_1.2-2
[81] ROCR_1.0-11 nlme_3.1-168
[83] usethis_3.2.1 bit64_4.6.0-1
[85] RcppAnnoy_0.0.22 rprojroot_2.1.1
[87] GenomeInfoDb_1.44.0 irlba_2.3.5.1
[89] KernSmooth_2.23-26 otel_0.2.0
[91] rpart_4.1.24 colorspace_2.1-1
[93] nnet_7.3-20 tidyselect_1.2.1
[95] processx_3.8.6 bit_4.6.0
[97] compiler_4.5.2 htmlTable_2.4.3
[99] desc_1.4.3 DelayedArray_0.36.0
[101] plotly_4.11.0 checkmate_2.3.2
[103] scales_1.4.0 lmtest_0.9-40
[105] callr_3.7.6 digest_0.6.37
[107] goftest_1.2-3 spatstat.utils_3.2-1
[109] minqa_1.2.8 rmarkdown_2.29
[111] XVector_0.50.0 htmltools_0.5.8.1
[113] pkgconfig_2.0.3 base64enc_0.1-3
[115] coro_1.1.0 lme4_1.1-37
[117] sparseMatrixStats_1.20.0 fastmap_1.2.0
[119] rlang_1.1.7 GlobalOptions_0.1.2
[121] htmlwidgets_1.6.4 ggthemes_5.2.0
[123] UCSC.utils_1.4.0 shiny_1.12.1
[125] DelayedMatrixStats_1.30.0 farver_2.1.2
[127] zoo_1.8-14 jsonlite_2.0.0
[129] BiocParallel_1.44.0 BiocSingular_1.26.1
[131] magrittr_2.0.4 Formula_1.2-5
[133] GenomeInfoDbData_1.2.14 dotCall64_1.2
[135] viridis_0.6.5 reticulate_1.44.1
[137] stringi_1.8.7 brio_1.1.5
[139] MASS_7.3-65 pkgbuild_1.4.7
[141] plyr_1.8.9 listenv_0.10.0
[143] ggrepel_0.9.6 deldir_2.0-4
[145] splines_4.5.2 tensor_1.5
[147] ps_1.9.1 igraph_2.2.1
[149] spatstat.geom_3.6-1 RcppHNSW_0.6.0
[151] pkgload_1.4.0 reshape2_1.4.4
[153] ScaledMatrix_1.16.0 evaluate_1.0.5
[155] nloptr_2.2.1 httpuv_1.6.16
[157] RANN_2.6.2 tidyr_1.3.1
[159] purrr_1.2.0 polyclip_1.10-7
[161] future_1.69.0 clue_0.3-66
[163] scattermore_1.2 ggplot2_4.0.1
[165] rsvd_1.0.5 xtable_1.8-4
[167] RSpectra_0.16-2 later_1.4.2
[169] viridisLite_0.4.2 tibble_3.3.0
[171] memoise_2.0.1 cluster_2.1.8.1
[173] globals_0.18.0