library(COTAN)
library(ComplexHeatmap)
library(circlize)
library(dplyr)
library(Hmisc)
library(Seurat)
library(patchwork)
library(Rfast)
library(parallel)
library(doParallel)
library(HiClimR)
library(stringr)
library(fst)

options(parallelly.fork.enable = TRUE)

dataFile <- "Data/PBMC3/filtered/PBMC3.cotan.RDS"
name <- str_split(dataFile,pattern = "/",simplify = T)[4]
name <- str_remove(name,pattern = ".cotan.RDS")

project = name

setLoggingLevel(1)
outDir <- "CoexData/"
setLoggingFile(paste0(outDir, "Logs/",name,".log"))

obj <- readRDS(dataFile)
file_code = nameGene Correlation Analysis for PBMC 2
Prologue
source("src/Functions.R")To compare the ability of COTAN to asses the real correlation between genes we define some pools of genes:
- Constitutive genes
- Neural progenitor genes
- Pan neuronal genes
- Some layer marker genes
hkGenes  <- read.csv("Data/Housekeeping_TranscriptsHuman.csv", sep = ";")

genesList <- list(
  "CD4 T cells"=
    c("TRBC2","CD3D","CD3G","CD3E","IL7R","LTB","LEF1"),
  "B cells"=
    c("PAX5","MS4A1","CD19","CD74","CD79A","IGHD","HLA-DRA"),
  "hk"= hkGenes$Gene_symbol[1:20], # from https://housekeeping.unicamp.br/
  "general PBMC markers" =
  c("FOXP3","TBX21","GATA3","RUNX1","BCL6","EOMES","EOMES","TBX21","BATF3","IRF2","TCF4","STAT5A","RUNX3","STAT6","BATF","STAT3","TBX21","TBX21","IRF8","IRF4","AHR","STAT1","IRF4","RELB")
)
COTAN
genesFromListExpressed <- unlist(genesList)[unlist(genesList) %in% getGenes(obj)]
int.genes <-getGenes(obj)
obj <- proceedToCoex(obj, calcCoex = TRUE, cores = 5L, saveObj = FALSE)coexMat.big <- getGenesCoex(obj)[genesFromListExpressed,genesFromListExpressed]
coexMat <- getGenesCoex(obj)[c(genesList$`CD4 T cells`,genesList$hk,genesList$`B cells`),c(genesList$`CD4 T cells`,genesList$hk,genesList$`B cells`)]
f1 = colorRamp2(seq(-1,1, length = 3), c("#DC0000B2", "white","#3C5488B2" ))
split.genes <- base::factor(c(rep("CD4 T cells",length(genesList[["CD4 T cells"]])),
rep("HK",length(genesList[["hk"]])),
rep("B cells",length(genesList[["B cells"]]))
),
levels = c("CD4 T cells","HK","B cells"))
lgd = Legend(col_fun = f1, title = "COTAN coex")
htmp <- Heatmap(as.matrix(coexMat),
#width = ncol(coexMat)*unit(2.5, "mm"),
height = nrow(coexMat)*unit(3, "mm"),
cluster_rows = FALSE,
cluster_columns = FALSE,
col = f1,
row_names_side = "left",
row_names_gp = gpar(fontsize = 11),
column_names_gp = gpar(fontsize = 11),
column_split = split.genes,
row_split = split.genes,
cluster_row_slices = FALSE,
cluster_column_slices = FALSE,
heatmap_legend_param = list(
title = "COTAN coex", at = c(-1, 0, 1),
direction = "horizontal",
labels = c("-1", "0", "1")
)
)
draw(htmp, heatmap_legend_side="right")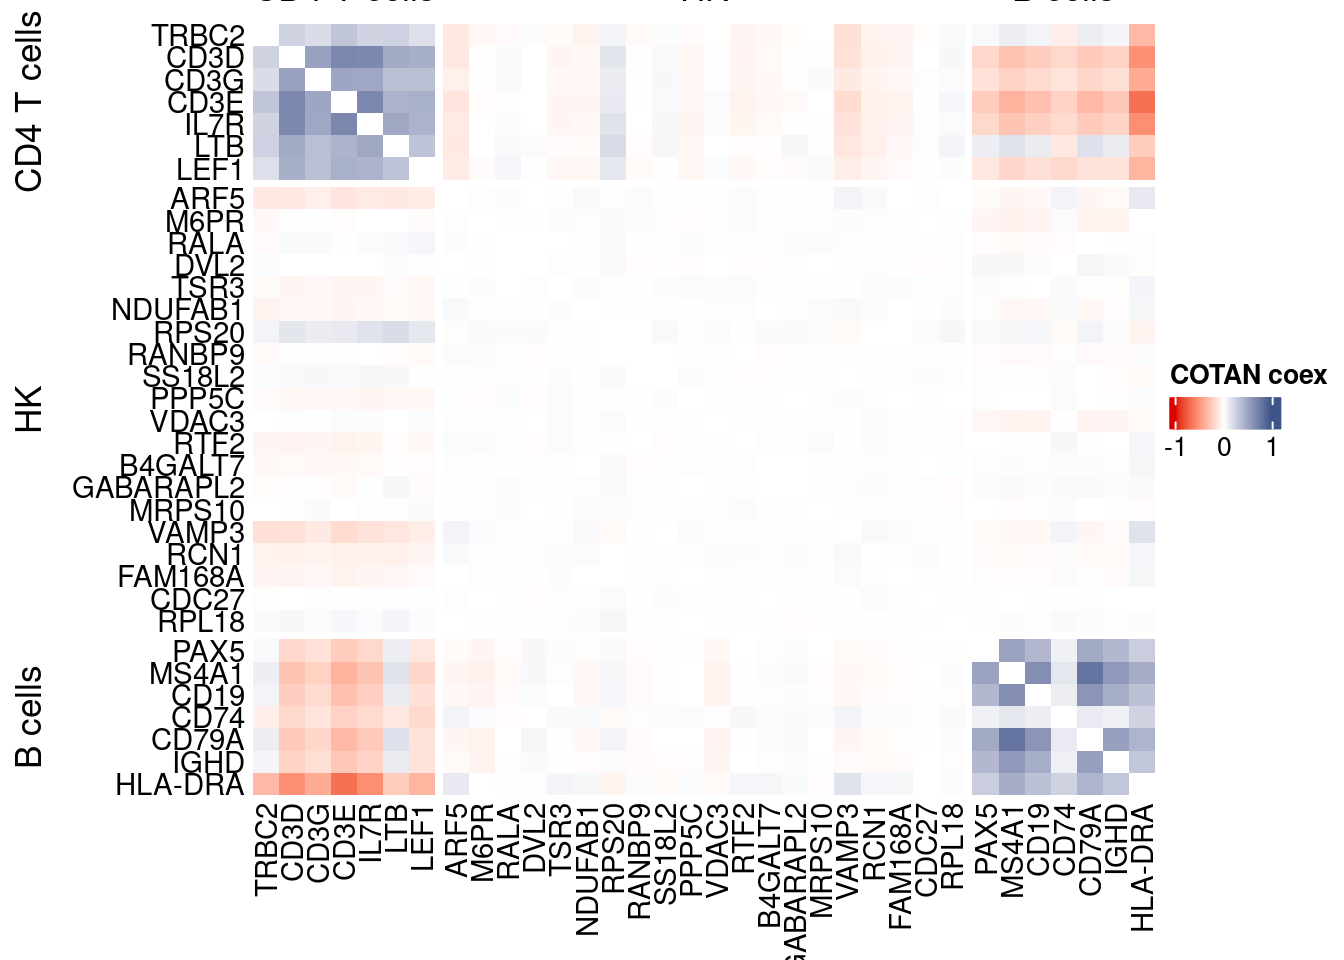
GDI_DF <- calculateGDI(obj)
GDI_DF$geneType <- NA
for (cat in names(genesList)) {
  GDI_DF[rownames(GDI_DF) %in% genesList[[cat]],]$geneType <- cat
}

GDI_DF$GDI_centered <- scale(GDI_DF$GDI,center = T,scale = T)

GDI_DF[genesFromListExpressed,]
sum.raw.norm GDI exp.cells geneType GDI_centered
TRBC2 9.874177 4.874875 63.240132 CD4 T cells 3.64599258
CD3D 9.840909 5.175849 57.017544 CD4 T cells 4.02979434
CD3G 9.049192 4.679860 42.251462 CD4 T cells 3.39730920
CD3E 10.598095 5.462949 68.914474 CD4 T cells 4.39590379
IL7R 10.635058 5.120245 58.854167 CD4 T cells 3.95888817
LTB 11.147948 4.844231 76.900585 CD4 T cells 3.60691454
LEF1 9.038204 4.565915 35.864401 CD4 T cells 3.25200575
PAX5 6.249472 3.540104 3.627558 B cells 1.94389273
MS4A1 8.984065 4.307264 11.312135 B cells 2.92217440
CD19 6.903180 3.878813 5.528143 B cells 2.37581343
CD74 12.278994 3.449535 85.964912 B cells 1.82839798
CD79A 9.204001 4.228222 13.011696 B cells 2.82138034
IGHD 6.987794 3.701412 4.851974 B cells 2.14959243
HLA-DRA 10.795339 5.478495 31.779971 B cells 4.41572893
ARF5 9.158379 3.058035 53.243787 hk 1.32915825
M6PR 8.670796 1.920802 39.025950 hk -0.12104220
RALA 7.758447 1.621003 19.024123 hk -0.50334496
DVL2 6.692568 1.654861 6.889620 hk -0.46016960
TSR3 6.746705 1.877786 7.474415 hk -0.17589562
NDUFAB1 8.564728 2.243746 36.631944 hk 0.29077666
RPS20 10.346324 2.964540 83.735380 hk 1.20993343
RANBP9 5.960179 1.603288 3.499635 hk -0.52593521
SS18L2 8.036664 1.721866 24.442617 hk -0.37472508
PPP5C 7.233730 1.686424 11.440058 hk -0.41992001
VDAC3 8.188253 1.653364 27.311769 hk -0.46207857
RTF2 8.291635 2.025379 29.879386 hk 0.01231501
B4GALT7 6.349414 1.717812 5.052997 hk -0.37989489
GABARAPL2 8.904895 1.755066 47.076023 hk -0.33238802
MRPS10 7.464296 1.491522 14.062500 hk -0.66845946
VAMP3 7.286233 3.431958 11.860380 hk 1.80598445
RCN1 6.137186 2.370809 4.139254 hk 0.45280690
FAM168A 5.786446 1.929811 2.814327 hk -0.10955319
CDC27 7.073346 1.476294 10.179094 hk -0.68787856
RPL18 12.356088 1.758347 99.680190 hk -0.32820393
FOXP3 5.896724 2.078021 1.736111 general PBMC markers 0.07944369
TBX21 7.744701 3.669717 10.334430 general PBMC markers 2.10917503
GATA3 8.130949 3.595950 21.673977 general PBMC markers 2.01510744
RUNX1 7.382633 1.793722 12.737573 general PBMC markers -0.28309429
BCL6 6.369393 3.926946 4.102705 general PBMC markers 2.43719355
EOMES 7.048545 3.099771 7.072368 general PBMC markers 1.38237895
EOMES.1 7.048545 3.099771 7.072368 general PBMC markers 1.38237895
TBX21.1 7.744701 3.669717 10.334430 general PBMC markers 2.10917503
BATF3 5.691626 4.255956 2.640716 general PBMC markers 2.85674646
IRF2 8.145941 1.714116 25.365497 general PBMC markers -0.38460712
TCF4 7.102907 3.970131 6.953582 general PBMC markers 2.49226253
STAT5A 7.613208 1.869964 16.493056 general PBMC markers -0.18587017
RUNX3 7.703680 2.295818 15.570175 general PBMC markers 0.35717831
STAT6 8.264054 3.086991 27.403143 general PBMC markers 1.36608226
BATF 7.346228 2.065541 11.723319 general PBMC markers 0.06352923
STAT3 8.736156 1.503181 39.884868 general PBMC markers -0.65359207
TBX21.2 7.744701 3.669717 10.334430 general PBMC markers 2.10917503
TBX21.3 7.744701 3.669717 10.334430 general PBMC markers 2.10917503
IRF8 7.796629 4.206935 12.289839 general PBMC markers 2.79423508
IRF4 5.728892 2.734544 2.704678 general PBMC markers 0.91664184
AHR 6.880937 3.449949 8.205409 general PBMC markers 1.82892674
STAT1 8.624742 2.124136 29.486477 general PBMC markers 0.13825021
IRF4.1 5.728892 2.734544 2.704678 general PBMC markers 0.91664184
RELB 7.711724 3.320299 15.734649 general PBMC markers 1.66359745GDIPlot(obj,GDIIn = GDI_DF, genes = genesList,GDIThreshold = 1.4)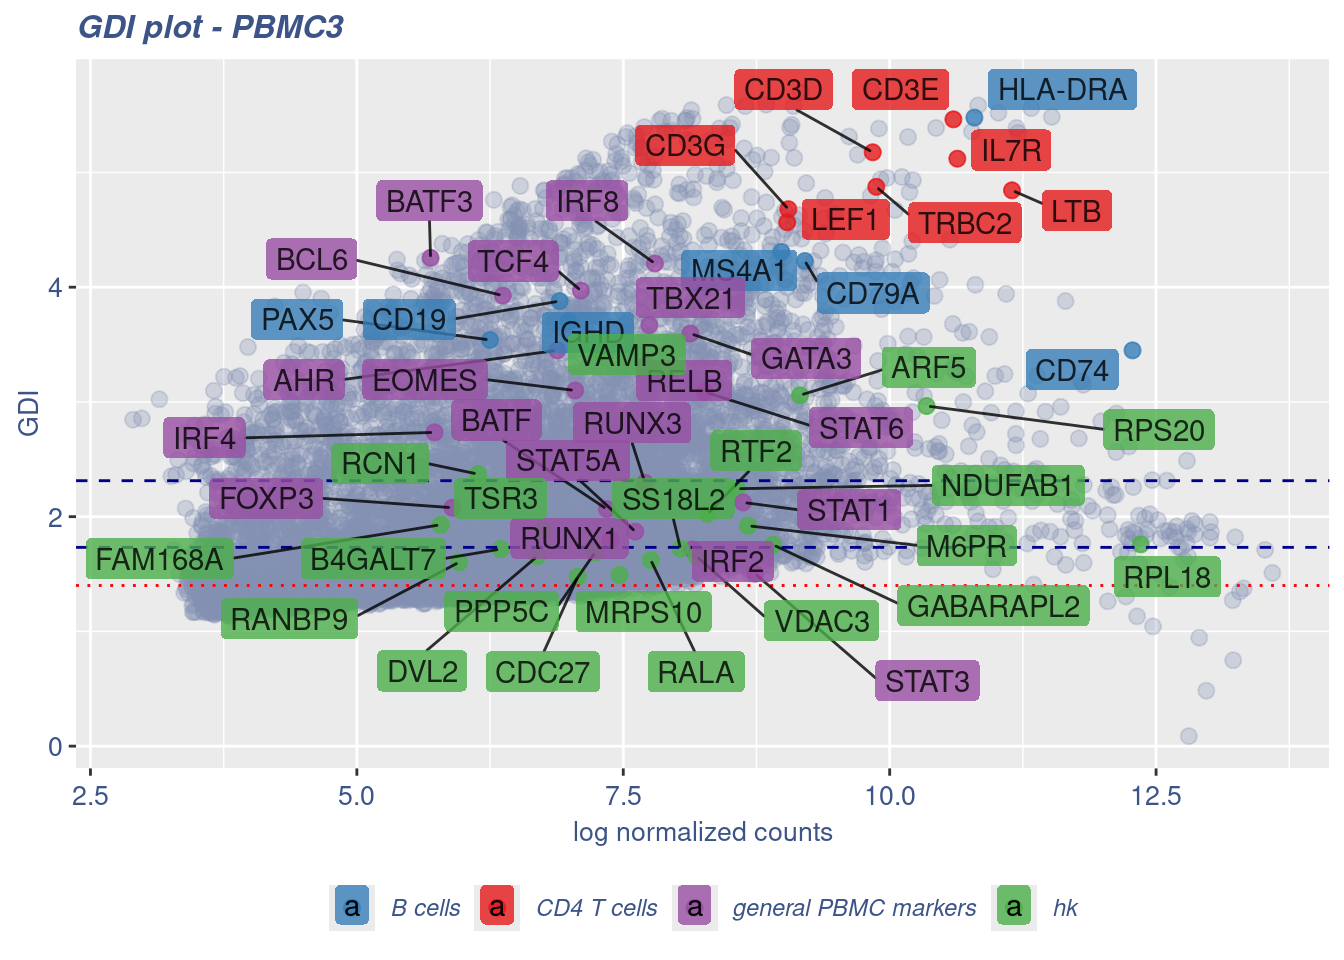
Seurat correlation
srat<- CreateSeuratObject(counts = getRawData(obj),
                          project = project,
                          min.cells = 3,
                          min.features = 200)
srat[["percent.mt"]] <- PercentageFeatureSet(srat, pattern = "^MT-")
srat <- NormalizeData(srat)
srat <- FindVariableFeatures(srat, selection.method = "vst", nfeatures = 2000)

# plot variable features with and without labels
plot1 <- VariableFeaturePlot(srat)

plot1$data$centered_variance <- scale(plot1$data$variance.standardized,
                                      center = T,scale = F)

write.csv(plot1$data,paste0("CoexData/",
                            "Variance_Seurat_genes",
                            getMetadataElement(obj,
                                               datasetTags()[["cond"]]),".csv"))

LabelPoints(plot = plot1, points = c(genesList$`CD4 T cells`,genesList$`B cells`,genesList$hk), repel = TRUE)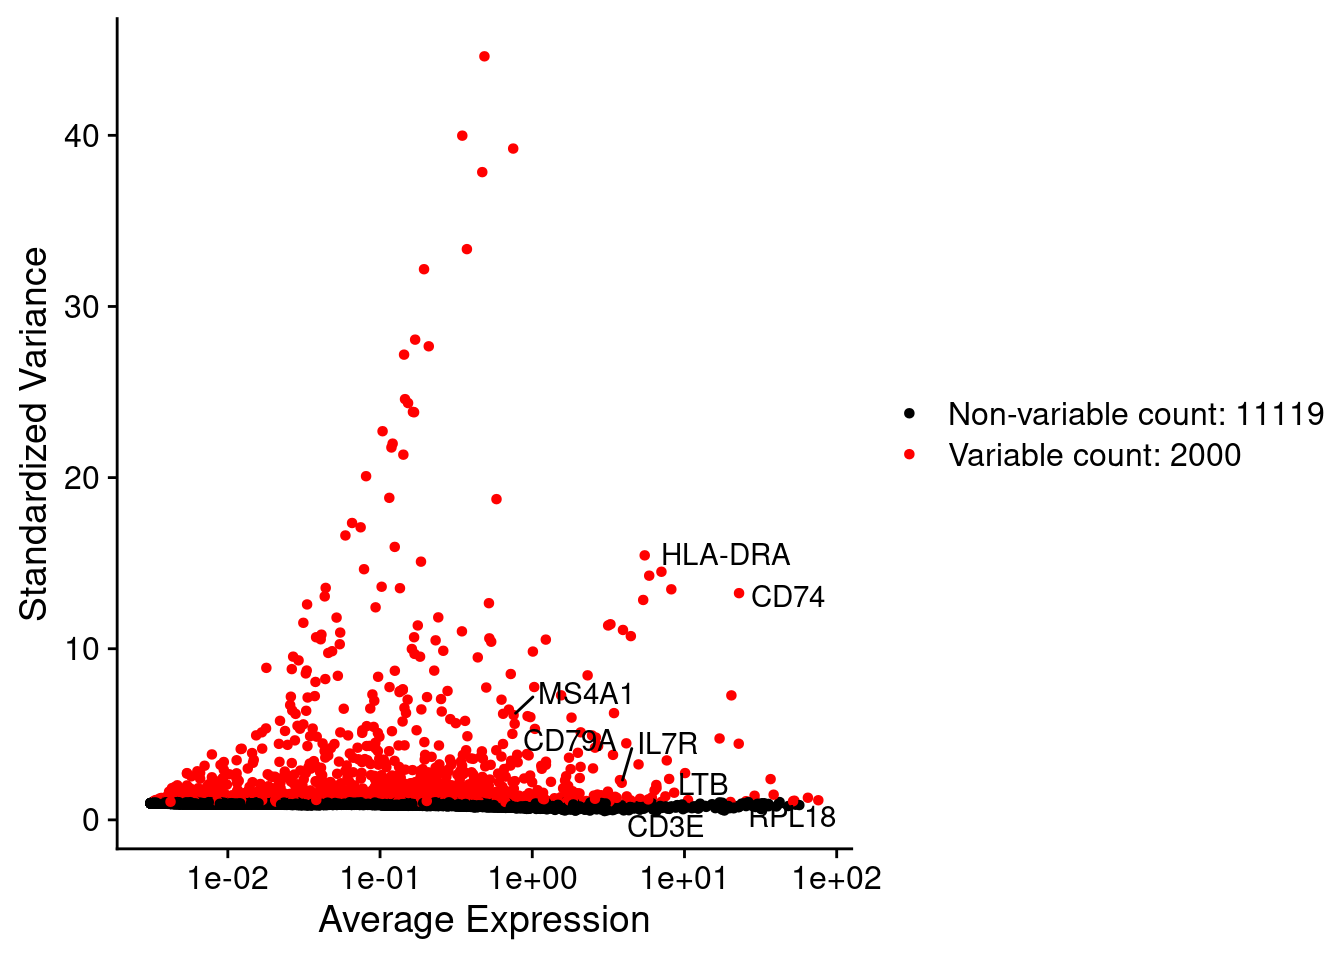
LabelPoints(plot = plot1, points = c(genesList$hk), repel = TRUE)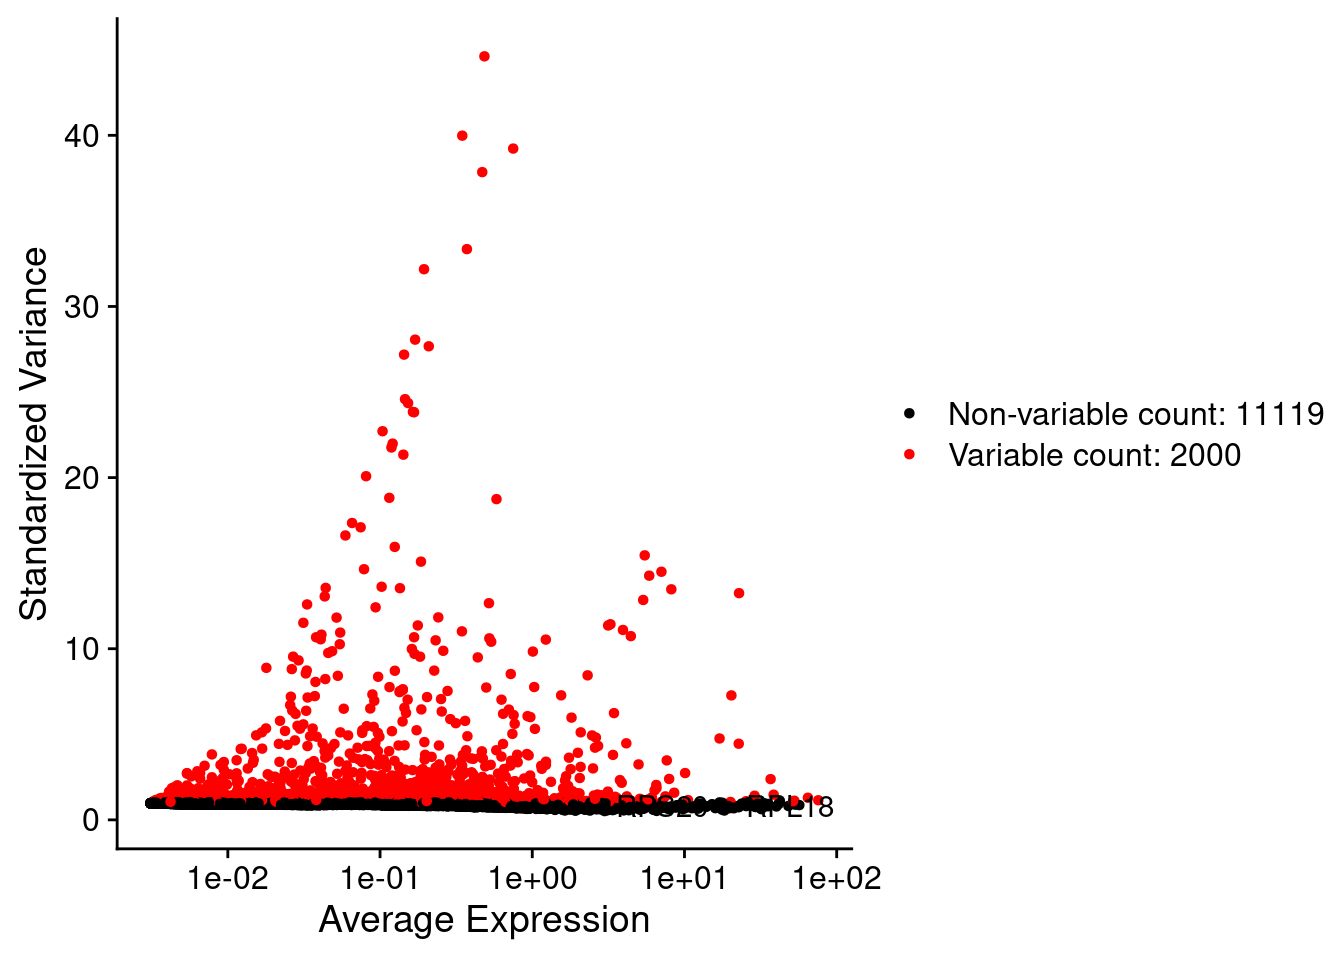
all.genes <- rownames(srat)
srat <- ScaleData(srat, features = all.genes)
seurat.data = GetAssayData(srat[["RNA"]],layer = "data")
corr.pval.list <- correlation_pvalues(data = seurat.data,
genesFromListExpressed,
n.cells = getNumCells(obj))
seurat.data.cor.big <- as.matrix(Matrix::forceSymmetric(corr.pval.list$data.cor, uplo = "U"))
htmp <- correlation_plotPBMC(seurat.data.cor.big,
genesList, title="Seurat corr")
p_values.fromSeurat <- corr.pval.list$p_values
seurat.data.cor.big <- corr.pval.list$data.cor
rm(corr.pval.list)
gc() used (Mb) gc trigger (Mb) max used (Mb)
Ncells 10444731 557.9 17840938 952.9 17840938 952.9
Vcells 344860612 2631.1 555359243 4237.1 1074268791 8196.1draw(htmp, heatmap_legend_side="right")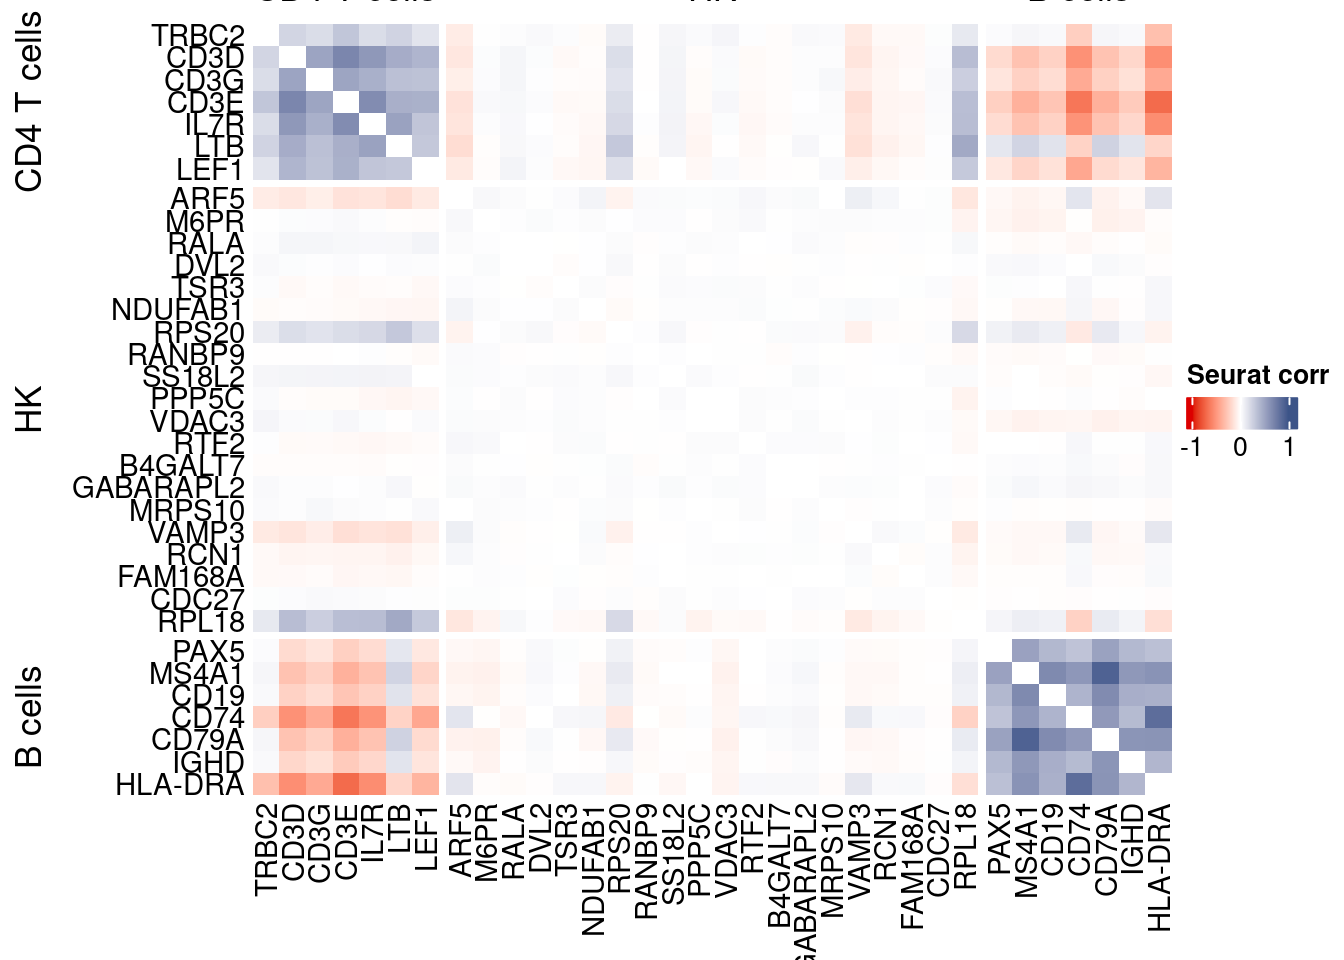
rm(seurat.data.cor.big)
rm(p_values.fromSeurat)
Seurat SC Transform
srat <-  SCTransform(srat,
                     method = "glmGamPoi",
                     vars.to.regress = "percent.mt",
                     verbose = FALSE)

seurat.data <- GetAssayData(srat[["SCT"]],layer = "data")

#Remove genes with all zeros
seurat.data <-seurat.data[rowSums(seurat.data) > 0,]


corr.pval.list <- correlation_pvalues(seurat.data,
                                      genesFromListExpressed,
                                      n.cells = getNumCells(obj))


seurat.data.cor.big <- as.matrix(Matrix::forceSymmetric(corr.pval.list$data.cor, uplo = "U"))

htmp <- correlation_plotPBMC(seurat.data.cor.big,
                         genesList, title="Seurat corr SCT")


p_values.fromSeurat <- corr.pval.list$p_values
seurat.data.cor.big <- corr.pval.list$data.cor

rm(corr.pval.list)
gc()
used (Mb) gc trigger (Mb) max used (Mb)
Ncells 10772917 575.4 17840938 952.9 17840938 952.9
Vcells 424240629 3236.7 1152022364 8789.3 1152020021 8789.3draw(htmp, heatmap_legend_side="right")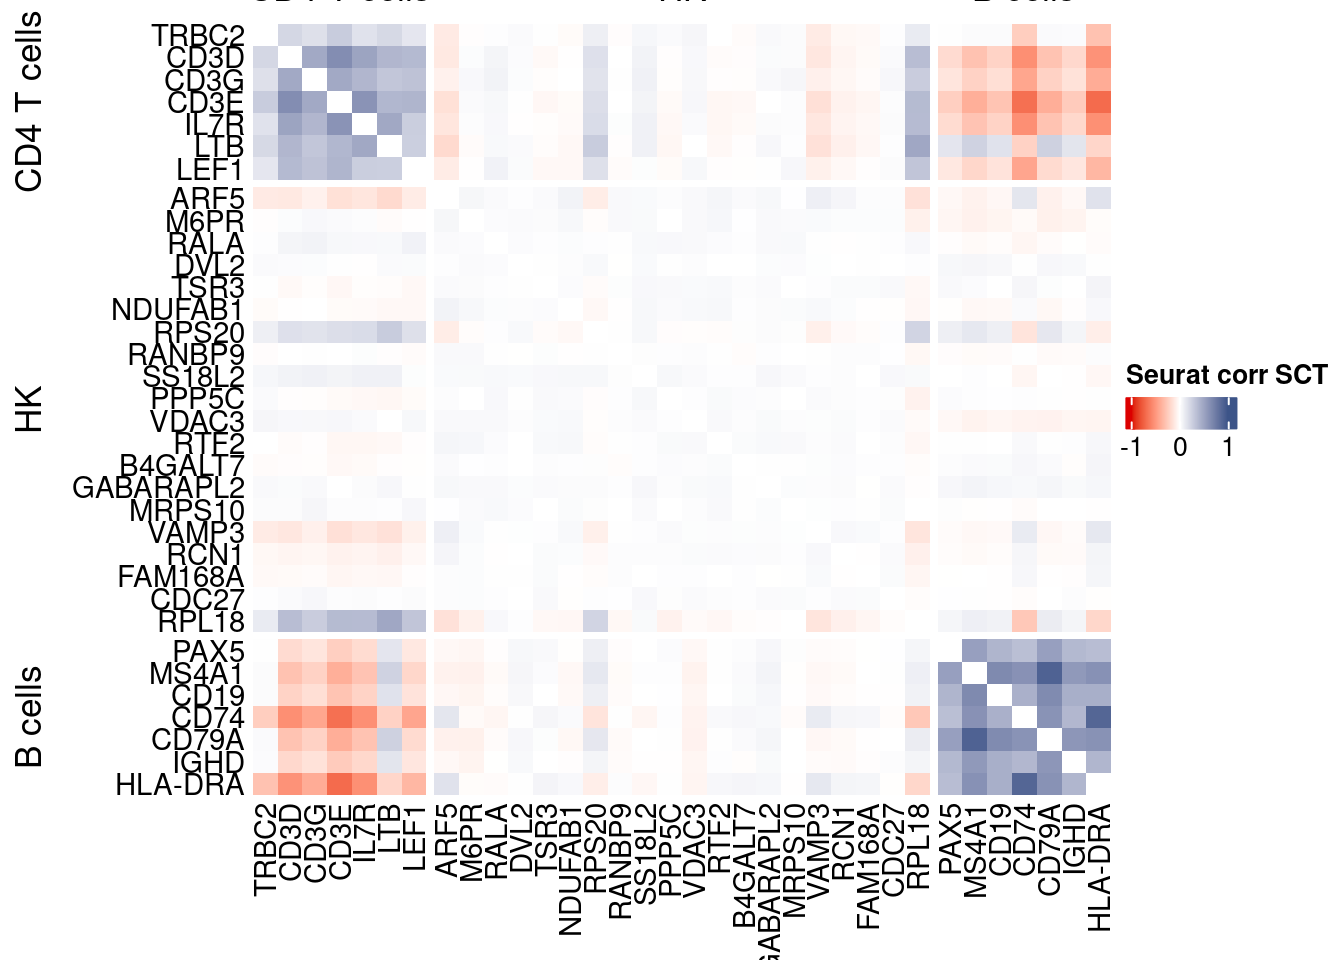
plot1 <- VariableFeaturePlot(srat)

plot1$data$centered_variance <- scale(plot1$data$residual_variance,
center = T,scale = F)write.csv(plot1$data,paste0("CoexData/",
"Variance_SeuratSCT_genes",
getMetadataElement(obj,
datasetTags()[["cond"]]),".csv"))
write_fst(as.data.frame(seurat.data.cor.big),path = paste0("CoexData/SeuratCorrSCT_",file_code,".fst"), compress = 100)
write_fst(as.data.frame(p_values.fromSeurat),path = paste0("CoexData/SeuratPValuesSCT_", file_code,".fst"))
write.csv(as.data.frame(p_values.fromSeurat),paste0("CoexData/SeuratPValuesSCT_", file_code,".csv"))
rm(seurat.data.cor.big)
rm(p_values.fromSeurat)Monocle
library(monocle3)cds <- new_cell_data_set(getRawData(obj),
cell_metadata = getMetadataCells(obj),
gene_metadata = getMetadataGenes(obj)
)
cds <- preprocess_cds(cds, num_dim = 100)
normalized_counts <- normalized_counts(cds)#Remove genes with all zeros
normalized_counts <- normalized_counts[rowSums(normalized_counts) > 0,]
corr.pval.list <- correlation_pvalues(normalized_counts,
genesFromListExpressed,
n.cells = getNumCells(obj))
rm(normalized_counts)
monocle.data.cor.big <- as.matrix(Matrix::forceSymmetric(corr.pval.list$data.cor, uplo = "U"))
htmp <- correlation_plotPBMC(data.cor.big = monocle.data.cor.big,
genesList,
title = "Monocle corr")
p_values.from.monocle <- corr.pval.list$p_values
monocle.data.cor.big <- corr.pval.list$data.cor
rm(corr.pval.list)
gc() used (Mb) gc trigger (Mb) max used (Mb)
Ncells 10959084 585.3 17840938 952.9 17840938 952.9
Vcells 427007796 3257.9 1152022364 8789.3 1152020021 8789.3draw(htmp, heatmap_legend_side="right")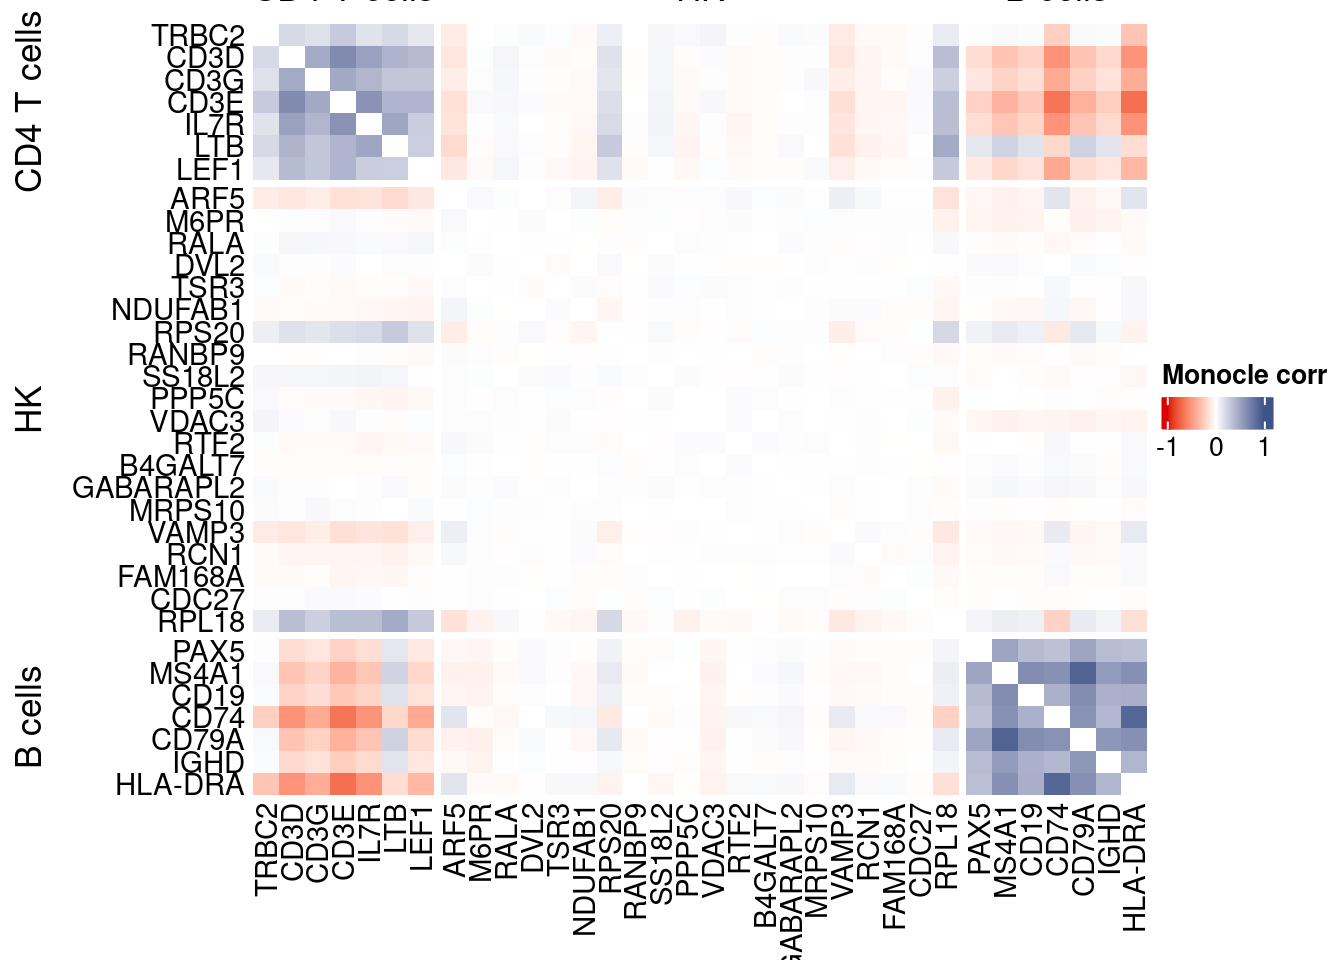
Cs-Core
devtools::load_all("../CS-CORE/")Convert to Seurat obj
sceObj <- convertToSingleCellExperiment(obj)

# Correct: assay=NULL (or omit), data=NULL (since no logcounts)
seuratObj <- as.Seurat(
  x       = sceObj,
  counts  = "counts",
  data    = NULL,
  assay   = NULL,      # IMPORTANT: do NOT set to "RNA" here
  project = "COTAN"
)

# as.Seurat(SCE) creates assay "originalexp" by default; rename it to RNA
seuratObj <- RenameAssays(seuratObj, originalexp = "RNA", verbose = FALSE)
DefaultAssay(seuratObj) <- "RNA"

# Optional: keep COTAN payload
seuratObj@misc$COTAN <- S4Vectors::metadata(sceObj)
Extract CS_CORE corr matrix
#seuratObj@assays$RNA@counts <- ceiling(seuratObj@assays$RNA@counts)
csCoreRes <- CSCORE(seuratObj, genes = genesFromListExpressed)
[INFO] IRLS converged after 3 iterations.
[INFO] Starting WLS for covariance at Wed Jan 21 12:30:30 2026
[INFO] 9 among 58 genes have invalid variance estimates. Their co-expressions with other genes were set to 0.
[INFO] 0.8469% co-expression estimates were greater than 1 and were set to 1.
[INFO] 0.0000% co-expression estimates were smaller than -1 and were set to -1.
[INFO] Finished WLS. Elapsed time: 1.5424 seconds.mat <- as.matrix(csCoreRes$est)
diag(mat) <- 0
split.genes <- base::factor(c(rep("CD4 T cells",sum(genesList[["CD4 T cells"]] %in% genesFromListExpressed)),
rep("HK",sum(genesList[["hk"]] %in% genesFromListExpressed)),
rep("B cells",sum(genesList[["B cells"]] %in% genesFromListExpressed))
),
levels = c("CD4 T cells","HK","B cells"))
f1 = colorRamp2(seq(-1,1, length = 3), c("#DC0000B2", "white","#3C5488B2" ))
htmp <- Heatmap(as.matrix(mat[c(genesList$`CD4 T cells`,genesList$hk,genesList$`B cells`),c(genesList$`CD4 T cells`,genesList$hk,genesList$`B cells`)]),
#width = ncol(coexMat)*unit(2.5, "mm"),
height = nrow(mat)*unit(3, "mm"),
cluster_rows = FALSE,
cluster_columns = FALSE,
col = f1,
row_names_side = "left",
row_names_gp = gpar(fontsize = 11),
column_names_gp = gpar(fontsize = 11),
column_split = split.genes,
row_split = split.genes,
cluster_row_slices = FALSE,
cluster_column_slices = FALSE,
heatmap_legend_param = list(
title = "CS-CORE", at = c(-1, 0, 1),
direction = "horizontal",
labels = c("-1", "0", "1")
)
)
draw(htmp, heatmap_legend_side="right")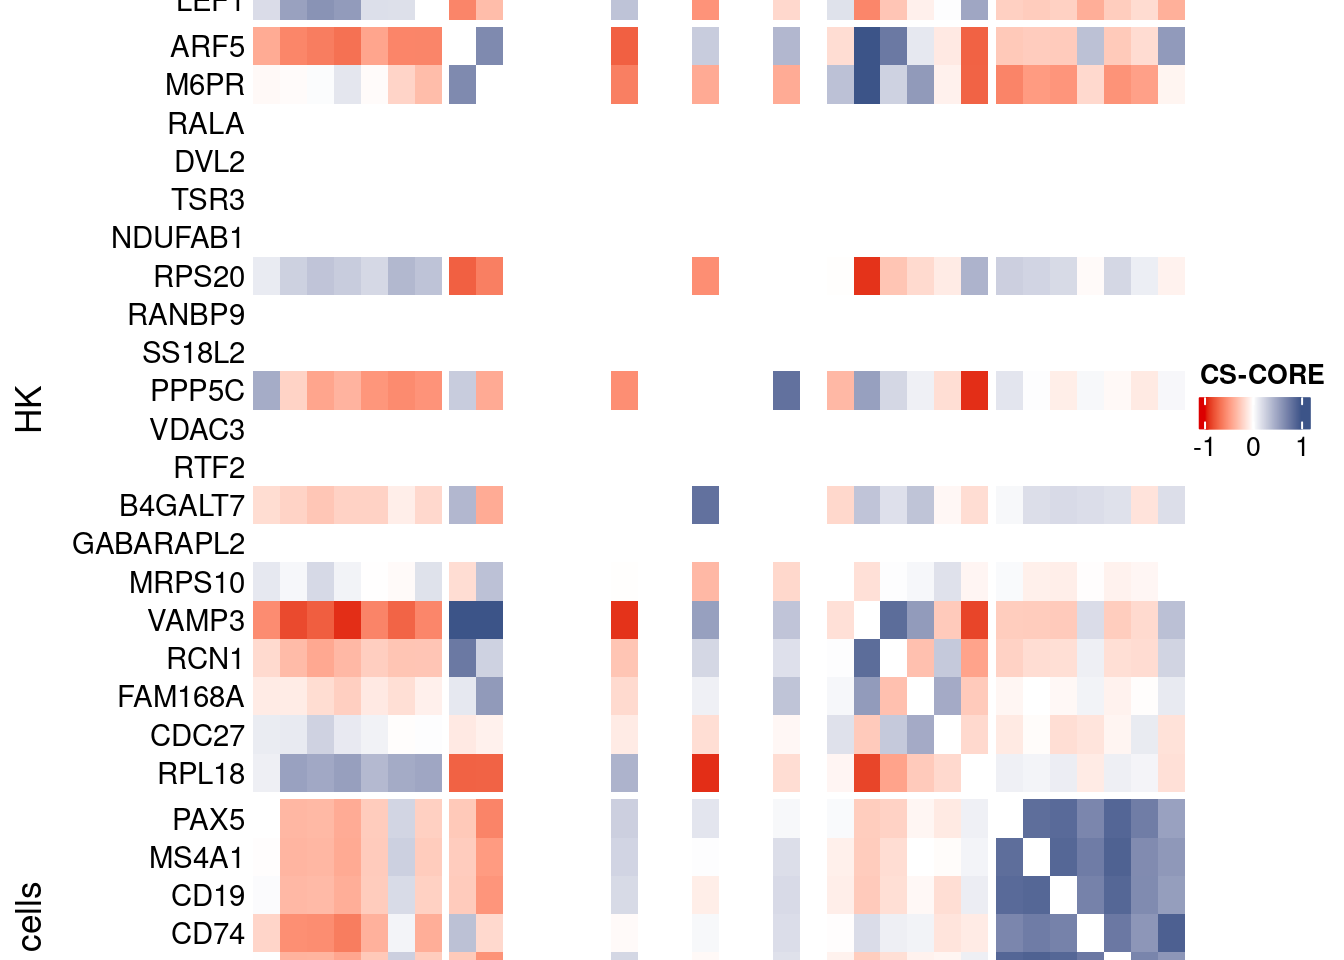
Save CS_CORE matrix
write_fst(as.data.frame(csCoreRes$est), path = paste0("CoexData/CS_CORECorr_", file_code,".fst"),compress = 100)
write_fst(as.data.frame(csCoreRes$p_value), path = paste0("CoexData/CS_COREPValues_", file_code,".fst"),compress = 100)
write.csv(as.data.frame(csCoreRes$p_value), paste0("CoexData/CS_COREPValues_", file_code,".csv"))
Baseline: Spearman on UMI counts
corr.pval.list <- correlation_pvaluesSpearman(data = getRawData(obj),
                                      genesFromListExpressed,
                                      n.cells = getNumCells(obj))

data.cor.big <- as.matrix(Matrix::forceSymmetric(corr.pval.list$data.cor, uplo = "U"))

htmp <- correlation_plot(data.cor.big,
                         genesList, title="UMI baseline S. corr")


p_values.fromSp.C <- corr.pval.list$p_values
data.cor.bigSp.C <- corr.pval.list$data.cor

rm(corr.pval.list)
gc()
used (Mb) gc trigger (Mb) max used (Mb)
Ncells 11086433 592.1 17840938 952.9 17840938 952.9
Vcells 427355968 3260.5 1152022364 8789.3 1152020021 8789.3draw(htmp, heatmap_legend_side="right")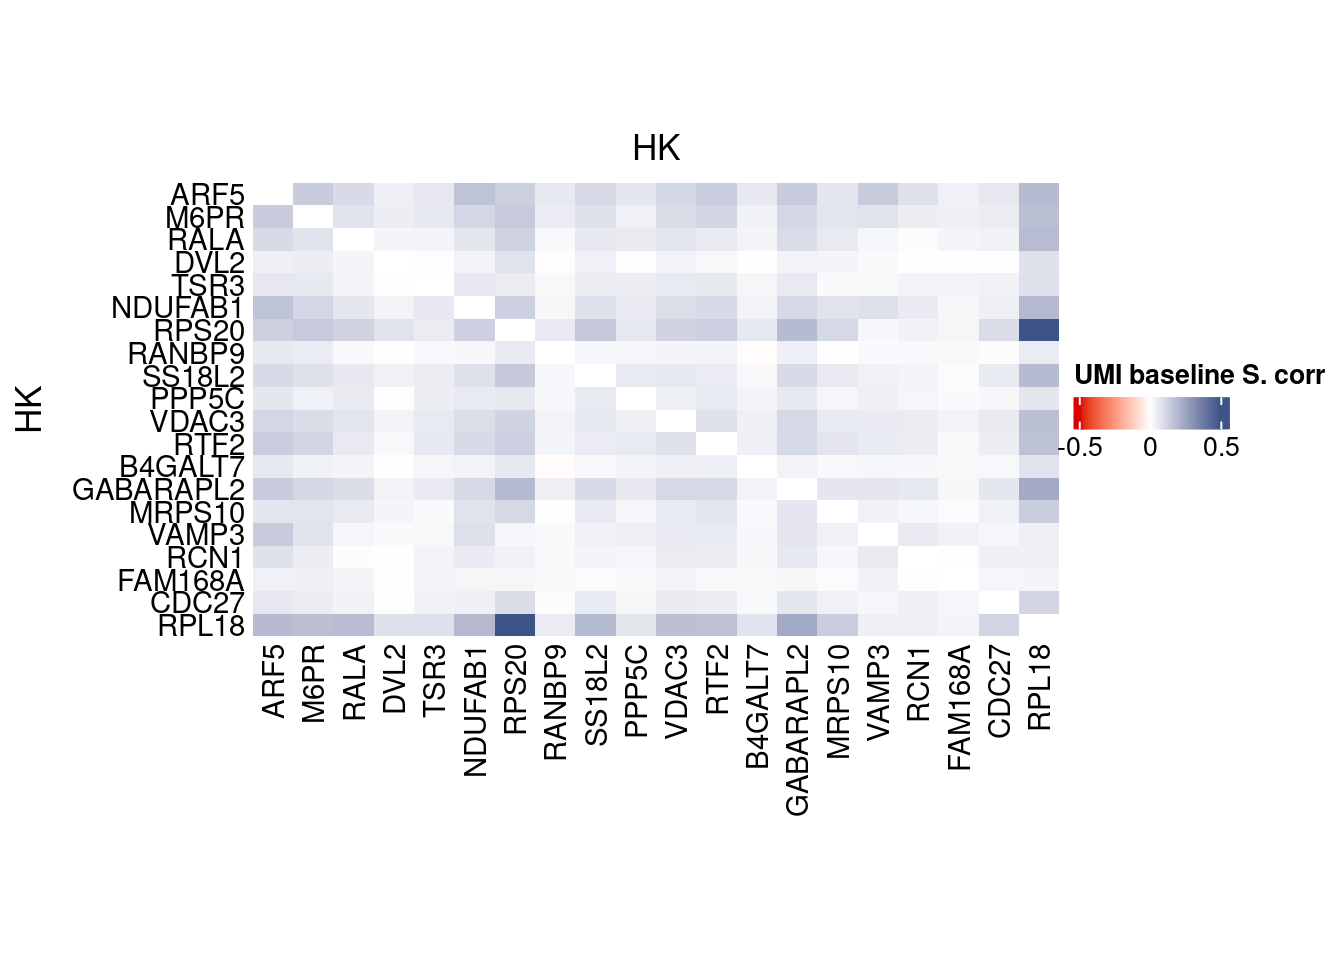
write.csv(as.data.frame(p_values.fromSp.C), paste0("CoexData/BaselineUMISpCorrPValues_", file_code,".csv"))Baseline: Pearson on binarized counts
corr.pval.list <- correlation_pvalues(data = getZeroOneProj(obj),
                                      genesFromListExpressed,
                                      n.cells = getNumCells(obj))

data.cor.big <- as.matrix(Matrix::forceSymmetric(corr.pval.list$data.cor, uplo = "U"))

htmp <- correlation_plotPBMC(data.cor.big,
                         genesList, title="Zero-one P. corr")


p_values.fromSp.C <- corr.pval.list$p_values
data.cor.bigSp.C <- corr.pval.list$data.cor

rm(corr.pval.list)
gc()
used (Mb) gc trigger (Mb) max used (Mb)
Ncells 11086497 592.1 17840938 952.9 17840938 952.9
Vcells 427357002 3260.5 1152022364 8789.3 1152020021 8789.3draw(htmp, heatmap_legend_side="right")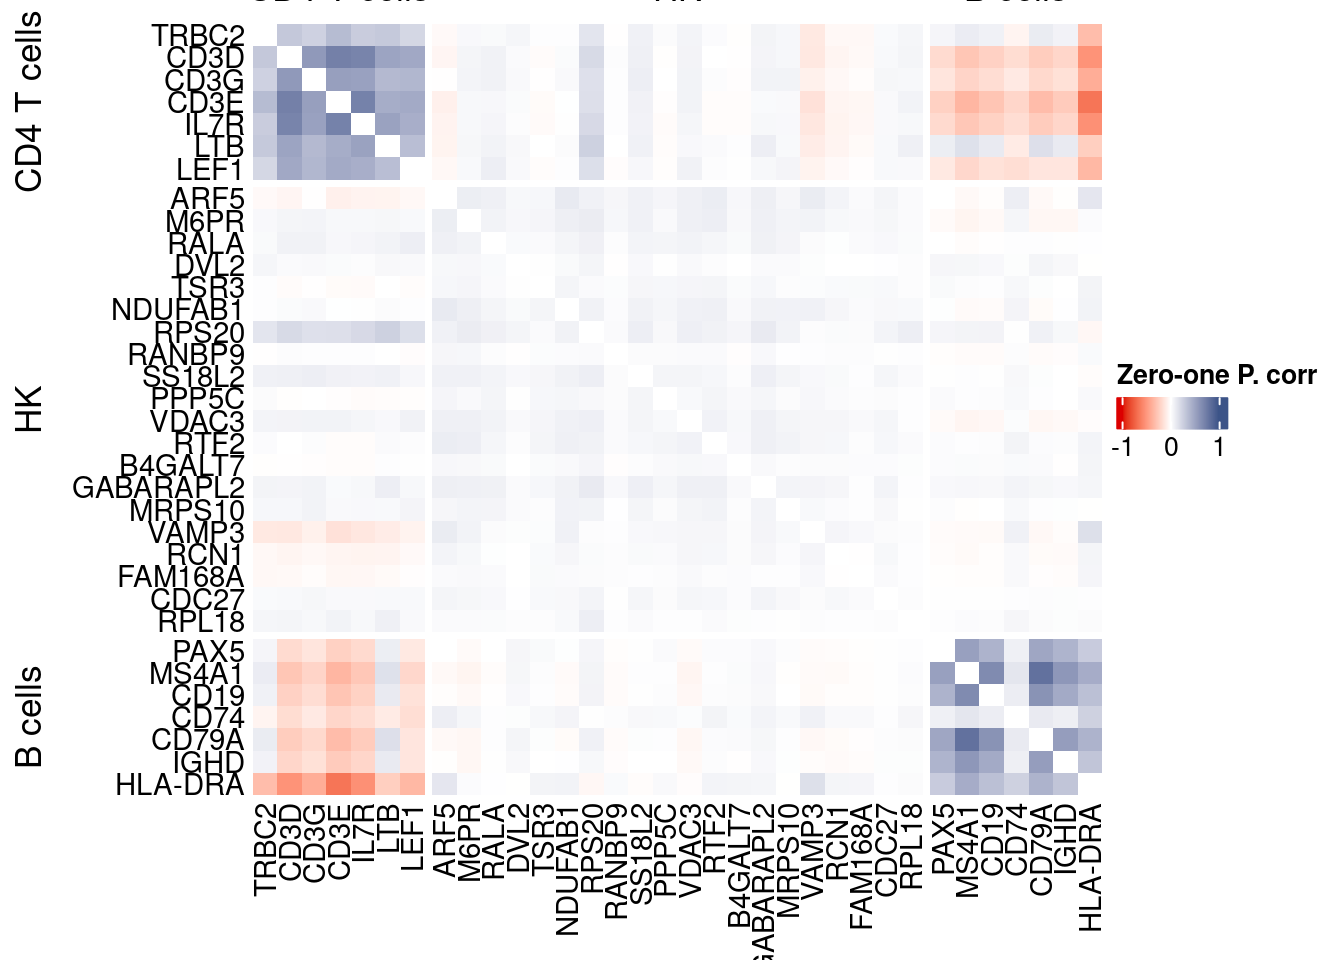
write.csv(as.data.frame(p_values.fromSp.C), paste0("CoexData/ZeroOnePCorrPValues_", file_code,".csv"))Sys.time()[1] "2026-01-21 12:30:36 CET"sessionInfo()R version 4.5.2 (2025-10-31)
Platform: x86_64-pc-linux-gnu
Running under: Ubuntu 22.04.5 LTS
Matrix products: default
BLAS: /usr/lib/x86_64-linux-gnu/blas/libblas.so.3.10.0
LAPACK: /usr/lib/x86_64-linux-gnu/lapack/liblapack.so.3.10.0 LAPACK version 3.10.0
locale:
[1] LC_CTYPE=C.UTF-8 LC_NUMERIC=C LC_TIME=C.UTF-8
[4] LC_COLLATE=C.UTF-8 LC_MONETARY=C.UTF-8 LC_MESSAGES=C.UTF-8
[7] LC_PAPER=C.UTF-8 LC_NAME=C LC_ADDRESS=C
[10] LC_TELEPHONE=C LC_MEASUREMENT=C.UTF-8 LC_IDENTIFICATION=C
time zone: Europe/Rome
tzcode source: system (glibc)
attached base packages:
[1] stats4 parallel grid stats graphics grDevices utils
[8] datasets methods base
other attached packages:
[1] CSCORE_1.0.2 testthat_3.3.2
[3] monocle3_1.3.7 SingleCellExperiment_1.32.0
[5] SummarizedExperiment_1.38.1 GenomicRanges_1.62.1
[7] Seqinfo_1.0.0 IRanges_2.44.0
[9] S4Vectors_0.48.0 MatrixGenerics_1.22.0
[11] matrixStats_1.5.0 Biobase_2.70.0
[13] BiocGenerics_0.56.0 generics_0.1.3
[15] fstcore_0.10.0 fst_0.9.8
[17] stringr_1.6.0 HiClimR_2.2.1
[19] doParallel_1.0.17 iterators_1.0.14
[21] foreach_1.5.2 Rfast_2.1.5.1
[23] RcppParallel_5.1.10 zigg_0.0.2
[25] Rcpp_1.1.0 patchwork_1.3.2
[27] Seurat_5.4.0 SeuratObject_5.3.0
[29] sp_2.2-0 Hmisc_5.2-3
[31] dplyr_1.1.4 circlize_0.4.16
[33] ComplexHeatmap_2.26.0 COTAN_2.11.1
loaded via a namespace (and not attached):
[1] fs_1.6.6 spatstat.sparse_3.1-0
[3] devtools_2.4.5 httr_1.4.7
[5] RColorBrewer_1.1-3 profvis_0.4.0
[7] tools_4.5.2 sctransform_0.4.2
[9] backports_1.5.0 R6_2.6.1
[11] lazyeval_0.2.2 uwot_0.2.3
[13] ggdist_3.3.3 GetoptLong_1.1.0
[15] urlchecker_1.0.1 withr_3.0.2
[17] gridExtra_2.3 parallelDist_0.2.6
[19] progressr_0.18.0 cli_3.6.5
[21] Cairo_1.7-0 spatstat.explore_3.6-0
[23] fastDummies_1.7.5 labeling_0.4.3
[25] S7_0.2.1 spatstat.data_3.1-9
[27] proxy_0.4-29 ggridges_0.5.6
[29] pbapply_1.7-2 foreign_0.8-90
[31] sessioninfo_1.2.3 parallelly_1.46.0
[33] torch_0.16.3 rstudioapi_0.18.0
[35] shape_1.4.6.1 ica_1.0-3
[37] spatstat.random_3.4-3 distributional_0.6.0
[39] dendextend_1.19.0 Matrix_1.7-4
[41] abind_1.4-8 lifecycle_1.0.4
[43] yaml_2.3.10 SparseArray_1.10.8
[45] Rtsne_0.17 glmGamPoi_1.20.0
[47] promises_1.5.0 crayon_1.5.3
[49] miniUI_0.1.2 lattice_0.22-7
[51] beachmat_2.26.0 cowplot_1.2.0
[53] magick_2.9.0 zeallot_0.2.0
[55] pillar_1.11.1 knitr_1.50
[57] rjson_0.2.23 boot_1.3-32
[59] future.apply_1.20.0 codetools_0.2-20
[61] glue_1.8.0 spatstat.univar_3.1-6
[63] remotes_2.5.0 data.table_1.18.0
[65] Rdpack_2.6.4 vctrs_0.7.0
[67] png_0.1-8 spam_2.11-1
[69] gtable_0.3.6 assertthat_0.2.1
[71] cachem_1.1.0 xfun_0.52
[73] rbibutils_2.3 S4Arrays_1.10.1
[75] mime_0.13 reformulas_0.4.1
[77] survival_3.8-3 ncdf4_1.24
[79] ellipsis_0.3.2 fitdistrplus_1.2-2
[81] ROCR_1.0-11 nlme_3.1-168
[83] usethis_3.2.1 bit64_4.6.0-1
[85] RcppAnnoy_0.0.22 rprojroot_2.1.1
[87] GenomeInfoDb_1.44.0 irlba_2.3.5.1
[89] KernSmooth_2.23-26 otel_0.2.0
[91] rpart_4.1.24 colorspace_2.1-1
[93] nnet_7.3-20 tidyselect_1.2.1
[95] processx_3.8.6 bit_4.6.0
[97] compiler_4.5.2 htmlTable_2.4.3
[99] desc_1.4.3 DelayedArray_0.36.0
[101] plotly_4.11.0 checkmate_2.3.2
[103] scales_1.4.0 lmtest_0.9-40
[105] callr_3.7.6 digest_0.6.37
[107] goftest_1.2-3 spatstat.utils_3.2-1
[109] minqa_1.2.8 rmarkdown_2.29
[111] XVector_0.50.0 htmltools_0.5.8.1
[113] pkgconfig_2.0.3 base64enc_0.1-3
[115] coro_1.1.0 lme4_1.1-37
[117] sparseMatrixStats_1.20.0 fastmap_1.2.0
[119] rlang_1.1.7 GlobalOptions_0.1.2
[121] htmlwidgets_1.6.4 ggthemes_5.2.0
[123] UCSC.utils_1.4.0 shiny_1.12.1
[125] DelayedMatrixStats_1.30.0 farver_2.1.2
[127] zoo_1.8-14 jsonlite_2.0.0
[129] BiocParallel_1.44.0 BiocSingular_1.26.1
[131] magrittr_2.0.4 Formula_1.2-5
[133] GenomeInfoDbData_1.2.14 dotCall64_1.2
[135] viridis_0.6.5 reticulate_1.44.1
[137] stringi_1.8.7 brio_1.1.5
[139] MASS_7.3-65 pkgbuild_1.4.7
[141] plyr_1.8.9 listenv_0.10.0
[143] ggrepel_0.9.6 deldir_2.0-4
[145] splines_4.5.2 tensor_1.5
[147] ps_1.9.1 igraph_2.2.1
[149] spatstat.geom_3.6-1 RcppHNSW_0.6.0
[151] pkgload_1.4.0 reshape2_1.4.4
[153] ScaledMatrix_1.16.0 evaluate_1.0.5
[155] nloptr_2.2.1 httpuv_1.6.16
[157] RANN_2.6.2 tidyr_1.3.1
[159] purrr_1.2.0 polyclip_1.10-7
[161] future_1.69.0 clue_0.3-66
[163] scattermore_1.2 ggplot2_4.0.1
[165] rsvd_1.0.5 xtable_1.8-4
[167] RSpectra_0.16-2 later_1.4.2
[169] viridisLite_0.4.2 tibble_3.3.0
[171] memoise_2.0.1 cluster_2.1.8.1
[173] globals_0.18.0