library(COTAN)
library(ComplexHeatmap)
library(circlize)
library(dplyr)
library(Hmisc)
library(Seurat)
library(patchwork)
library(Rfast)
library(parallel)
library(doParallel)
library(HiClimR)
library(stringr)
library(fst)

options(parallelly.fork.enable = TRUE)

dataFile <- "Data/PBMC4/filtered/PBMC4.cotan.RDS"
name <- str_split(dataFile,pattern = "/",simplify = T)[4]
name <- str_remove(name,pattern = ".cotan.RDS")

project = name

setLoggingLevel(1)
outDir <- "CoexData/"
setLoggingFile(paste0(outDir, "Logs/",name,".log"))

obj <- readRDS(dataFile)
file_code = nameGene Correlation Analysis for PBMC 2
Prologue
source("src/Functions.R")To compare the ability of COTAN to asses the real correlation between genes we define some pools of genes:
- Constitutive genes
- Neural progenitor genes
- Pan neuronal genes
- Some layer marker genes
hkGenes  <- read.csv("Data/Housekeeping_TranscriptsHuman.csv", sep = ";")

genesList <- list(
  "CD4 T cells"=
    c("TRBC2","CD3D","CD3G","CD3E","IL7R","LTB","LEF1"),
  "B cells"=
    c("PAX5","MS4A1","CD19","CD74","CD79A","IGHD","HLA-DRA"),
  "hk"= hkGenes$Gene_symbol[1:20], # from https://housekeeping.unicamp.br/
  "general PBMC markers" =
  c("FOXP3","TBX21","GATA3","RUNX1","BCL6","EOMES","EOMES","TBX21","BATF3","IRF2","TCF4","STAT5A","RUNX3","STAT6","BATF","STAT3","TBX21","TBX21","IRF8","IRF4","AHR","STAT1","IRF4","RELB")
)
COTAN
genesFromListExpressed <- unlist(genesList)[unlist(genesList) %in% getGenes(obj)]
int.genes <-getGenes(obj)
obj <- proceedToCoex(obj, calcCoex = TRUE, cores = 5L, saveObj = FALSE)coexMat.big <- getGenesCoex(obj)[genesFromListExpressed,genesFromListExpressed]
coexMat <- getGenesCoex(obj)[c(genesList$`CD4 T cells`,genesList$hk,genesList$`B cells`),c(genesList$`CD4 T cells`,genesList$hk,genesList$`B cells`)]
f1 = colorRamp2(seq(-1,1, length = 3), c("#DC0000B2", "white","#3C5488B2" ))
split.genes <- base::factor(c(rep("CD4 T cells",length(genesList[["CD4 T cells"]])),
rep("HK",length(genesList[["hk"]])),
rep("B cells",length(genesList[["B cells"]]))
),
levels = c("CD4 T cells","HK","B cells"))
lgd = Legend(col_fun = f1, title = "COTAN coex")
htmp <- Heatmap(as.matrix(coexMat),
#width = ncol(coexMat)*unit(2.5, "mm"),
height = nrow(coexMat)*unit(3, "mm"),
cluster_rows = FALSE,
cluster_columns = FALSE,
col = f1,
row_names_side = "left",
row_names_gp = gpar(fontsize = 11),
column_names_gp = gpar(fontsize = 11),
column_split = split.genes,
row_split = split.genes,
cluster_row_slices = FALSE,
cluster_column_slices = FALSE,
heatmap_legend_param = list(
title = "COTAN coex", at = c(-1, 0, 1),
direction = "horizontal",
labels = c("-1", "0", "1")
)
)
draw(htmp, heatmap_legend_side="right")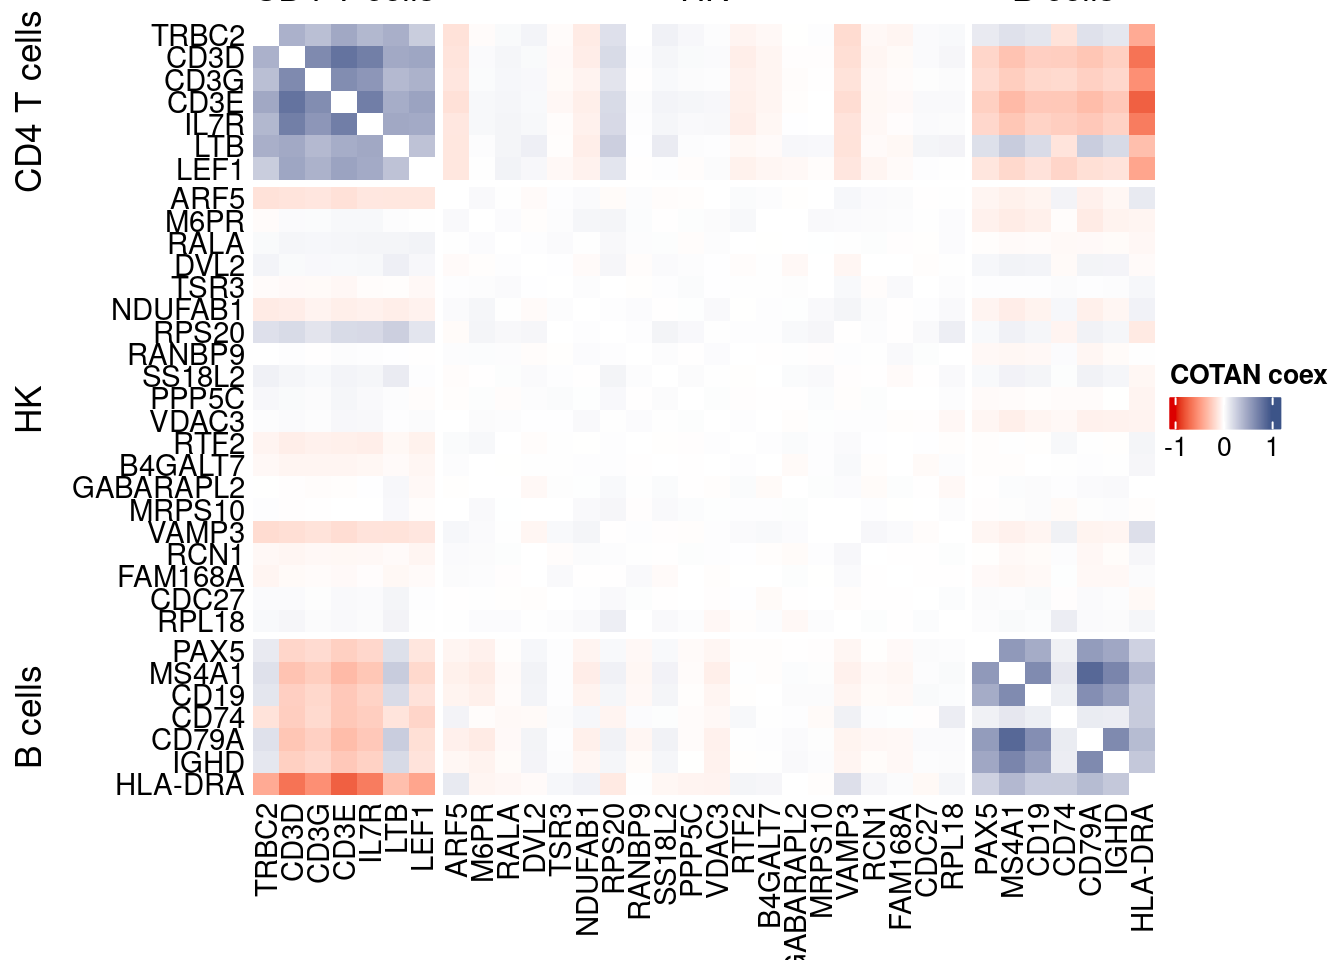
GDI_DF <- calculateGDI(obj)
GDI_DF$geneType <- NA
for (cat in names(genesList)) {
  GDI_DF[rownames(GDI_DF) %in% genesList[[cat]],]$geneType <- cat
}

GDI_DF$GDI_centered <- scale(GDI_DF$GDI,center = T,scale = T)

GDI_DF[genesFromListExpressed,]
sum.raw.norm GDI exp.cells geneType GDI_centered
TRBC2 9.008002 4.896647 47.803618 CD4 T cells 3.91190714
CD3D 9.063175 5.067593 40.898651 CD4 T cells 4.14536014
CD3G 8.310498 4.715567 31.940856 CD4 T cells 3.66461405
CD3E 9.762509 5.238840 48.191214 CD4 T cells 4.37922498
IL7R 9.656869 4.919483 40.037324 CD4 T cells 3.94309317
LTB 10.401854 4.887723 65.001436 CD4 T cells 3.89971938
LEF1 8.058861 4.391309 23.112260 CD4 T cells 3.22178905
PAX5 6.591625 3.814772 6.718346 B cells 2.43443785
MS4A1 8.776001 4.514409 15.862762 B cells 3.38990144
CD19 6.905618 4.031778 8.512776 B cells 2.73079272
CD74 12.326183 3.257303 91.200115 B cells 1.67312742
CD79A 9.280568 4.486961 17.527993 B cells 3.35241646
IGHD 7.548222 4.121811 9.948320 B cells 2.85374755
HLA-DRA 10.788265 5.093560 51.751364 B cells 4.18082287
ARF5 8.955371 2.944378 60.551249 hk 1.24577953
M6PR 8.323870 2.196959 42.190640 hk 0.22506150
RALA 7.245491 1.584228 18.030434 hk -0.61171852
DVL2 6.192982 2.046346 6.747057 hk 0.01937548
TSR3 6.402080 1.603321 8.498421 hk -0.58564343
NDUFAB1 8.182674 2.626193 38.817112 hk 0.81124829
RPS20 10.080418 3.312841 85.730692 hk 1.74897317
RANBP9 5.954637 1.642594 5.512489 hk -0.53201005
SS18L2 7.686466 2.220272 26.744186 hk 0.25689961
PPP5C 6.448891 1.820097 8.914729 hk -0.28960193
VDAC3 7.665665 1.833019 25.724950 hk -0.27195563
RTF2 7.934371 2.043249 32.357163 hk 0.01514693
B4GALT7 6.307674 1.766738 7.622739 hk -0.36247214
GABARAPL2 8.554688 1.661932 49.526270 hk -0.50560124
MRPS10 6.871891 1.745451 13.192650 hk -0.39154333
VAMP3 7.242319 3.336363 17.327017 hk 1.78109564
RCN1 5.945229 2.053062 5.555556 hk 0.02854828
FAM168A 5.458289 1.738949 3.344818 hk -0.40042320
CDC27 6.679547 1.582908 10.594315 hk -0.61352153
RPL18 11.909427 2.262289 99.339650 hk 0.31427927
FOXP3 5.718916 2.122965 1.665231 general PBMC markers 0.12401188
TBX21 7.316210 3.633707 10.766581 general PBMC markers 2.18716456
GATA3 7.670988 4.094681 19.595177 general PBMC markers 2.81669773
RUNX1 7.185177 1.671365 16.020672 general PBMC markers -0.49271854
BCL6 6.614108 3.338401 8.211312 general PBMC markers 1.78387846
EOMES 6.579538 3.352481 6.732702 general PBMC markers 1.80310742
EOMES.1 6.579538 3.352481 6.732702 general PBMC markers 1.80310742
TBX21.1 7.316210 3.633707 10.766581 general PBMC markers 2.18716456
BATF3 5.101389 3.353337 2.354292 general PBMC markers 1.80427595
IRF2 7.616339 1.797201 23.801321 general PBMC markers -0.32086967
TCF4 7.252424 3.717850 11.900660 general PBMC markers 2.30207537
STAT5A 7.349242 1.644369 19.293712 general PBMC markers -0.52958655
RUNX3 7.416358 2.495923 18.906115 general PBMC markers 0.63334336
STAT6 7.973470 2.716027 31.596325 general PBMC markers 0.93392963
BATF 7.050932 2.400865 13.178295 general PBMC markers 0.50352678
STAT3 8.457601 1.762068 44.214757 general PBMC markers -0.36884967
TBX21.2 7.316210 3.633707 10.766581 general PBMC markers 2.18716456
TBX21.3 7.316210 3.633707 10.766581 general PBMC markers 2.18716456
IRF8 8.115906 3.954635 24.160207 general PBMC markers 2.62544297
IRF4 6.406304 2.898158 6.890612 general PBMC markers 1.18265808
AHR 7.090951 3.171018 13.881711 general PBMC markers 1.55529160
STAT1 7.764831 1.831163 22.954350 general PBMC markers -0.27449039
IRF4.1 6.406304 2.898158 6.890612 general PBMC markers 1.18265808
RELB 7.971723 2.816814 28.883147 general PBMC markers 1.07157066GDIPlot(obj,GDIIn = GDI_DF, genes = genesList,GDIThreshold = 1.4)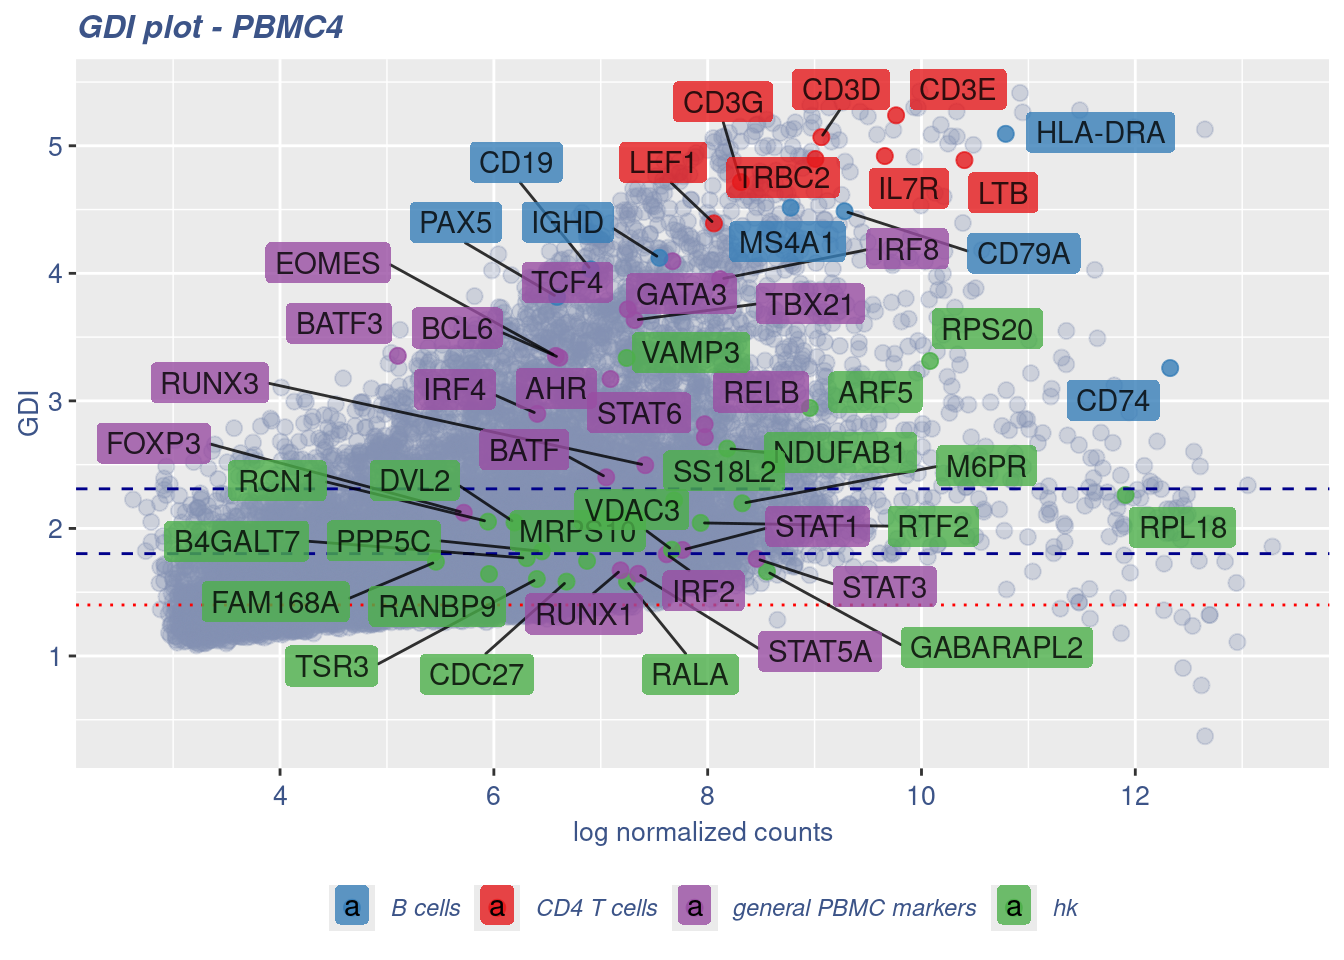
Seurat correlation
srat<- CreateSeuratObject(counts = getRawData(obj),
                          project = project,
                          min.cells = 3,
                          min.features = 200)
srat[["percent.mt"]] <- PercentageFeatureSet(srat, pattern = "^MT-")
srat <- NormalizeData(srat)
srat <- FindVariableFeatures(srat, selection.method = "vst", nfeatures = 2000)

# plot variable features with and without labels
plot1 <- VariableFeaturePlot(srat)

plot1$data$centered_variance <- scale(plot1$data$variance.standardized,
                                      center = T,scale = F)

write.csv(plot1$data,paste0("CoexData/",
                            "Variance_Seurat_genes",
                            getMetadataElement(obj,
                                               datasetTags()[["cond"]]),".csv"))

LabelPoints(plot = plot1, points = c(genesList$`CD4 T cells`,genesList$`B cells`,genesList$hk), repel = TRUE)
LabelPoints(plot = plot1, points = c(genesList$hk), repel = TRUE)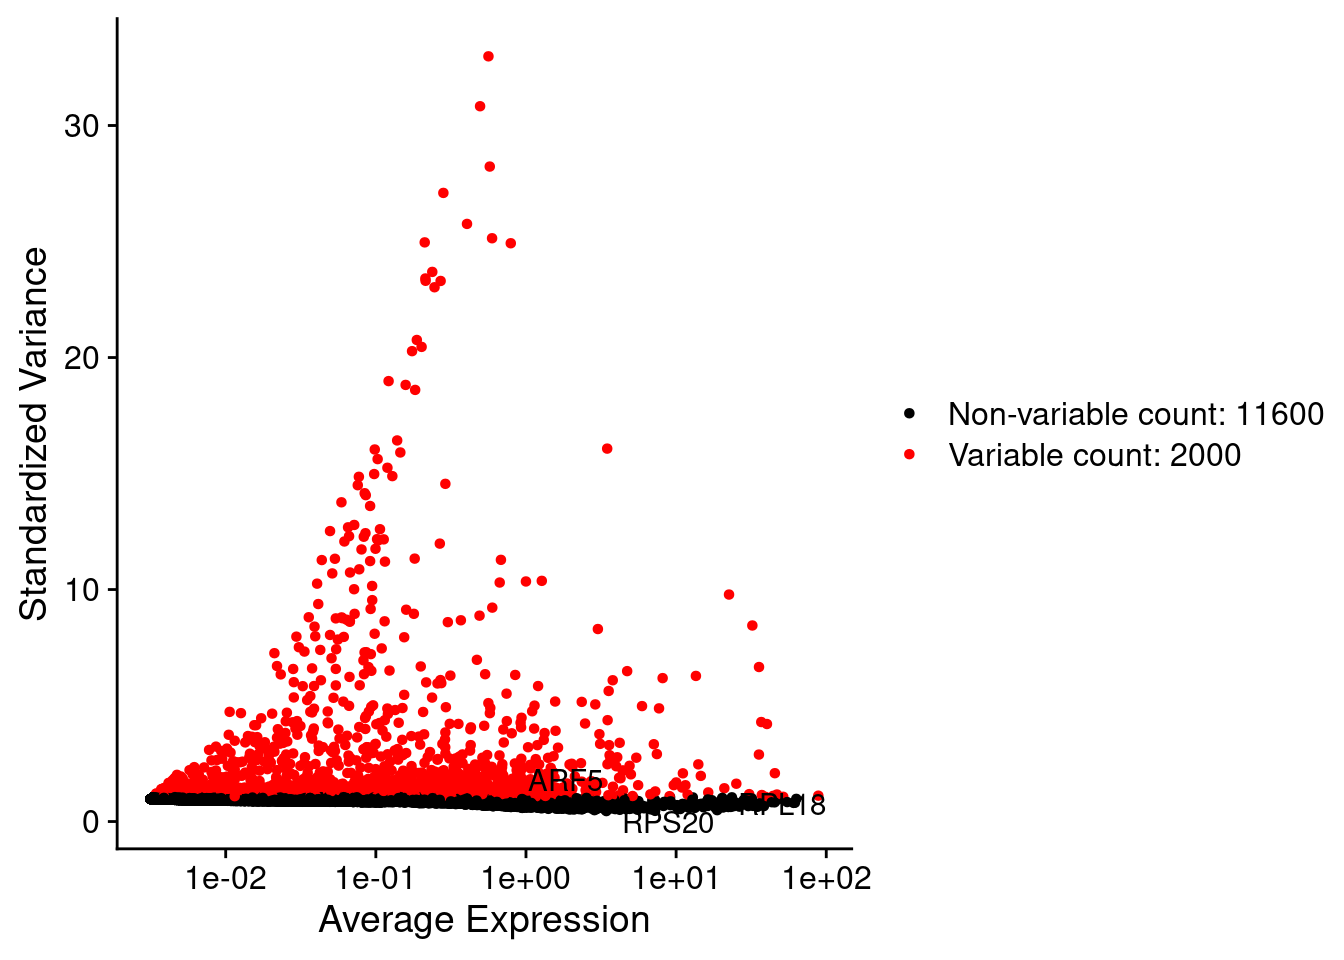
all.genes <- rownames(srat)
srat <- ScaleData(srat, features = all.genes)
seurat.data = GetAssayData(srat[["RNA"]],layer = "data")
corr.pval.list <- correlation_pvalues(data = seurat.data,
genesFromListExpressed,
n.cells = getNumCells(obj))
seurat.data.cor.big <- as.matrix(Matrix::forceSymmetric(corr.pval.list$data.cor, uplo = "U"))
htmp <- correlation_plotPBMC(seurat.data.cor.big,
genesList, title="Seurat corr")
p_values.fromSeurat <- corr.pval.list$p_values
seurat.data.cor.big <- corr.pval.list$data.cor
rm(corr.pval.list)
gc() used (Mb) gc trigger (Mb) max used (Mb)
Ncells 10441231 557.7 17840938 952.9 17840938 952.9
Vcells 274419773 2093.7 566945213 4325.5 1144356990 8730.8draw(htmp, heatmap_legend_side="right")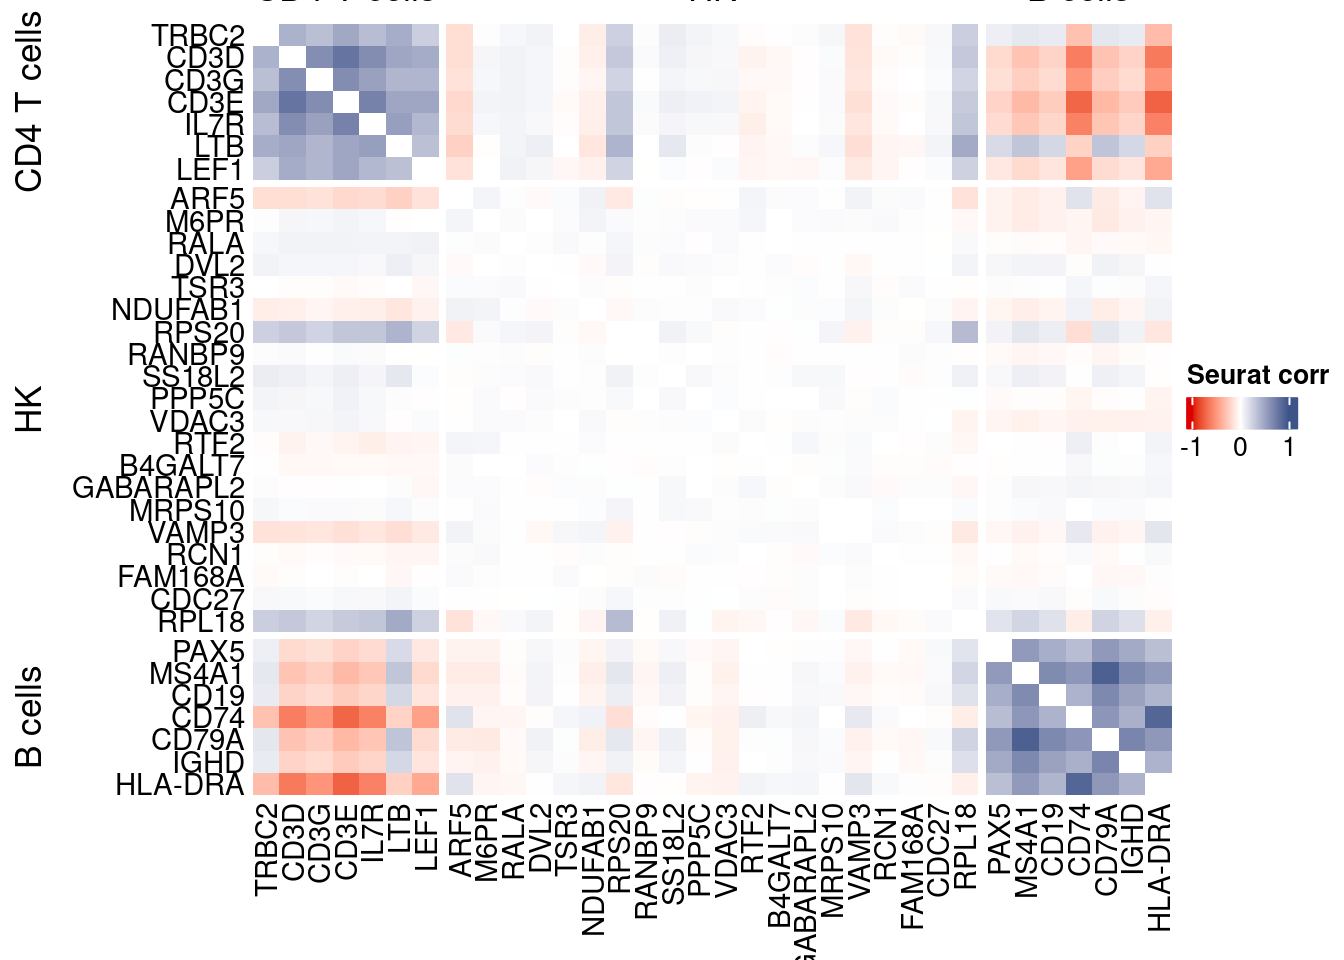
rm(seurat.data.cor.big)
rm(p_values.fromSeurat)
Seurat SC Transform
srat <-  SCTransform(srat,
                     method = "glmGamPoi",
                     vars.to.regress = "percent.mt",
                     verbose = FALSE)

seurat.data <- GetAssayData(srat[["SCT"]],layer = "data")

#Remove genes with all zeros
seurat.data <-seurat.data[rowSums(seurat.data) > 0,]


corr.pval.list <- correlation_pvalues(seurat.data,
                                      genesFromListExpressed,
                                      n.cells = getNumCells(obj))


seurat.data.cor.big <- as.matrix(Matrix::forceSymmetric(corr.pval.list$data.cor, uplo = "U"))

htmp <- correlation_plotPBMC(seurat.data.cor.big,
                         genesList, title="Seurat corr SCT")


p_values.fromSeurat <- corr.pval.list$p_values
seurat.data.cor.big <- corr.pval.list$data.cor

rm(corr.pval.list)
gc()
used (Mb) gc trigger (Mb) max used (Mb)
Ncells 10769411 575.2 17840938 952.9 17840938 952.9
Vcells 328984547 2510.0 816577106 6230.0 1144356990 8730.8draw(htmp, heatmap_legend_side="right")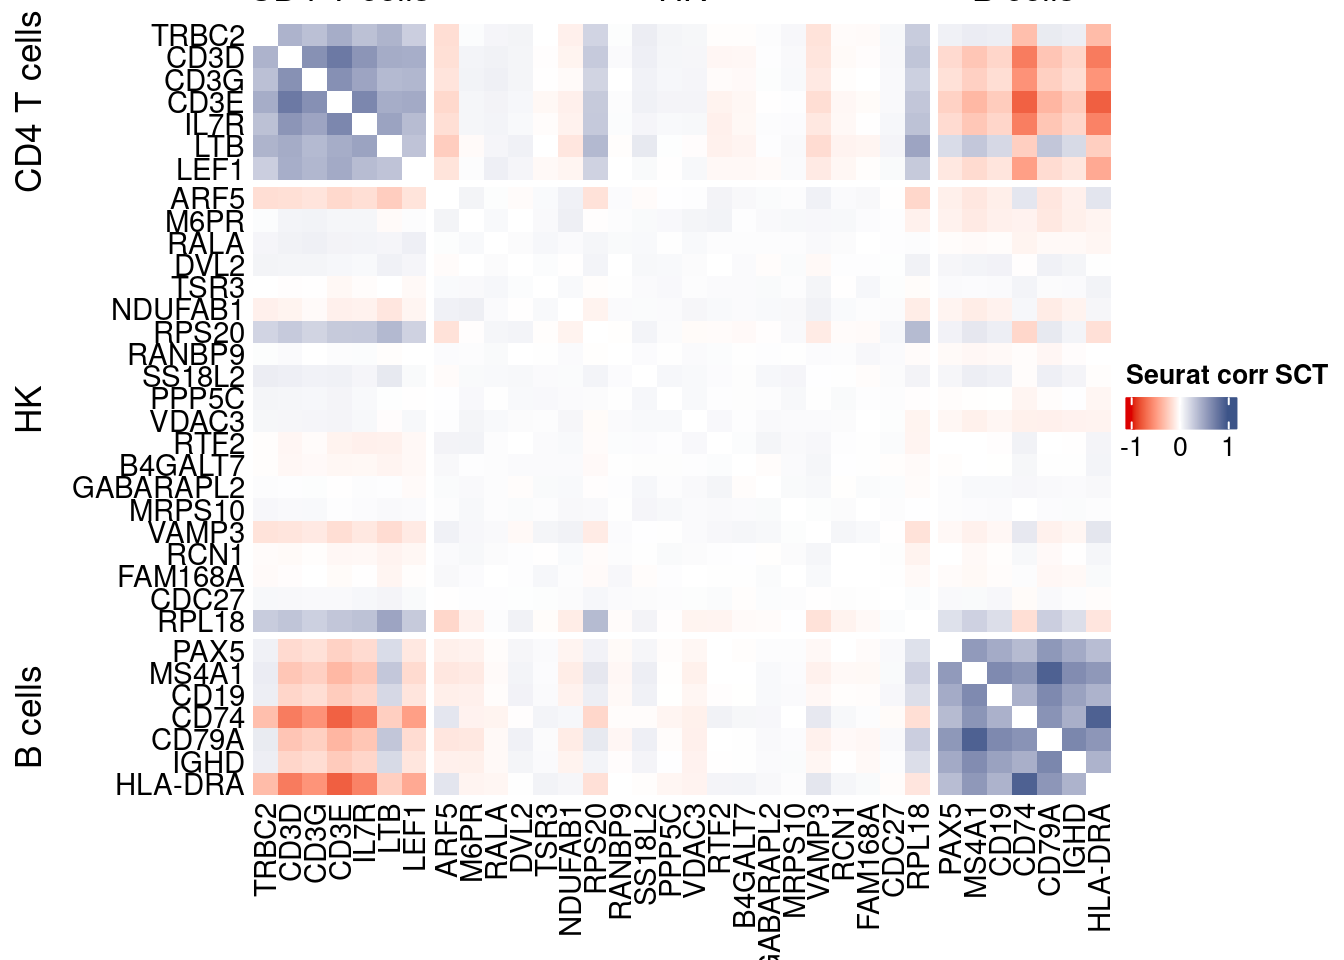
plot1 <- VariableFeaturePlot(srat)

plot1$data$centered_variance <- scale(plot1$data$residual_variance,
center = T,scale = F)write.csv(plot1$data,paste0("CoexData/",
"Variance_SeuratSCT_genes",
getMetadataElement(obj,
datasetTags()[["cond"]]),".csv"))
write_fst(as.data.frame(seurat.data.cor.big),path = paste0("CoexData/SeuratCorrSCT_",file_code,".fst"), compress = 100)
write_fst(as.data.frame(p_values.fromSeurat),path = paste0("CoexData/SeuratPValuesSCT_", file_code,".fst"))
write.csv(as.data.frame(p_values.fromSeurat),paste0("CoexData/SeuratPValuesSCT_", file_code,".csv"))
rm(seurat.data.cor.big)
rm(p_values.fromSeurat)Monocle
library(monocle3)cds <- new_cell_data_set(getRawData(obj),
cell_metadata = getMetadataCells(obj),
gene_metadata = getMetadataGenes(obj)
)
cds <- preprocess_cds(cds, num_dim = 100)
normalized_counts <- normalized_counts(cds)#Remove genes with all zeros
normalized_counts <- normalized_counts[rowSums(normalized_counts) > 0,]
corr.pval.list <- correlation_pvalues(normalized_counts,
genesFromListExpressed,
n.cells = getNumCells(obj))
rm(normalized_counts)
monocle.data.cor.big <- as.matrix(Matrix::forceSymmetric(corr.pval.list$data.cor, uplo = "U"))
htmp <- correlation_plotPBMC(data.cor.big = monocle.data.cor.big,
genesList,
title = "Monocle corr")
p_values.from.monocle <- corr.pval.list$p_values
monocle.data.cor.big <- corr.pval.list$data.cor
rm(corr.pval.list)
gc() used (Mb) gc trigger (Mb) max used (Mb)
Ncells 10955578 585.1 17840938 952.9 17840938 952.9
Vcells 331399238 2528.4 816577106 6230.0 1144356990 8730.8draw(htmp, heatmap_legend_side="right")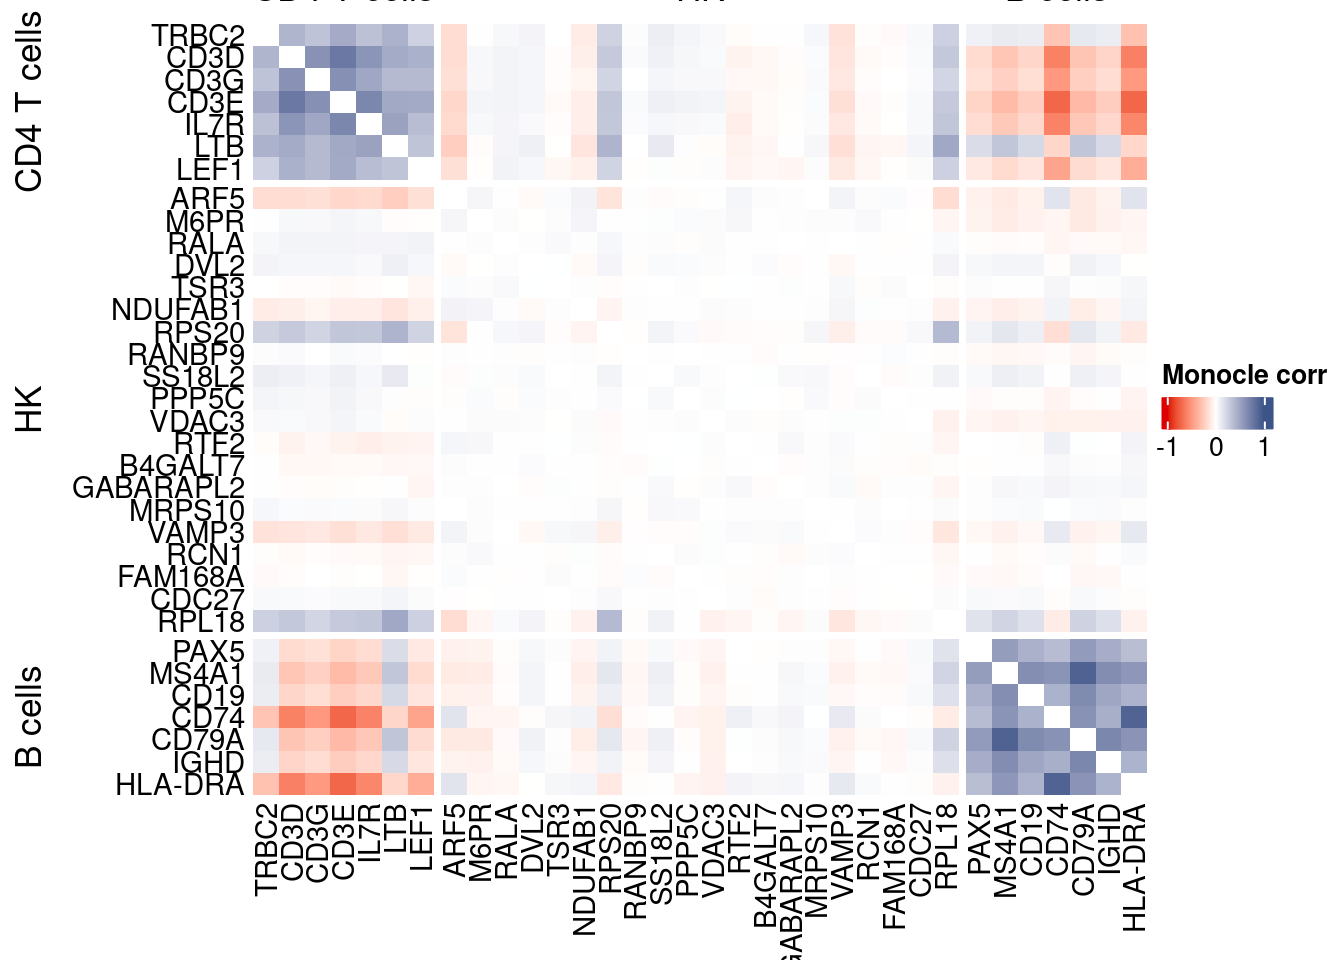
Cs-Core
devtools::load_all("../CS-CORE/")Convert to Seurat obj
sceObj <- convertToSingleCellExperiment(obj)

# Correct: assay=NULL (or omit), data=NULL (since no logcounts)
seuratObj <- as.Seurat(
  x       = sceObj,
  counts  = "counts",
  data    = NULL,
  assay   = NULL,      # IMPORTANT: do NOT set to "RNA" here
  project = "COTAN"
)

# as.Seurat(SCE) creates assay "originalexp" by default; rename it to RNA
seuratObj <- RenameAssays(seuratObj, originalexp = "RNA", verbose = FALSE)
DefaultAssay(seuratObj) <- "RNA"

# Optional: keep COTAN payload
seuratObj@misc$COTAN <- S4Vectors::metadata(sceObj)
Extract CS_CORE corr matrix
#seuratObj@assays$RNA@counts <- ceiling(seuratObj@assays$RNA@counts)
csCoreRes <- CSCORE(seuratObj, genes = genesFromListExpressed)
[INFO] IRLS converged after 3 iterations.
[INFO] Starting WLS for covariance at Wed Jan 21 12:45:50 2026
[INFO] 5 among 58 genes have invalid variance estimates. Their co-expressions with other genes were set to 0.
[INFO] 2.7223% co-expression estimates were greater than 1 and were set to 1.
[INFO] 1.6334% co-expression estimates were smaller than -1 and were set to -1.
[INFO] Finished WLS. Elapsed time: -0.8100 seconds.mat <- as.matrix(csCoreRes$est)
diag(mat) <- 0
split.genes <- base::factor(c(rep("CD4 T cells",sum(genesList[["CD4 T cells"]] %in% genesFromListExpressed)),
rep("HK",sum(genesList[["hk"]] %in% genesFromListExpressed)),
rep("B cells",sum(genesList[["B cells"]] %in% genesFromListExpressed))
),
levels = c("CD4 T cells","HK","B cells"))
f1 = colorRamp2(seq(-1,1, length = 3), c("#DC0000B2", "white","#3C5488B2" ))
htmp <- Heatmap(as.matrix(mat[c(genesList$`CD4 T cells`,genesList$hk,genesList$`B cells`),c(genesList$`CD4 T cells`,genesList$hk,genesList$`B cells`)]),
#width = ncol(coexMat)*unit(2.5, "mm"),
height = nrow(mat)*unit(3, "mm"),
cluster_rows = FALSE,
cluster_columns = FALSE,
col = f1,
row_names_side = "left",
row_names_gp = gpar(fontsize = 11),
column_names_gp = gpar(fontsize = 11),
column_split = split.genes,
row_split = split.genes,
cluster_row_slices = FALSE,
cluster_column_slices = FALSE,
heatmap_legend_param = list(
title = "CS-CORE", at = c(-1, 0, 1),
direction = "horizontal",
labels = c("-1", "0", "1")
)
)
draw(htmp, heatmap_legend_side="right")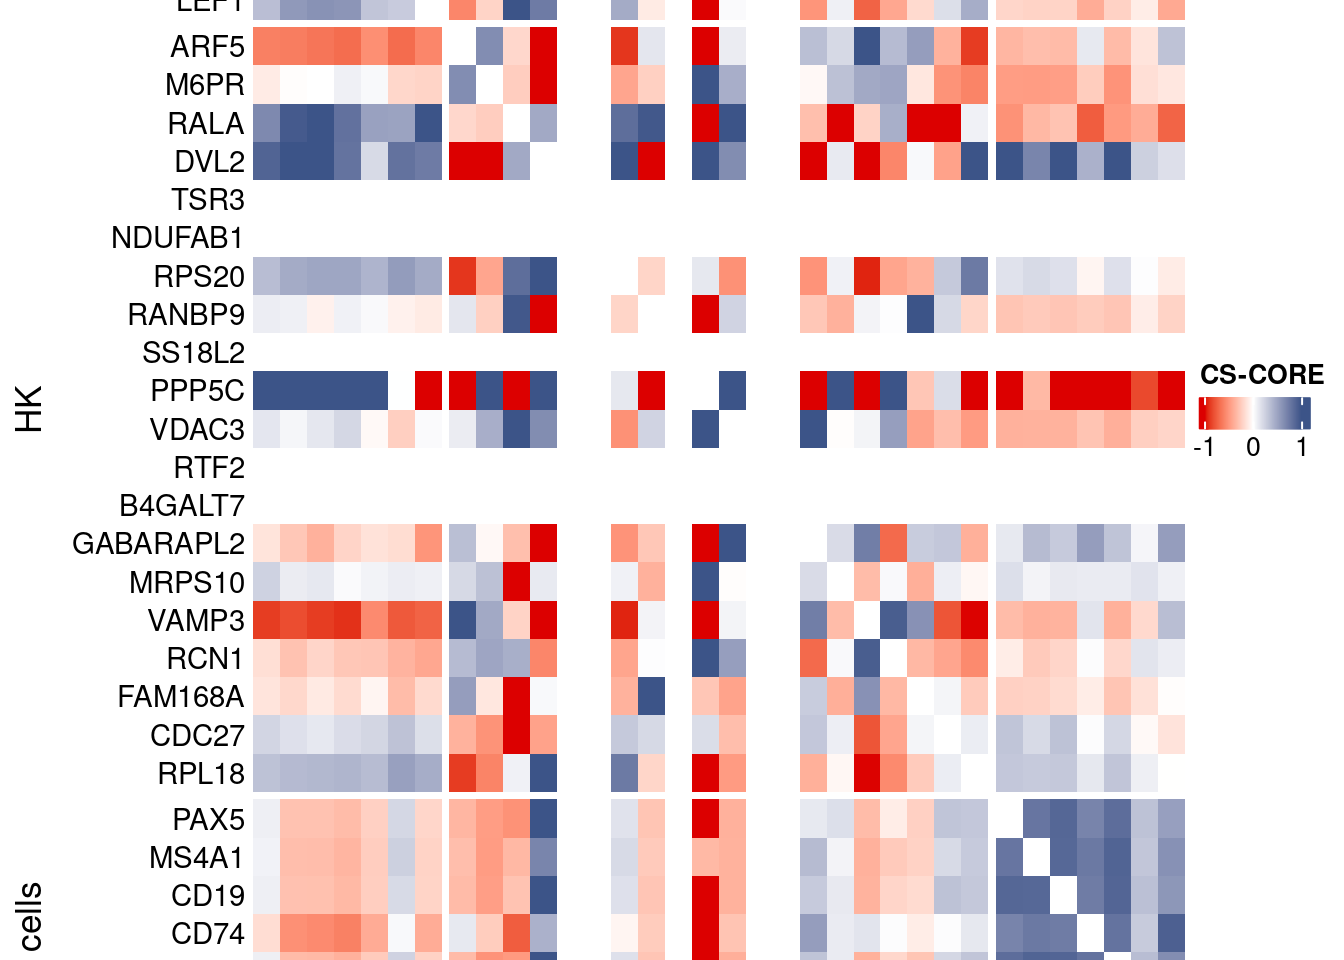
Save CS_CORE matrix
write_fst(as.data.frame(csCoreRes$est), path = paste0("CoexData/CS_CORECorr_", file_code,".fst"),compress = 100)
write_fst(as.data.frame(csCoreRes$p_value), path = paste0("CoexData/CS_COREPValues_", file_code,".fst"),compress = 100)
write.csv(as.data.frame(csCoreRes$p_value), paste0("CoexData/CS_COREPValues_", file_code,".csv"))
Baseline: Spearman on UMI counts
corr.pval.list <- correlation_pvaluesSpearman(data = getRawData(obj),
                                      genesFromListExpressed,
                                      n.cells = getNumCells(obj))

data.cor.big <- as.matrix(Matrix::forceSymmetric(corr.pval.list$data.cor, uplo = "U"))

htmp <- correlation_plot(data.cor.big,
                         genesList, title="UMI baseline S. corr")


p_values.fromSp.C <- corr.pval.list$p_values
data.cor.bigSp.C <- corr.pval.list$data.cor

rm(corr.pval.list)
gc()
used (Mb) gc trigger (Mb) max used (Mb)
Ncells 11082927 591.9 17840938 952.9 17840938 952.9
Vcells 331724984 2530.9 816577106 6230.0 1144356990 8730.8draw(htmp, heatmap_legend_side="right")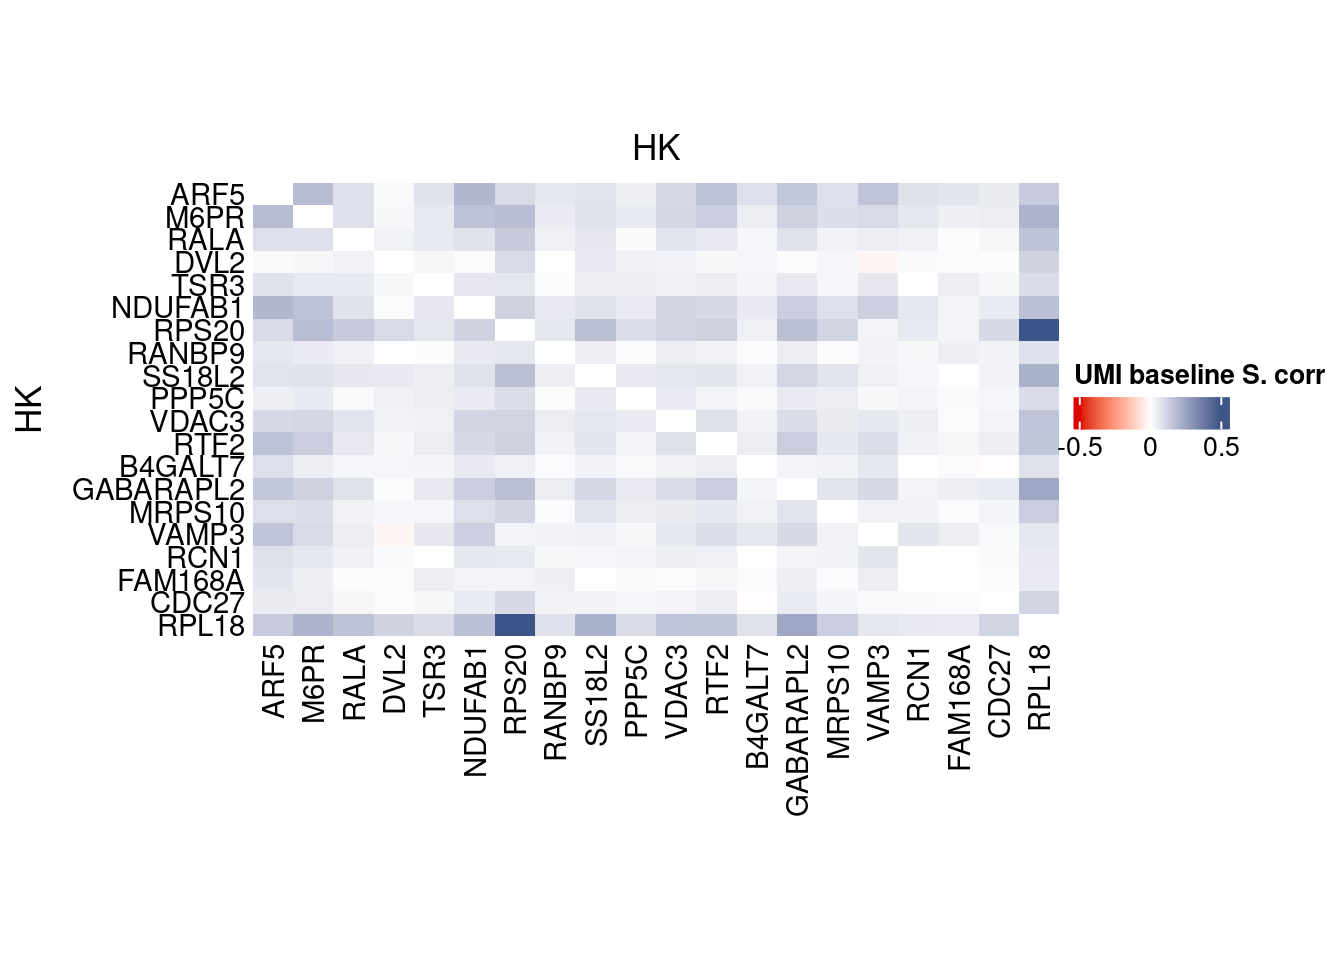
write.csv(as.data.frame(p_values.fromSp.C), paste0("CoexData/BaselineUMISpCorrPValues_", file_code,".csv"))Baseline: Pearson on binarized counts
corr.pval.list <- correlation_pvalues(data = getZeroOneProj(obj),
                                      genesFromListExpressed,
                                      n.cells = getNumCells(obj))

data.cor.big <- as.matrix(Matrix::forceSymmetric(corr.pval.list$data.cor, uplo = "U"))

htmp <- correlation_plotPBMC(data.cor.big,
                         genesList, title="Zero-one P. corr")


p_values.fromSp.C <- corr.pval.list$p_values
data.cor.bigSp.C <- corr.pval.list$data.cor

rm(corr.pval.list)
gc()
used (Mb) gc trigger (Mb) max used (Mb)
Ncells 11082991 591.9 17840938 952.9 17840938 952.9
Vcells 331726018 2530.9 816577106 6230.0 1144356990 8730.8draw(htmp, heatmap_legend_side="right")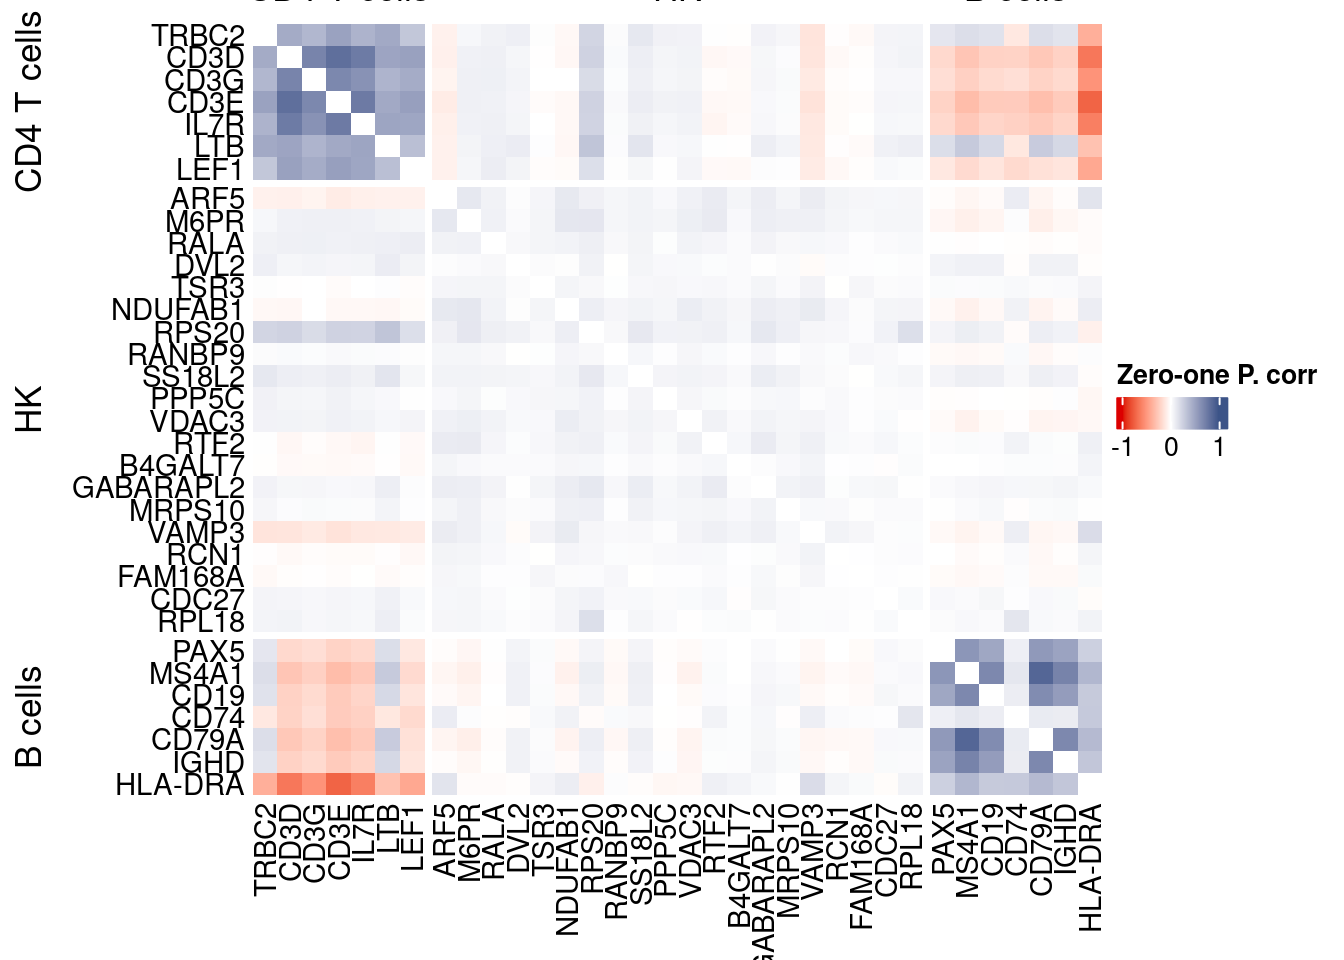
write.csv(as.data.frame(p_values.fromSp.C), paste0("CoexData/ZeroOnePCorrPValues_", file_code,".csv"))Sys.time()[1] "2026-01-21 12:45:54 CET"sessionInfo()R version 4.5.2 (2025-10-31)
Platform: x86_64-pc-linux-gnu
Running under: Ubuntu 22.04.5 LTS
Matrix products: default
BLAS: /usr/lib/x86_64-linux-gnu/blas/libblas.so.3.10.0
LAPACK: /usr/lib/x86_64-linux-gnu/lapack/liblapack.so.3.10.0 LAPACK version 3.10.0
locale:
[1] LC_CTYPE=C.UTF-8 LC_NUMERIC=C LC_TIME=C.UTF-8
[4] LC_COLLATE=C.UTF-8 LC_MONETARY=C.UTF-8 LC_MESSAGES=C.UTF-8
[7] LC_PAPER=C.UTF-8 LC_NAME=C LC_ADDRESS=C
[10] LC_TELEPHONE=C LC_MEASUREMENT=C.UTF-8 LC_IDENTIFICATION=C
time zone: Europe/Rome
tzcode source: system (glibc)
attached base packages:
[1] stats4 parallel grid stats graphics grDevices utils
[8] datasets methods base
other attached packages:
[1] CSCORE_1.0.2 testthat_3.3.2
[3] monocle3_1.3.7 SingleCellExperiment_1.32.0
[5] SummarizedExperiment_1.38.1 GenomicRanges_1.62.1
[7] Seqinfo_1.0.0 IRanges_2.44.0
[9] S4Vectors_0.48.0 MatrixGenerics_1.22.0
[11] matrixStats_1.5.0 Biobase_2.70.0
[13] BiocGenerics_0.56.0 generics_0.1.3
[15] fstcore_0.10.0 fst_0.9.8
[17] stringr_1.6.0 HiClimR_2.2.1
[19] doParallel_1.0.17 iterators_1.0.14
[21] foreach_1.5.2 Rfast_2.1.5.1
[23] RcppParallel_5.1.10 zigg_0.0.2
[25] Rcpp_1.1.0 patchwork_1.3.2
[27] Seurat_5.4.0 SeuratObject_5.3.0
[29] sp_2.2-0 Hmisc_5.2-3
[31] dplyr_1.1.4 circlize_0.4.16
[33] ComplexHeatmap_2.26.0 COTAN_2.11.1
loaded via a namespace (and not attached):
[1] fs_1.6.6 spatstat.sparse_3.1-0
[3] devtools_2.4.5 httr_1.4.7
[5] RColorBrewer_1.1-3 profvis_0.4.0
[7] tools_4.5.2 sctransform_0.4.2
[9] backports_1.5.0 R6_2.6.1
[11] lazyeval_0.2.2 uwot_0.2.3
[13] ggdist_3.3.3 GetoptLong_1.1.0
[15] urlchecker_1.0.1 withr_3.0.2
[17] gridExtra_2.3 parallelDist_0.2.6
[19] progressr_0.18.0 cli_3.6.5
[21] Cairo_1.7-0 spatstat.explore_3.6-0
[23] fastDummies_1.7.5 labeling_0.4.3
[25] S7_0.2.1 spatstat.data_3.1-9
[27] proxy_0.4-29 ggridges_0.5.6
[29] pbapply_1.7-2 foreign_0.8-90
[31] sessioninfo_1.2.3 parallelly_1.46.0
[33] torch_0.16.3 rstudioapi_0.18.0
[35] shape_1.4.6.1 ica_1.0-3
[37] spatstat.random_3.4-3 distributional_0.6.0
[39] dendextend_1.19.0 Matrix_1.7-4
[41] abind_1.4-8 lifecycle_1.0.4
[43] yaml_2.3.10 SparseArray_1.10.8
[45] Rtsne_0.17 glmGamPoi_1.20.0
[47] promises_1.5.0 crayon_1.5.3
[49] miniUI_0.1.2 lattice_0.22-7
[51] beachmat_2.26.0 cowplot_1.2.0
[53] magick_2.9.0 zeallot_0.2.0
[55] pillar_1.11.1 knitr_1.50
[57] rjson_0.2.23 boot_1.3-32
[59] future.apply_1.20.0 codetools_0.2-20
[61] glue_1.8.0 spatstat.univar_3.1-6
[63] remotes_2.5.0 data.table_1.18.0
[65] Rdpack_2.6.4 vctrs_0.7.0
[67] png_0.1-8 spam_2.11-1
[69] gtable_0.3.6 assertthat_0.2.1
[71] cachem_1.1.0 xfun_0.52
[73] rbibutils_2.3 S4Arrays_1.10.1
[75] mime_0.13 reformulas_0.4.1
[77] survival_3.8-3 ncdf4_1.24
[79] ellipsis_0.3.2 fitdistrplus_1.2-2
[81] ROCR_1.0-11 nlme_3.1-168
[83] usethis_3.2.1 bit64_4.6.0-1
[85] RcppAnnoy_0.0.22 rprojroot_2.1.1
[87] GenomeInfoDb_1.44.0 irlba_2.3.5.1
[89] KernSmooth_2.23-26 otel_0.2.0
[91] rpart_4.1.24 colorspace_2.1-1
[93] nnet_7.3-20 tidyselect_1.2.1
[95] processx_3.8.6 bit_4.6.0
[97] compiler_4.5.2 htmlTable_2.4.3
[99] desc_1.4.3 DelayedArray_0.36.0
[101] plotly_4.11.0 checkmate_2.3.2
[103] scales_1.4.0 lmtest_0.9-40
[105] callr_3.7.6 digest_0.6.37
[107] goftest_1.2-3 spatstat.utils_3.2-1
[109] minqa_1.2.8 rmarkdown_2.29
[111] XVector_0.50.0 htmltools_0.5.8.1
[113] pkgconfig_2.0.3 base64enc_0.1-3
[115] coro_1.1.0 lme4_1.1-37
[117] sparseMatrixStats_1.20.0 fastmap_1.2.0
[119] rlang_1.1.7 GlobalOptions_0.1.2
[121] htmlwidgets_1.6.4 ggthemes_5.2.0
[123] UCSC.utils_1.4.0 shiny_1.12.1
[125] DelayedMatrixStats_1.30.0 farver_2.1.2
[127] zoo_1.8-14 jsonlite_2.0.0
[129] BiocParallel_1.44.0 BiocSingular_1.26.1
[131] magrittr_2.0.4 Formula_1.2-5
[133] GenomeInfoDbData_1.2.14 dotCall64_1.2
[135] viridis_0.6.5 reticulate_1.44.1
[137] stringi_1.8.7 brio_1.1.5
[139] MASS_7.3-65 pkgbuild_1.4.7
[141] plyr_1.8.9 listenv_0.10.0
[143] ggrepel_0.9.6 deldir_2.0-4
[145] splines_4.5.2 tensor_1.5
[147] ps_1.9.1 igraph_2.2.1
[149] spatstat.geom_3.6-1 RcppHNSW_0.6.0
[151] pkgload_1.4.0 reshape2_1.4.4
[153] ScaledMatrix_1.16.0 evaluate_1.0.5
[155] nloptr_2.2.1 httpuv_1.6.16
[157] RANN_2.6.2 tidyr_1.3.1
[159] purrr_1.2.0 polyclip_1.10-7
[161] future_1.69.0 clue_0.3-66
[163] scattermore_1.2 ggplot2_4.0.1
[165] rsvd_1.0.5 xtable_1.8-4
[167] RSpectra_0.16-2 later_1.4.2
[169] viridisLite_0.4.2 tibble_3.3.0
[171] memoise_2.0.1 cluster_2.1.8.1
[173] globals_0.18.0