library(COTAN)
library(ComplexHeatmap)
library(circlize)
library(dplyr)
library(Hmisc)
library(Seurat)
library(patchwork)
library(Rfast)
library(parallel)
library(doParallel)
library(HiClimR)
library(stringr)
library(fst)

options(parallelly.fork.enable = TRUE)

dataFile <- "Data/Brown_PBMC_Datasets/capillary_blood_samples_pbmcs-Run_41-Cleaned.RDS"
name <- str_split(dataFile,pattern = "/",simplify = T)[3]
name <- str_remove(name,pattern = "-Cleaned.RDS")
name <- str_remove(name,pattern = "capillary_blood_samples_")

project = name

setLoggingLevel(1)
outDir <- "CoexData/"
setLoggingFile(paste0(outDir, "Logs/",name,".log"))

obj <- readRDS(dataFile)
file_code = nameGene Correlation Analysis for PBMC Brown run 41
Prologue
source("src/Functions.R")To compare the ability of COTAN to asses the real correlation between genes we define some pools of genes:
- Constitutive genes
- Neural progenitor genes
- Pan neuronal genes
- Some layer marker genes
hkGenes  <- read.csv("Data/Housekeeping_TranscriptsHuman.csv", sep = ";")

genesList <- list(
  "CD4 T cells"=
    c("TRBC2","CD3D","CD3G","CD3E","IL7R","LTB","LEF1"),
  "B cells"=
    c("PAX5","MS4A1","CD19","CD74","CD79A","IGHD","HLA-DRA"),
  "hk"= hkGenes$Gene_symbol[1:20], # from https://housekeeping.unicamp.br/
  "general PBMC markers" =
  c("FOXP3","TBX21","GATA3","RUNX1","BCL6","EOMES","EOMES","TBX21","BATF3","IRF2","TCF4","STAT5A","RUNX3","STAT6","BATF","STAT3","TBX21","TBX21","IRF8","IRF4","AHR","STAT1","IRF4","RELB")
)
COTAN
genesFromListExpressed <- unlist(genesList)[unlist(genesList) %in% getGenes(obj)]
int.genes <-getGenes(obj)
obj <- proceedToCoex(obj, calcCoex = TRUE, cores = 5L, saveObj = FALSE)coexMat.big <- getGenesCoex(obj)[genesFromListExpressed,genesFromListExpressed]
coexMat <- getGenesCoex(obj)[c(genesList$`CD4 T cells`,genesList$hk,genesList$`B cells`),c(genesList$`CD4 T cells`,genesList$hk,genesList$`B cells`)]
f1 = colorRamp2(seq(-1,1, length = 3), c("#DC0000B2", "white","#3C5488B2" ))
split.genes <- base::factor(c(rep("CD4 T cells",length(genesList[["CD4 T cells"]])),
rep("HK",length(genesList[["hk"]])),
rep("B cells",length(genesList[["B cells"]]))
),
levels = c("CD4 T cells","HK","B cells"))
lgd = Legend(col_fun = f1, title = "COTAN coex")
htmp <- Heatmap(as.matrix(coexMat),
#width = ncol(coexMat)*unit(2.5, "mm"),
height = nrow(coexMat)*unit(3, "mm"),
cluster_rows = FALSE,
cluster_columns = FALSE,
col = f1,
row_names_side = "left",
row_names_gp = gpar(fontsize = 11),
column_names_gp = gpar(fontsize = 11),
column_split = split.genes,
row_split = split.genes,
cluster_row_slices = FALSE,
cluster_column_slices = FALSE,
heatmap_legend_param = list(
title = "COTAN coex", at = c(-1, 0, 1),
direction = "horizontal",
labels = c("-1", "0", "1")
)
)
draw(htmp, heatmap_legend_side="right")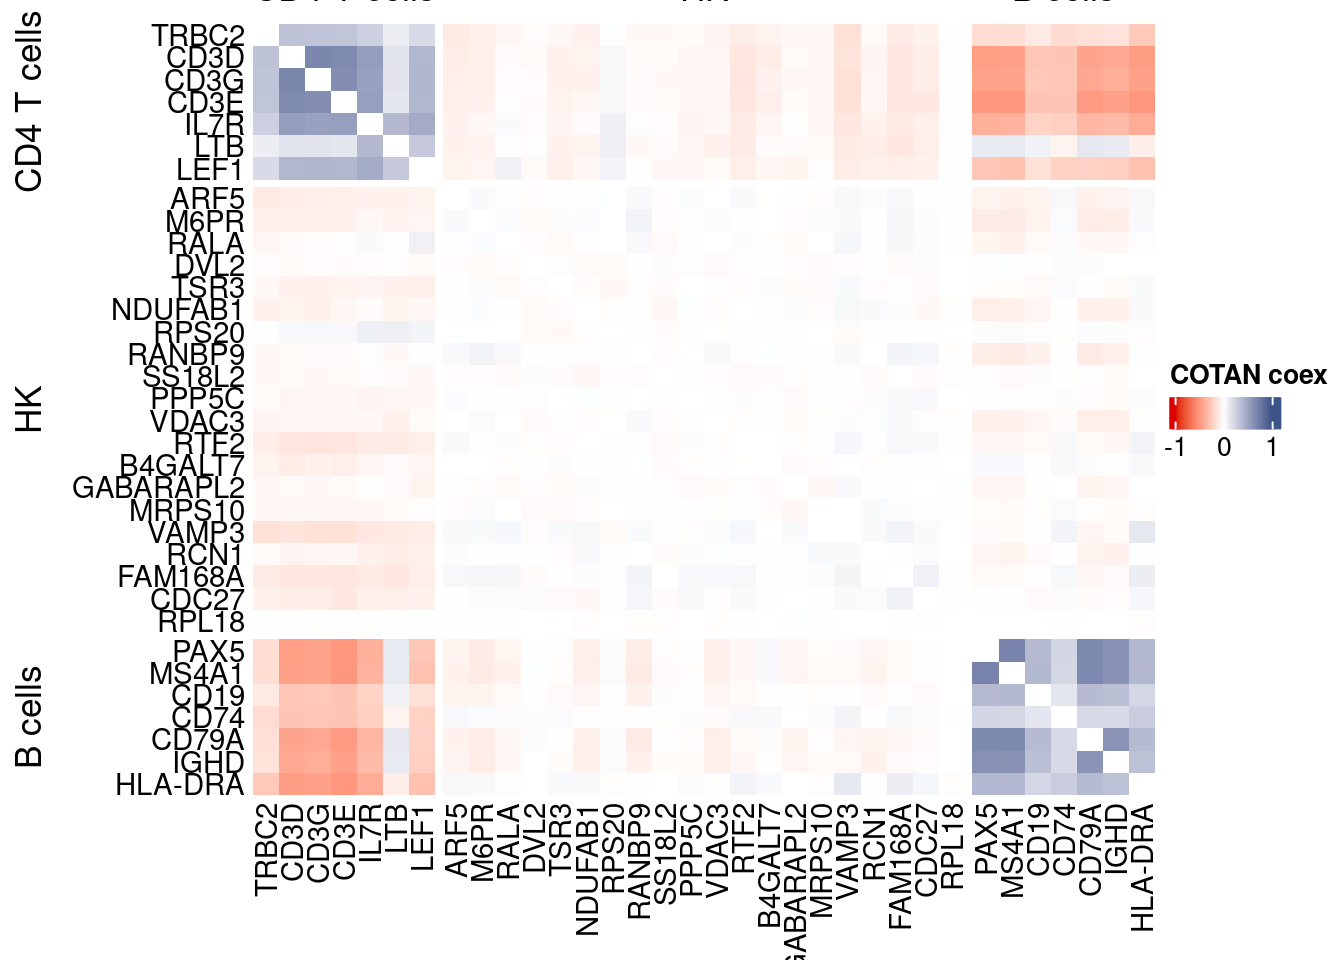
GDI_DF <- calculateGDI(obj)
GDI_DF$geneType <- NA
for (cat in names(genesList)) {
  GDI_DF[rownames(GDI_DF) %in% genesList[[cat]],]$geneType <- cat
}

GDI_DF$GDI_centered <- scale(GDI_DF$GDI,center = T,scale = T)

GDI_DF[genesFromListExpressed,]
sum.raw.norm GDI exp.cells geneType GDI_centered
TRBC2 10.187192 4.4984292 81.8542238 CD4 T cells 2.26945938
CD3D 9.985120 5.0372592 77.3406526 CD4 T cells 2.79488914
CD3G 9.777739 5.0212831 73.3455322 CD4 T cells 2.77931038
CD3E 9.899315 5.0838666 78.3470570 CD4 T cells 2.84033748
IL7R 10.777059 4.7596942 70.8752668 CD4 T cells 2.52422691
LTB 10.732319 4.3577998 82.4641659 CD4 T cells 2.13232725
LEF1 9.638920 4.5153605 51.4181153 CD4 T cells 2.28596961
PAX5 7.564220 4.0984074 9.5303446 B cells 1.87938575
MS4A1 8.454666 4.0658203 13.3729796 B cells 1.84760903
CD19 5.667446 3.1344618 3.1107045 B cells 0.93941255
CD74 10.526868 3.6266151 61.1771882 B cells 1.41932645
CD79A 8.782695 4.0129834 14.9740775 B cells 1.79608618
IGHD 7.795971 3.8759627 8.1579750 B cells 1.66247301
HLA-DRA 10.361036 4.5534065 34.6447088 B cells 2.32306940
ARF5 7.987384 2.7598552 35.2546508 hk 0.57412207
M6PR 8.425626 2.8661832 47.6822202 hk 0.67780587
RALA 8.010453 2.3633225 32.5861543 hk 0.18745084
DVL2 5.899353 1.3478067 4.9557792 hk -0.80280999
TSR3 7.438103 1.8486368 21.8816712 hk -0.31443512
NDUFAB1 8.248456 2.3575435 43.9005794 hk 0.18181550
RPS20 11.267959 1.6314311 99.4358036 hk -0.52623909
RANBP9 8.212536 2.8581453 37.4656908 hk 0.66996779
SS18L2 8.181631 1.7749990 40.6983837 hk -0.38624162
PPP5C 6.376682 1.6179719 7.9749924 hk -0.53936363
VDAC3 8.088924 1.8740999 38.0603843 hk -0.28960523
RTF2 8.147196 2.8252502 39.4784995 hk 0.63789077
B4GALT7 6.154773 1.8329083 6.5568771 hk -0.32977248
GABARAPL2 8.626444 1.8993307 56.4501372 hk -0.26500191
MRPS10 7.549688 1.5469603 23.8792315 hk -0.60860919
VAMP3 6.838970 3.5906260 12.8240317 hk 1.38423242
RCN1 6.375648 2.2135291 8.3409576 hk 0.04138260
FAM168A 7.844182 3.6209699 23.6962489 hk 1.41382170
CDC27 7.990548 2.8688017 32.7081427 hk 0.68035921
RPL18 11.908793 0.4505504 99.9847514 hk -1.67775241
FOXP3 4.466230 1.4232580 0.9454102 general PBMC markers -0.72923514
TBX21 7.239139 3.3625572 11.8176273 general PBMC markers 1.16183544
GATA3 7.889641 3.0847771 25.6938091 general PBMC markers 0.89096346
RUNX1 9.419933 3.3813446 68.6489783 general PBMC markers 1.18015565
BCL6 6.605126 4.2968151 9.7895700 general PBMC markers 2.07285925
EOMES 6.521818 2.6967688 7.0600793 general PBMC markers 0.51260464
EOMES.1 6.521818 2.6967688 7.0600793 general PBMC markers 0.51260464
TBX21.1 7.239139 3.3625572 11.8176273 general PBMC markers 1.16183544
BATF3 4.860277 4.1962603 2.1805428 general PBMC markers 1.97480514
IRF2 8.434082 2.7170863 46.9655383 general PBMC markers 0.53241683
TCF4 7.659169 4.2842690 12.5495578 general PBMC markers 2.06062514
STAT5A 7.057797 2.9567309 16.0872217 general PBMC markers 0.76610169
RUNX3 8.311807 2.5145623 38.0451357 general PBMC markers 0.33492938
STAT6 7.612327 3.7414298 24.8551388 general PBMC markers 1.53128584
BATF 7.445440 2.1988679 18.5422385 general PBMC markers 0.02708604
STAT3 8.503550 2.7092776 47.2400122 general PBMC markers 0.52480237
TBX21.2 7.239139 3.3625572 11.8176273 general PBMC markers 1.16183544
TBX21.3 7.239139 3.3625572 11.8176273 general PBMC markers 1.16183544
IRF8 7.231976 4.4782451 12.7172919 general PBMC markers 2.24977722
IRF4 5.914758 3.4406223 5.0777676 general PBMC markers 1.23795911
AHR 7.752714 4.4853325 17.3223544 general PBMC markers 2.25668838
STAT1 8.265463 2.7465192 32.4794145 general PBMC markers 0.56111772
IRF4.1 5.914758 3.4406223 5.0777676 general PBMC markers 1.23795911
RELB 7.090454 3.8294379 14.7605977 general PBMC markers 1.61710530GDIPlot(obj,GDIIn = GDI_DF, genes = genesList,GDIThreshold = 1.4)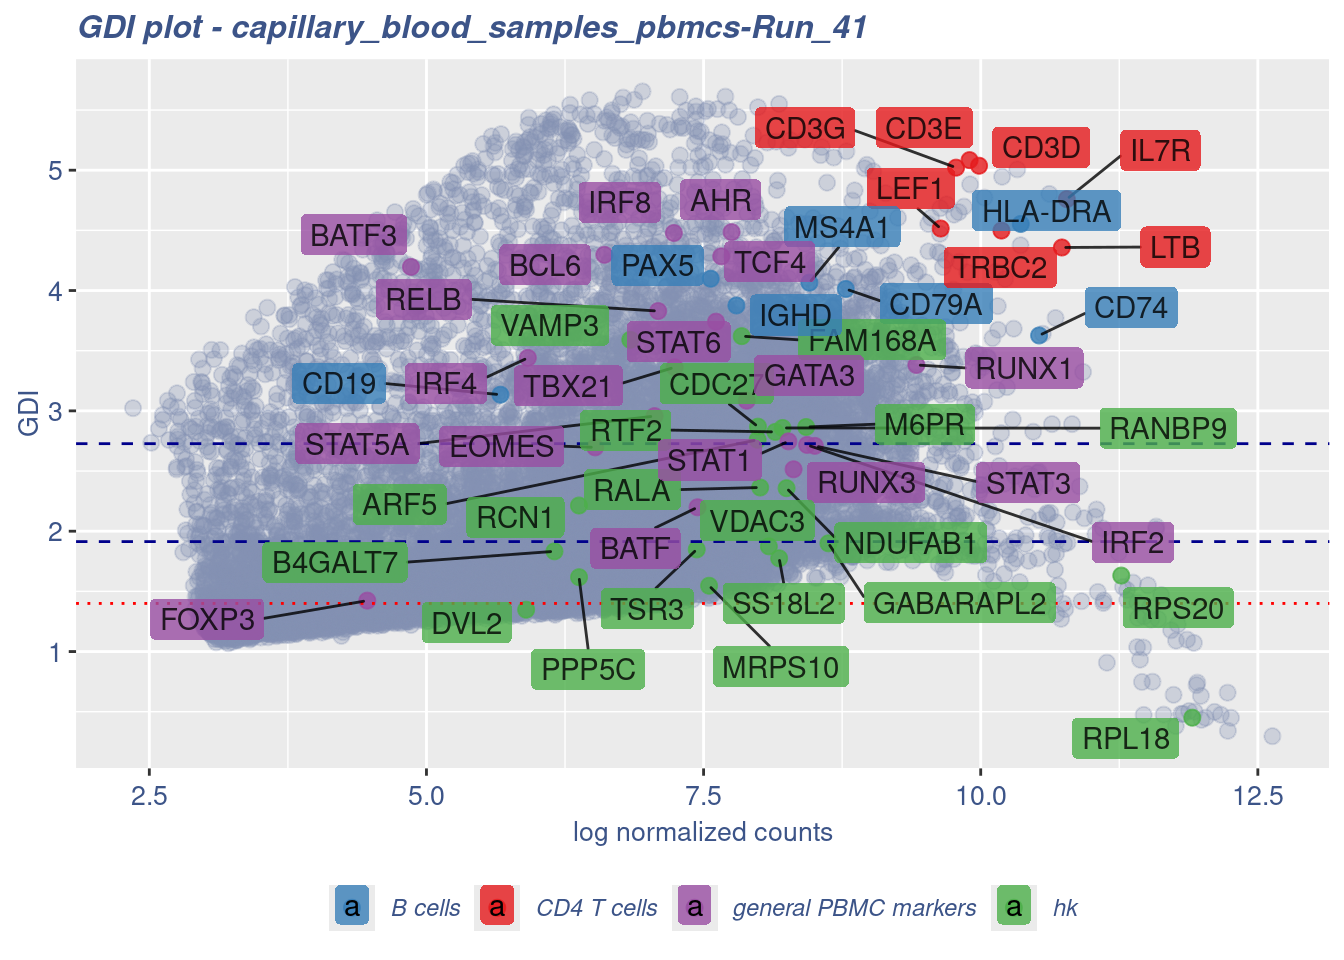
Seurat correlation
srat<- CreateSeuratObject(counts = getRawData(obj),
                          project = project,
                          min.cells = 3,
                          min.features = 200)
srat[["percent.mt"]] <- PercentageFeatureSet(srat, pattern = "^MT-")
srat <- NormalizeData(srat)
srat <- FindVariableFeatures(srat, selection.method = "vst", nfeatures = 2000)

# plot variable features with and without labels
plot1 <- VariableFeaturePlot(srat)

plot1$data$centered_variance <- scale(plot1$data$variance.standardized,
                                      center = T,scale = F)

write.csv(plot1$data,paste0("CoexData/",
                            "Variance_Seurat_genes",
                            file_code,".csv"))

LabelPoints(plot = plot1, points = c(genesList$`CD4 T cells`,genesList$`B cells`,genesList$hk), repel = TRUE)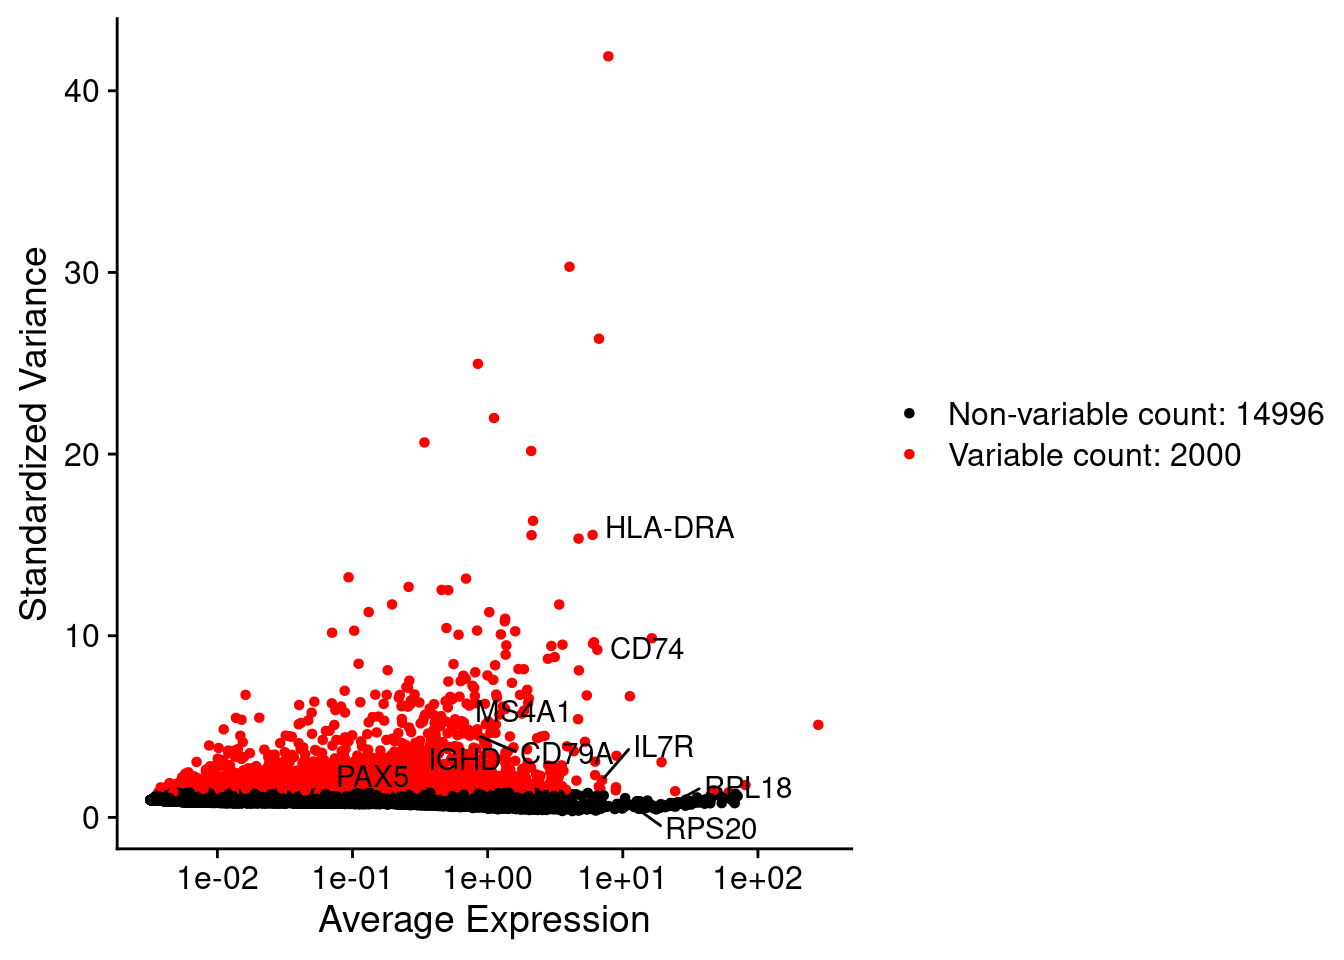
LabelPoints(plot = plot1, points = c(genesList$hk), repel = TRUE)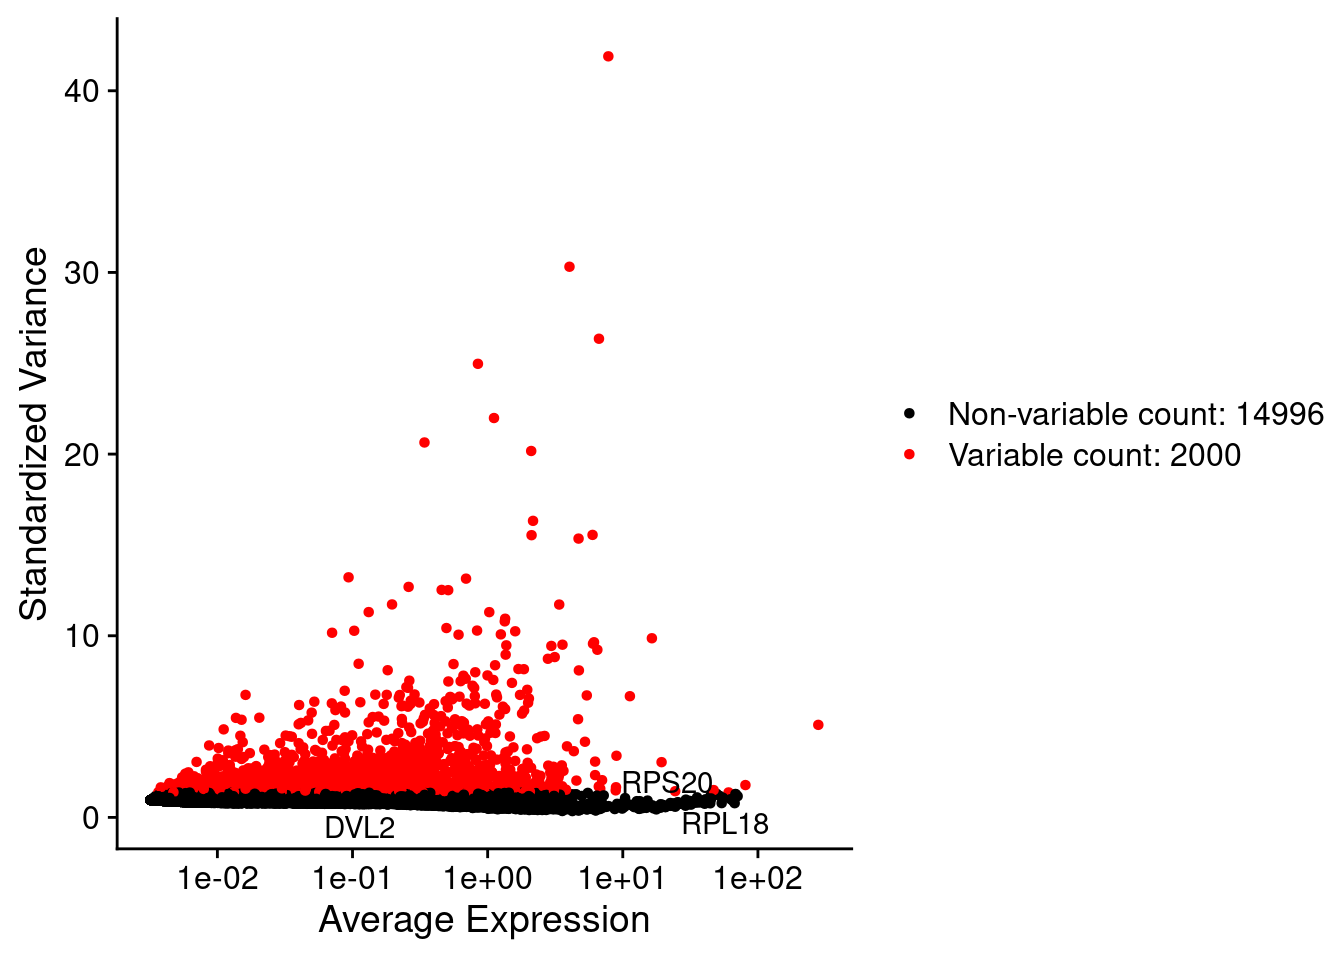
all.genes <- rownames(srat)
srat <- ScaleData(srat, features = all.genes)
seurat.data = GetAssayData(srat[["RNA"]],layer = "data")
corr.pval.list <- correlation_pvalues(data = seurat.data,
genesFromListExpressed,
n.cells = getNumCells(obj))
seurat.data.cor.big <- as.matrix(Matrix::forceSymmetric(corr.pval.list$data.cor, uplo = "U"))
htmp <- correlation_plotPBMC(seurat.data.cor.big,
genesList, title="Seurat corr")
p_values.fromSeurat <- corr.pval.list$p_values
seurat.data.cor.big <- corr.pval.list$data.cor
rm(corr.pval.list)
gc() used (Mb) gc trigger (Mb) max used (Mb)
Ncells 10573808 564.8 17840501 952.8 17840501 952.8
Vcells 372890907 2845.0 731692090 5582.4 1775750995 13548.0draw(htmp, heatmap_legend_side="right")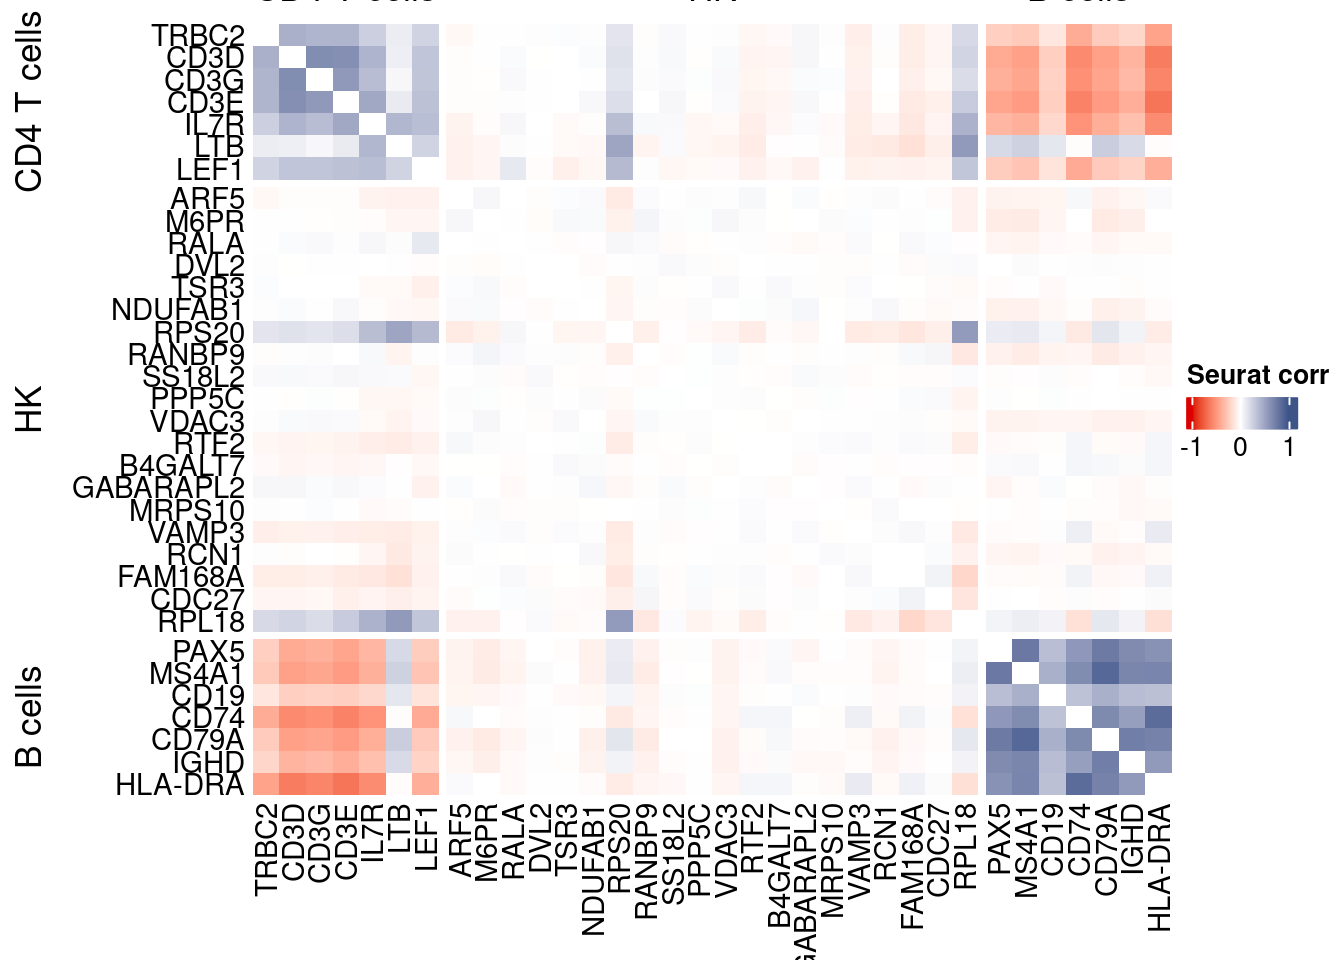
rm(seurat.data.cor.big)
rm(p_values.fromSeurat)

sratbase <- srat
Seurat SC Transform
srat <-  SCTransform(srat,
                     method = "glmGamPoi",
                     vars.to.regress = "percent.mt",
                     verbose = FALSE)

seurat.data <- GetAssayData(srat[["SCT"]],layer = "data")

#Remove genes with all zeros
seurat.data <-seurat.data[rowSums(seurat.data) > 0,]


corr.pval.list <- correlation_pvalues(seurat.data,
                                      genesFromListExpressed,
                                      n.cells = getNumCells(obj))


seurat.data.cor.big <- as.matrix(Matrix::forceSymmetric(corr.pval.list$data.cor, uplo = "U"))

htmp <- correlation_plotPBMC(seurat.data.cor.big,
                         genesList, title="Seurat corr SCT")


p_values.fromSeurat <- corr.pval.list$p_values
seurat.data.cor.big <- corr.pval.list$data.cor

rm(corr.pval.list)
gc()
used (Mb) gc trigger (Mb) max used (Mb)
Ncells 10902018 582.3 17840501 952.8 17840501 952.8
Vcells 439982105 3356.8 1053812609 8040.0 1775750995 13548.0draw(htmp, heatmap_legend_side="right")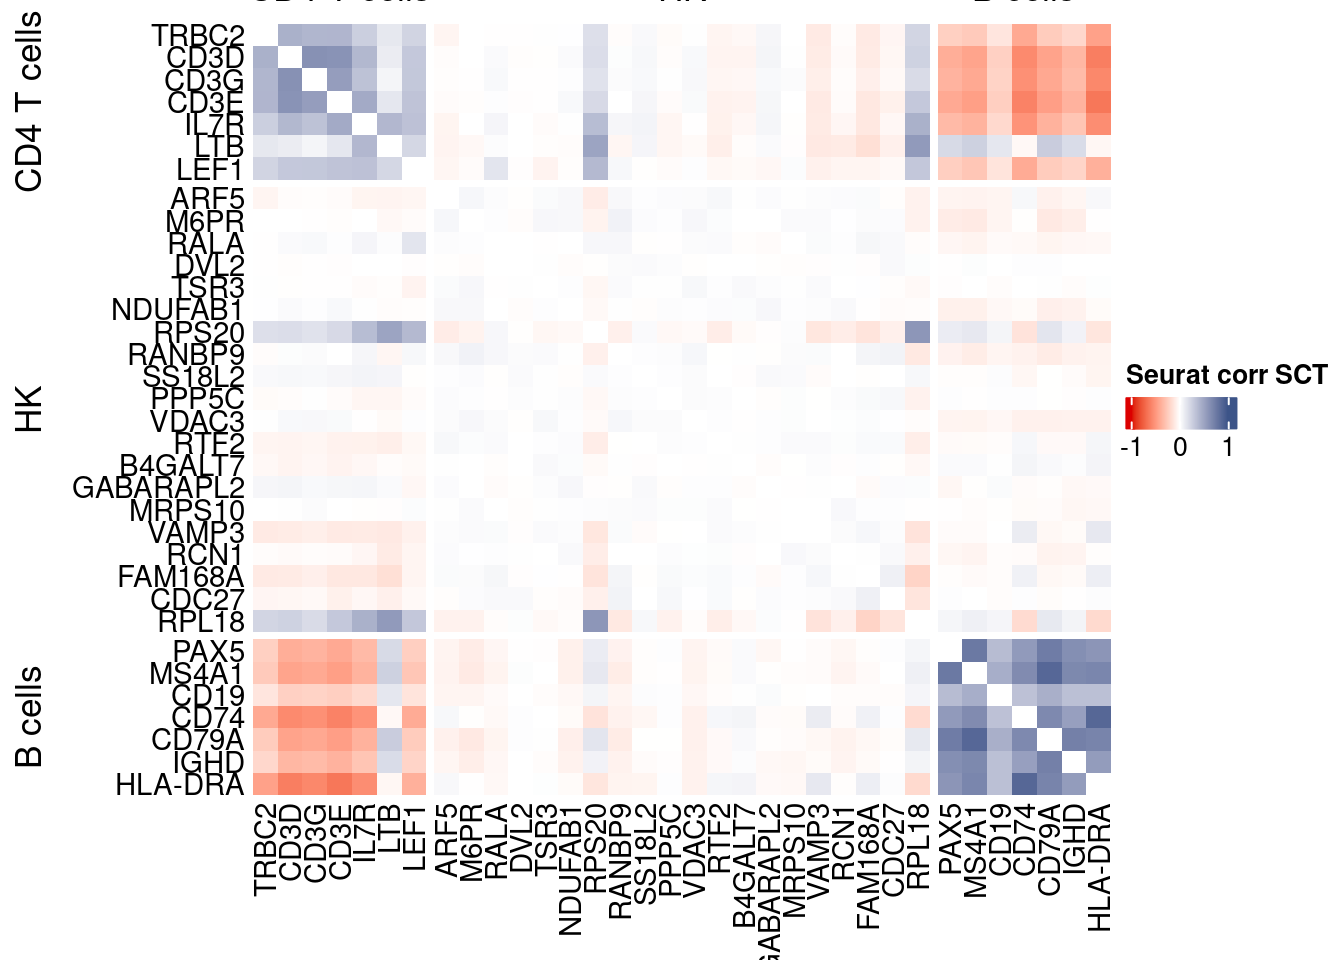
plot1 <- VariableFeaturePlot(srat)

plot1$data$centered_variance <- scale(plot1$data$residual_variance,
center = T,scale = F)write.csv(plot1$data,paste0("CoexData/",
"Variance_SeuratSCT_genes",
file_code,".csv"))
write_fst(as.data.frame(seurat.data.cor.big),path = paste0("CoexData/SeuratCorrSCT_",file_code,".fst"), compress = 100)
write_fst(as.data.frame(p_values.fromSeurat),path = paste0("CoexData/SeuratPValuesSCT_", file_code,".fst"))
write.csv(as.data.frame(p_values.fromSeurat),paste0("CoexData/SeuratPValuesSCT_", file_code,".csv"))
rm(seurat.data.cor.big)
rm(p_values.fromSeurat)Monocle
library(monocle3)cds <- new_cell_data_set(getRawData(obj),
# cell_metadata = getMetadataCells(obj),
# gene_metadata = getMetadataGenes(obj)
)
cds <- preprocess_cds(cds, num_dim = 100)
normalized_counts <- normalized_counts(cds)#Remove genes with all zeros
normalized_counts <- normalized_counts[rowSums(normalized_counts) > 0,]
corr.pval.list <- correlation_pvalues(normalized_counts,
genesFromListExpressed,
n.cells = getNumCells(obj))
rm(normalized_counts)
monocle.data.cor.big <- as.matrix(Matrix::forceSymmetric(corr.pval.list$data.cor, uplo = "U"))
htmp <- correlation_plotPBMC(data.cor.big = monocle.data.cor.big,
genesList,
title = "Monocle corr")
p_values.from.monocle <- corr.pval.list$p_values
monocle.data.cor.big <- corr.pval.list$data.cor
rm(corr.pval.list)
gc() used (Mb) gc trigger (Mb) max used (Mb)
Ncells 11088137 592.2 17840501 952.8 17840501 952.8
Vcells 442703550 3377.6 1053812609 8040.0 1775750995 13548.0draw(htmp, heatmap_legend_side="right")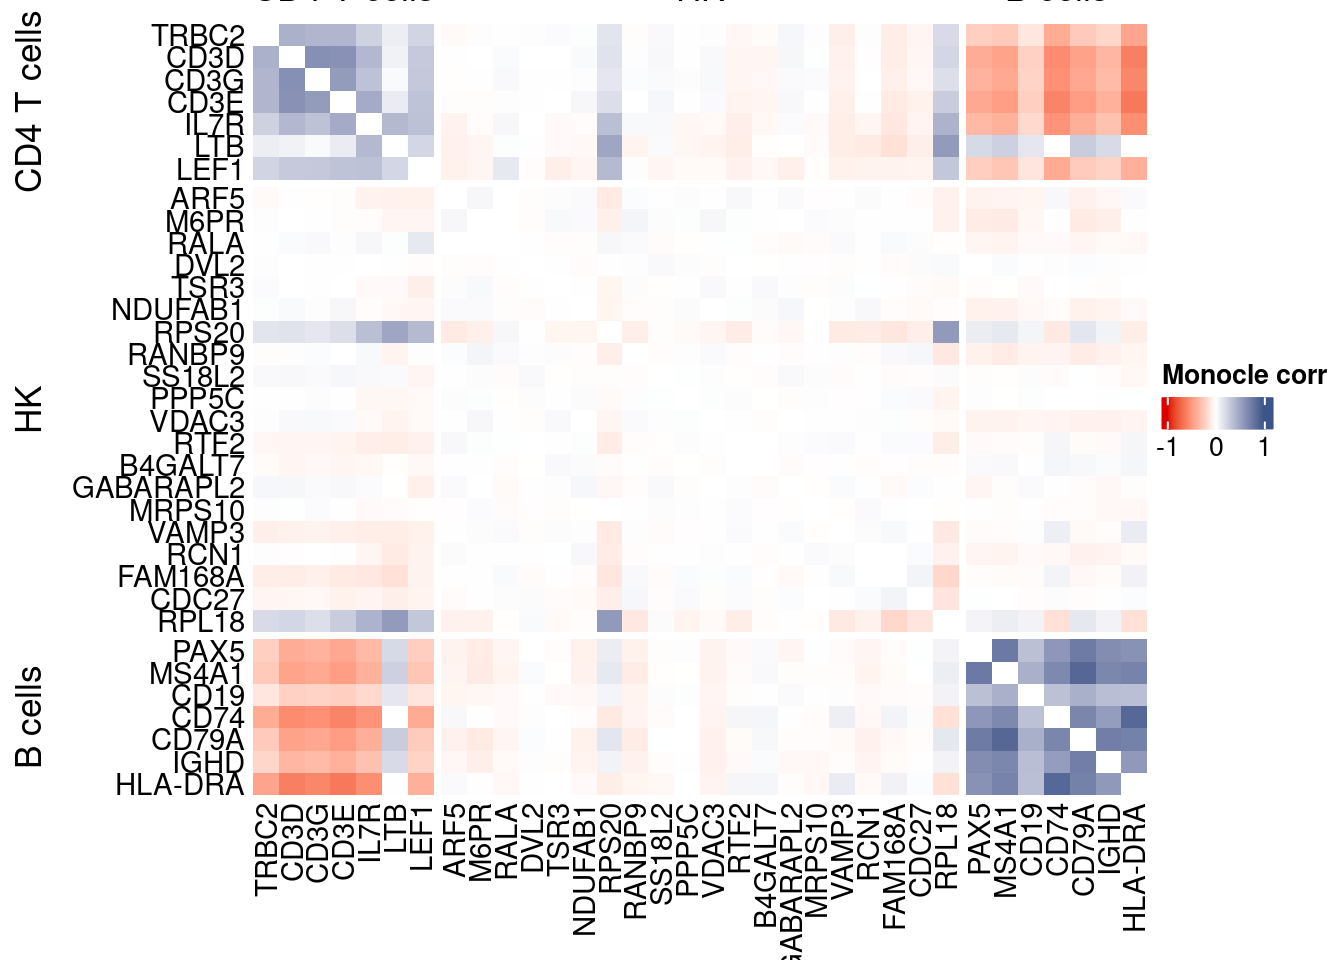
Cs-Core
devtools::load_all("../CS-CORE/")Extract CS_CORE corr matrix
#seuratObj@assays$RNA@counts <- ceiling(seuratObj@assays$RNA@counts)
csCoreRes <- CSCORE(sratbase, genes = genesFromListExpressed)
[INFO] IRLS converged after 3 iterations.
[INFO] Starting WLS for covariance at Thu Jan 22 13:46:24 2026
[INFO] 5 among 58 genes have invalid variance estimates. Their co-expressions with other genes were set to 0.
[INFO] 0.6050% co-expression estimates were greater than 1 and were set to 1.
[INFO] 0.0000% co-expression estimates were smaller than -1 and were set to -1.
[INFO] Finished WLS. Elapsed time: 0.8956 seconds.mat <- as.matrix(csCoreRes$est)
diag(mat) <- 0
split.genes <- base::factor(c(rep("CD4 T cells",sum(genesList[["CD4 T cells"]] %in% genesFromListExpressed)),
rep("HK",sum(genesList[["hk"]] %in% genesFromListExpressed)),
rep("B cells",sum(genesList[["B cells"]] %in% genesFromListExpressed))
),
levels = c("CD4 T cells","HK","B cells"))
f1 = colorRamp2(seq(-1,1, length = 3), c("#DC0000B2", "white","#3C5488B2" ))
htmp <- Heatmap(as.matrix(mat[c(genesList$`CD4 T cells`,genesList$hk,genesList$`B cells`),c(genesList$`CD4 T cells`,genesList$hk,genesList$`B cells`)]),
#width = ncol(coexMat)*unit(2.5, "mm"),
height = nrow(mat)*unit(3, "mm"),
cluster_rows = FALSE,
cluster_columns = FALSE,
col = f1,
row_names_side = "left",
row_names_gp = gpar(fontsize = 11),
column_names_gp = gpar(fontsize = 11),
column_split = split.genes,
row_split = split.genes,
cluster_row_slices = FALSE,
cluster_column_slices = FALSE,
heatmap_legend_param = list(
title = "CS-CORE", at = c(-1, 0, 1),
direction = "horizontal",
labels = c("-1", "0", "1")
)
)
draw(htmp, heatmap_legend_side="right")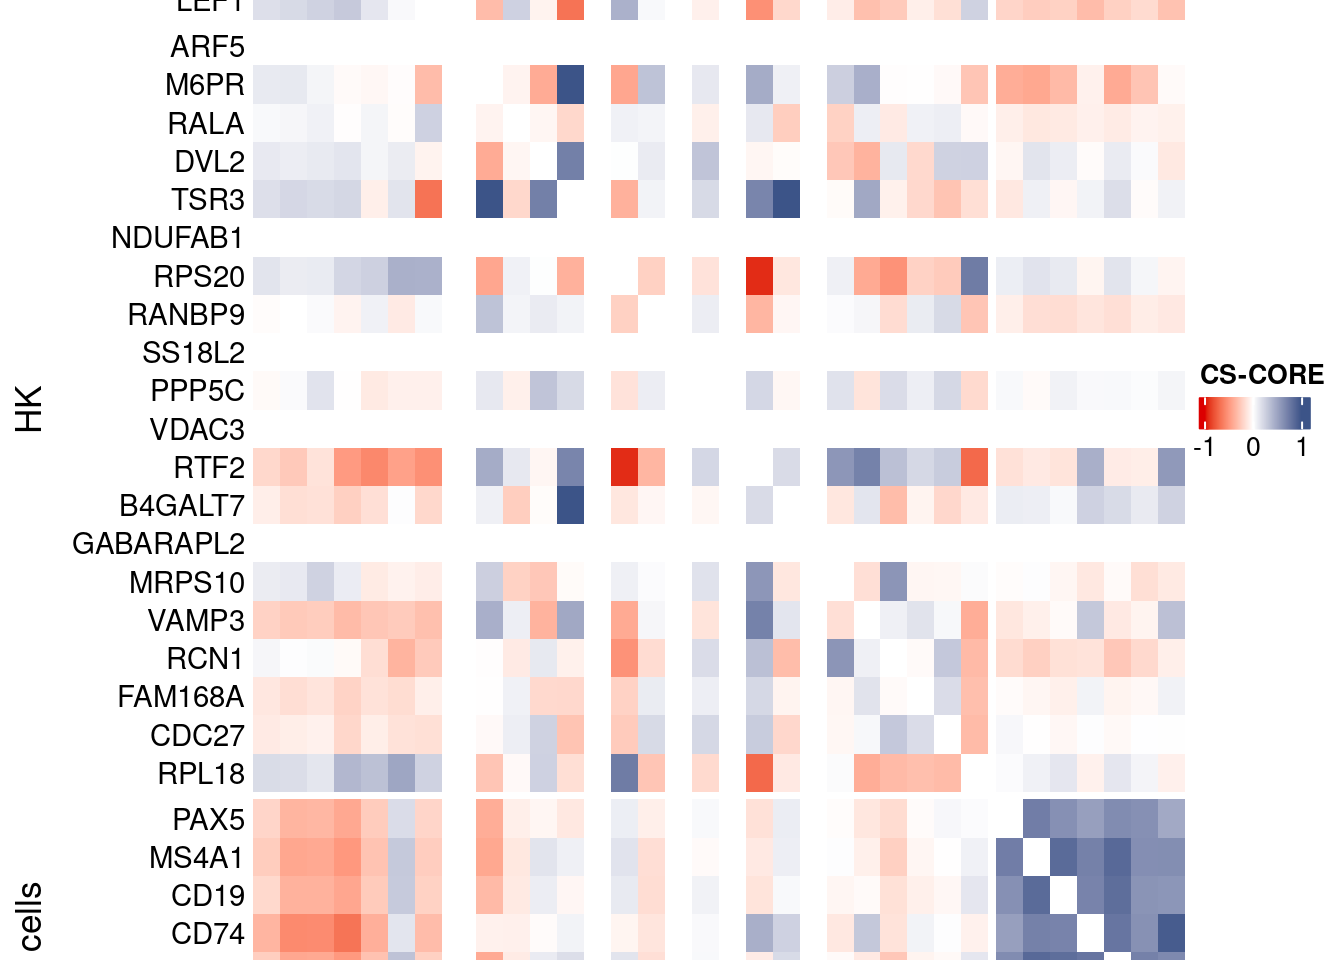
Save CS_CORE matrix
write_fst(as.data.frame(csCoreRes$est), path = paste0("CoexData/CS_CORECorr_", file_code,".fst"),compress = 100)
write_fst(as.data.frame(csCoreRes$p_value), path = paste0("CoexData/CS_COREPValues_", file_code,".fst"),compress = 100)
write.csv(as.data.frame(csCoreRes$p_value), paste0("CoexData/CS_COREPValues_", file_code,".csv"))
Baseline: Spearman on UMI counts
corr.pval.list <- correlation_pvaluesSpearman(data = getRawData(obj),
                                      genesFromListExpressed,
                                      n.cells = getNumCells(obj))

data.cor.big <- as.matrix(Matrix::forceSymmetric(corr.pval.list$data.cor, uplo = "U"))

htmp <- correlation_plot(data.cor.big,
                         genesList, title="UMI baseline S. corr")


p_values.fromSp.C <- corr.pval.list$p_values
data.cor.bigSp.C <- corr.pval.list$data.cor

rm(corr.pval.list)
gc()
used (Mb) gc trigger (Mb) max used (Mb)
Ncells 11209270 598.7 17840501 952.8 17840501 952.8
Vcells 442932775 3379.4 1053812609 8040.0 1775750995 13548.0draw(htmp, heatmap_legend_side="right")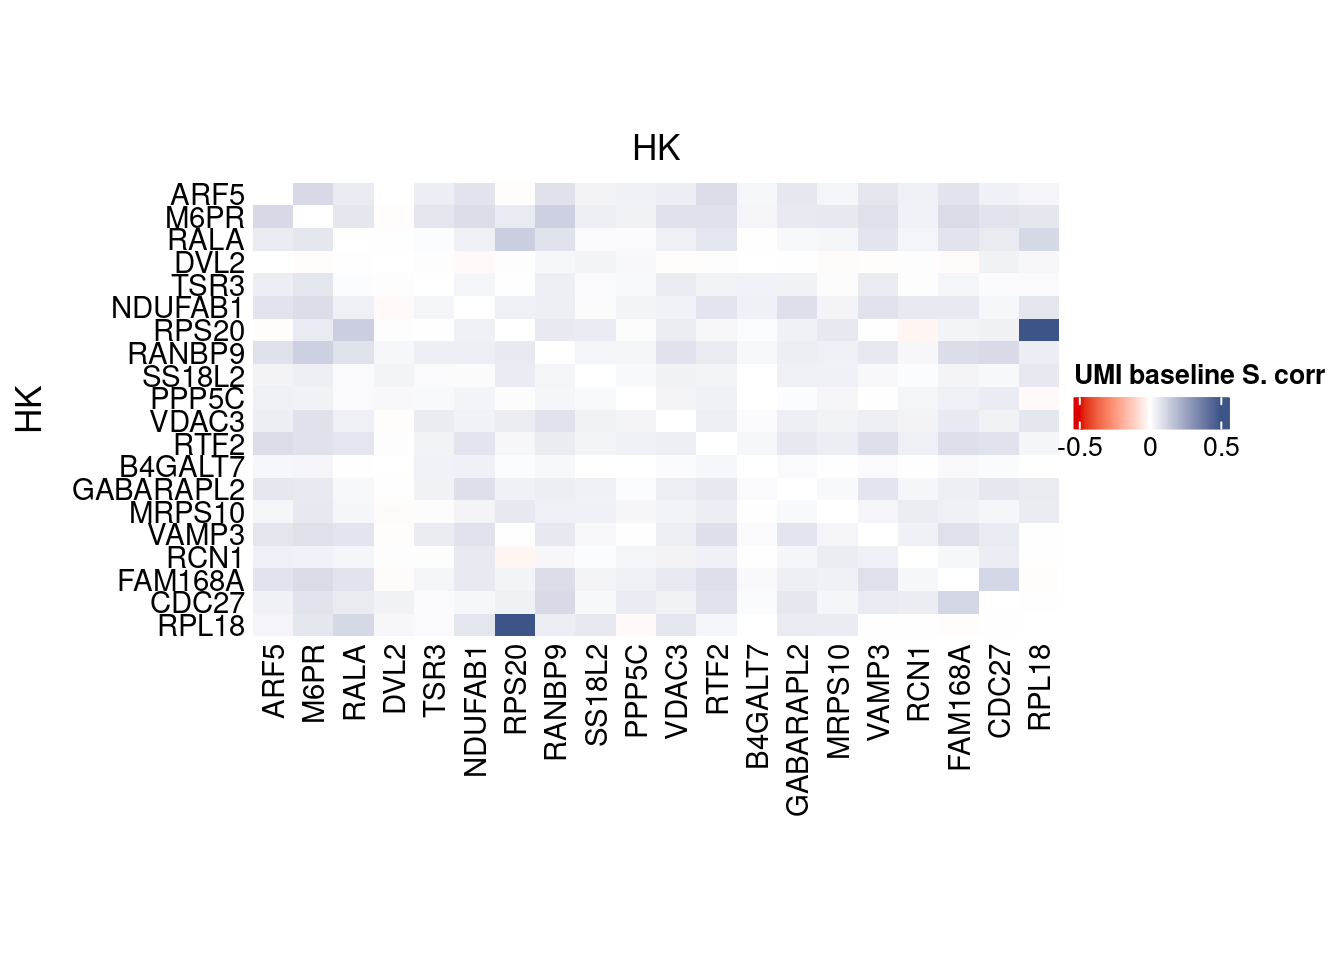
write.csv(as.data.frame(p_values.fromSp.C), paste0("CoexData/BaselineUMISpCorrPValues_", file_code,".csv"))Baseline: Pearson on binarized counts
corr.pval.list <- correlation_pvalues(data = getZeroOneProj(obj),
                                      genesFromListExpressed,
                                      n.cells = getNumCells(obj))

data.cor.big <- as.matrix(Matrix::forceSymmetric(corr.pval.list$data.cor, uplo = "U"))

htmp <- correlation_plotPBMC(data.cor.big,
                         genesList, title="Zero-one P. corr")


p_values.fromSp.C <- corr.pval.list$p_values
data.cor.bigSp.C <- corr.pval.list$data.cor

rm(corr.pval.list)
gc()
used (Mb) gc trigger (Mb) max used (Mb)
Ncells 11209340 598.7 17840501 952.8 17840501 952.8
Vcells 442933821 3379.4 1053812609 8040.0 1775750995 13548.0draw(htmp, heatmap_legend_side="right")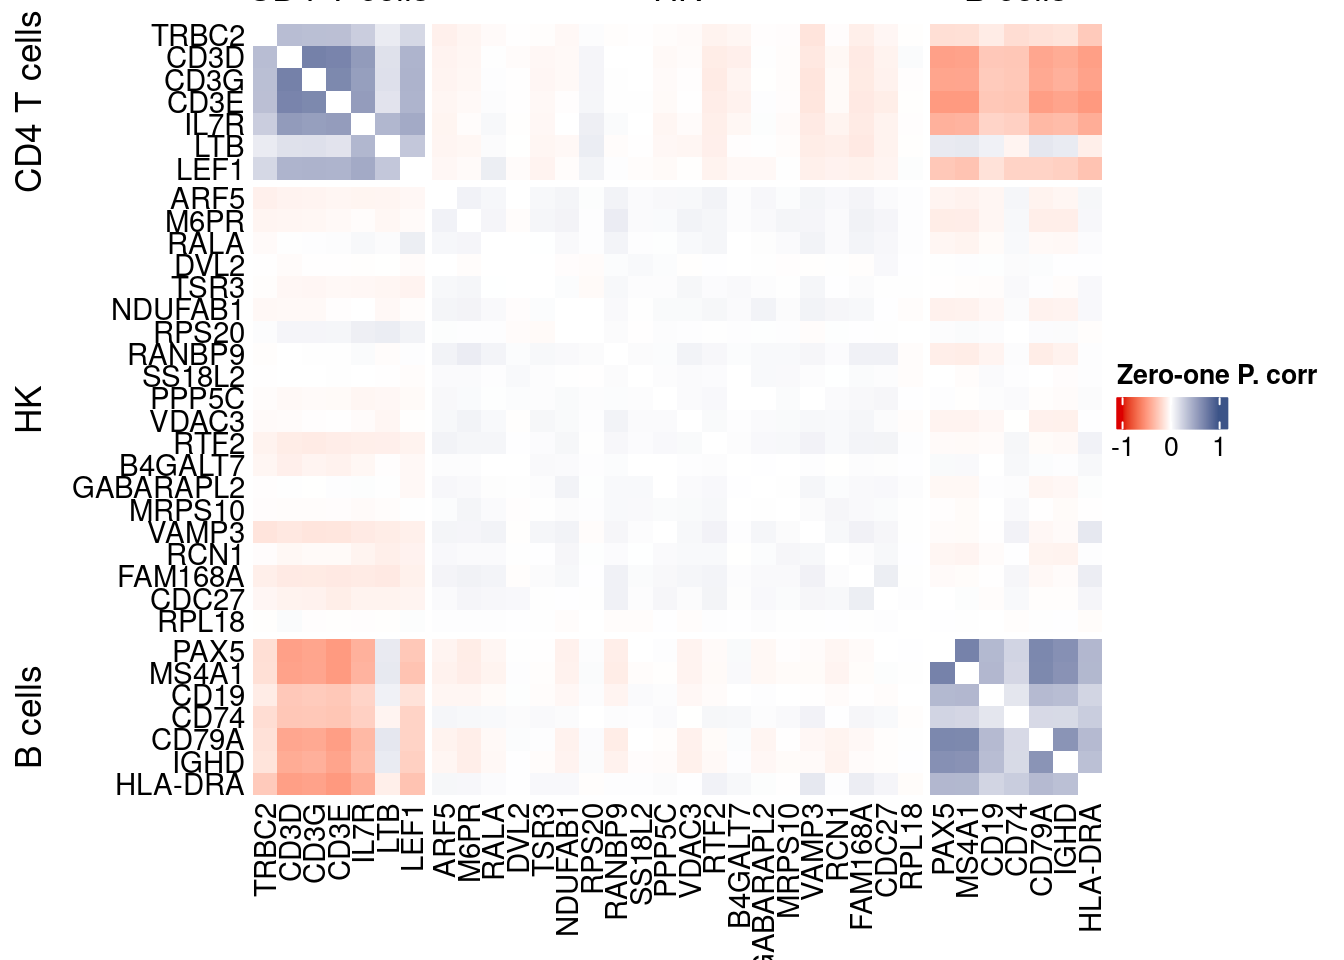
write.csv(as.data.frame(p_values.fromSp.C), paste0("CoexData/ZeroOnePCorrPValues_", file_code,".csv"))Sys.time()[1] "2026-01-22 13:46:29 CET"sessionInfo()R version 4.5.2 (2025-10-31)
Platform: x86_64-pc-linux-gnu
Running under: Ubuntu 22.04.5 LTS
Matrix products: default
BLAS: /usr/lib/x86_64-linux-gnu/blas/libblas.so.3.10.0
LAPACK: /usr/lib/x86_64-linux-gnu/lapack/liblapack.so.3.10.0 LAPACK version 3.10.0
locale:
[1] LC_CTYPE=C.UTF-8 LC_NUMERIC=C LC_TIME=C.UTF-8
[4] LC_COLLATE=C.UTF-8 LC_MONETARY=C.UTF-8 LC_MESSAGES=C.UTF-8
[7] LC_PAPER=C.UTF-8 LC_NAME=C LC_ADDRESS=C
[10] LC_TELEPHONE=C LC_MEASUREMENT=C.UTF-8 LC_IDENTIFICATION=C
time zone: Europe/Rome
tzcode source: system (glibc)
attached base packages:
[1] stats4 parallel grid stats graphics grDevices utils
[8] datasets methods base
other attached packages:
[1] CSCORE_1.0.2 testthat_3.3.2
[3] monocle3_1.3.7 SingleCellExperiment_1.32.0
[5] SummarizedExperiment_1.38.1 GenomicRanges_1.62.1
[7] Seqinfo_1.0.0 IRanges_2.44.0
[9] S4Vectors_0.48.0 MatrixGenerics_1.22.0
[11] matrixStats_1.5.0 Biobase_2.70.0
[13] BiocGenerics_0.56.0 generics_0.1.3
[15] fstcore_0.10.0 fst_0.9.8
[17] stringr_1.6.0 HiClimR_2.2.1
[19] doParallel_1.0.17 iterators_1.0.14
[21] foreach_1.5.2 Rfast_2.1.5.1
[23] RcppParallel_5.1.10 zigg_0.0.2
[25] Rcpp_1.1.0 patchwork_1.3.2
[27] Seurat_5.4.0 SeuratObject_5.3.0
[29] sp_2.2-0 Hmisc_5.2-3
[31] dplyr_1.1.4 circlize_0.4.16
[33] ComplexHeatmap_2.26.0 COTAN_2.11.1
loaded via a namespace (and not attached):
[1] fs_1.6.6 spatstat.sparse_3.1-0
[3] devtools_2.4.5 httr_1.4.7
[5] RColorBrewer_1.1-3 profvis_0.4.0
[7] tools_4.5.2 sctransform_0.4.2
[9] backports_1.5.0 R6_2.6.1
[11] lazyeval_0.2.2 uwot_0.2.3
[13] ggdist_3.3.3 GetoptLong_1.1.0
[15] urlchecker_1.0.1 withr_3.0.2
[17] gridExtra_2.3 parallelDist_0.2.6
[19] progressr_0.18.0 cli_3.6.5
[21] Cairo_1.7-0 spatstat.explore_3.6-0
[23] fastDummies_1.7.5 labeling_0.4.3
[25] S7_0.2.1 spatstat.data_3.1-9
[27] proxy_0.4-29 ggridges_0.5.6
[29] pbapply_1.7-2 foreign_0.8-90
[31] sessioninfo_1.2.3 parallelly_1.46.0
[33] torch_0.16.3 rstudioapi_0.18.0
[35] shape_1.4.6.1 ica_1.0-3
[37] spatstat.random_3.4-3 distributional_0.6.0
[39] dendextend_1.19.0 Matrix_1.7-4
[41] abind_1.4-8 lifecycle_1.0.4
[43] yaml_2.3.10 SparseArray_1.10.8
[45] Rtsne_0.17 glmGamPoi_1.20.0
[47] promises_1.5.0 crayon_1.5.3
[49] miniUI_0.1.2 lattice_0.22-7
[51] beachmat_2.26.0 cowplot_1.2.0
[53] magick_2.9.0 zeallot_0.2.0
[55] pillar_1.11.1 knitr_1.50
[57] rjson_0.2.23 boot_1.3-32
[59] future.apply_1.20.0 codetools_0.2-20
[61] glue_1.8.0 spatstat.univar_3.1-6
[63] remotes_2.5.0 data.table_1.18.0
[65] Rdpack_2.6.4 vctrs_0.7.0
[67] png_0.1-8 spam_2.11-1
[69] gtable_0.3.6 assertthat_0.2.1
[71] cachem_1.1.0 xfun_0.52
[73] rbibutils_2.3 S4Arrays_1.10.1
[75] mime_0.13 reformulas_0.4.1
[77] survival_3.8-3 ncdf4_1.24
[79] ellipsis_0.3.2 fitdistrplus_1.2-2
[81] ROCR_1.0-11 nlme_3.1-168
[83] usethis_3.2.1 bit64_4.6.0-1
[85] RcppAnnoy_0.0.22 rprojroot_2.1.1
[87] GenomeInfoDb_1.44.0 irlba_2.3.5.1
[89] KernSmooth_2.23-26 otel_0.2.0
[91] rpart_4.1.24 colorspace_2.1-1
[93] nnet_7.3-20 tidyselect_1.2.1
[95] processx_3.8.6 bit_4.6.0
[97] compiler_4.5.2 htmlTable_2.4.3
[99] desc_1.4.3 DelayedArray_0.36.0
[101] plotly_4.11.0 checkmate_2.3.2
[103] scales_1.4.0 lmtest_0.9-40
[105] callr_3.7.6 digest_0.6.37
[107] goftest_1.2-3 spatstat.utils_3.2-1
[109] minqa_1.2.8 rmarkdown_2.29
[111] XVector_0.50.0 htmltools_0.5.8.1
[113] pkgconfig_2.0.3 base64enc_0.1-3
[115] coro_1.1.0 lme4_1.1-37
[117] sparseMatrixStats_1.20.0 fastmap_1.2.0
[119] rlang_1.1.7 GlobalOptions_0.1.2
[121] htmlwidgets_1.6.4 ggthemes_5.2.0
[123] UCSC.utils_1.4.0 shiny_1.12.1
[125] DelayedMatrixStats_1.30.0 farver_2.1.2
[127] zoo_1.8-14 jsonlite_2.0.0
[129] BiocParallel_1.44.0 BiocSingular_1.26.1
[131] magrittr_2.0.4 Formula_1.2-5
[133] GenomeInfoDbData_1.2.14 dotCall64_1.2
[135] viridis_0.6.5 reticulate_1.44.1
[137] stringi_1.8.7 brio_1.1.5
[139] MASS_7.3-65 pkgbuild_1.4.7
[141] plyr_1.8.9 listenv_0.10.0
[143] ggrepel_0.9.6 deldir_2.0-4
[145] splines_4.5.2 tensor_1.5
[147] ps_1.9.1 igraph_2.2.1
[149] spatstat.geom_3.6-1 RcppHNSW_0.6.0
[151] pkgload_1.4.0 reshape2_1.4.4
[153] ScaledMatrix_1.16.0 evaluate_1.0.5
[155] nloptr_2.2.1 httpuv_1.6.16
[157] RANN_2.6.2 tidyr_1.3.1
[159] purrr_1.2.0 polyclip_1.10-7
[161] future_1.69.0 clue_0.3-66
[163] scattermore_1.2 ggplot2_4.0.1
[165] rsvd_1.0.5 xtable_1.8-4
[167] RSpectra_0.16-2 later_1.4.2
[169] viridisLite_0.4.2 tibble_3.3.0
[171] memoise_2.0.1 cluster_2.1.8.1
[173] globals_0.18.0